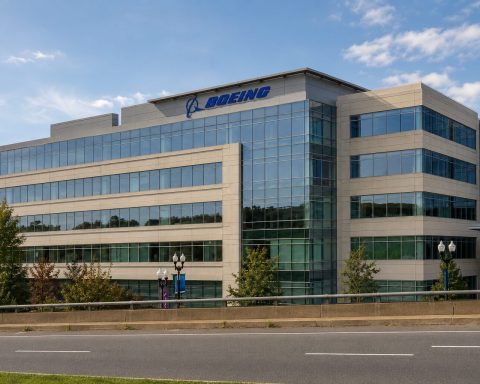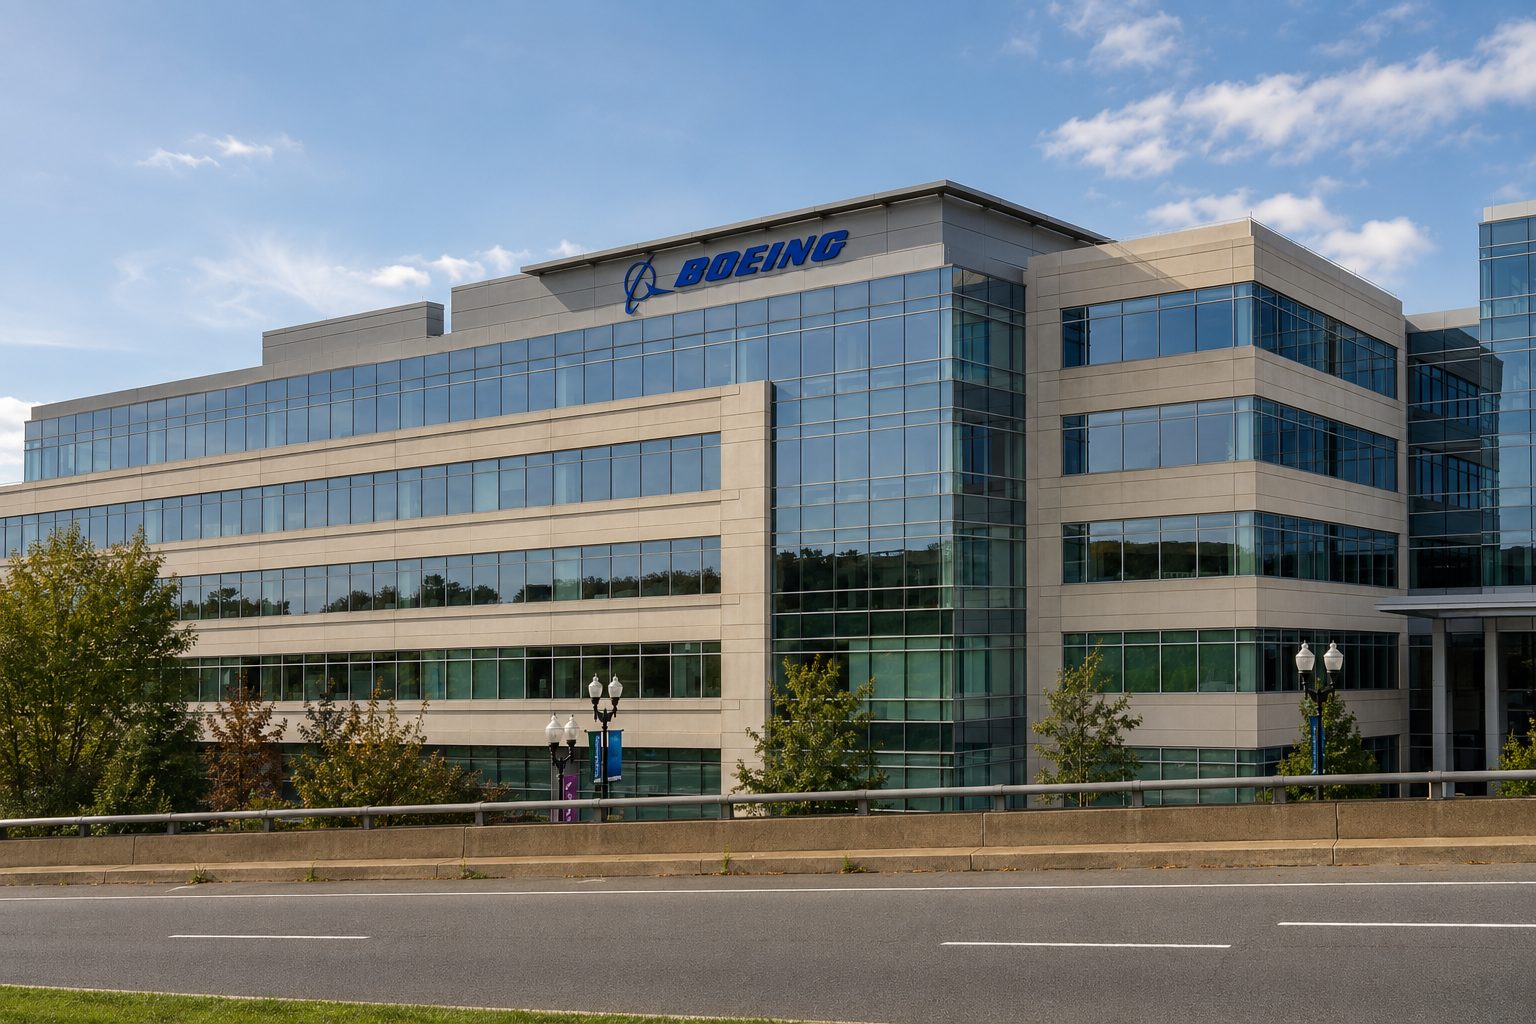
Boeing shares declined 3.2%, closing at $215.10 on Thursday. The $7.09 slide wiped out roughly $5.6 billion in market value based on 790.37 million shares outstanding. A new documentary has brought renewed scrutiny to Boeing’s safety culture as the company works to restore production levels and cash flow.
| Q1 bookings | Share |
|---|---|
| Mobile | 53% |
| Console | 38% |
| PC & other | 9% |
| Digital distribution | 99% |
| Metric | Q1 FY27 |
|---|---|
| Revenue | $2.418bn |
| YoY growth | +28% |
| Data center | $1.833bn |
| Data-center mix | 76% |
| Non-GAAP EPS | $0.80 |
| Company | Move |
|---|---|
| Marvell | +5.79% |
| Broadcom | +0.43% |
| NVIDIA | -0.33% |
| Alphabet | -1.17% |
| Target | Value |
|---|---|
| Average | $276.38 |
| High | $400 |
| Low | $180 |
June-quarter 2026 results · Figures in renminbi unless noted
August 20, 2026, 18:59 EDT
AI Labs and Applications lost 2.46 times the RMB5.63 billion adjusted EBITA earned by AI Cloud. Infrastructure monetisation is real. Model and app spending still overwhelms it.
Bar lengths emphasize relative investor relevance and are not drawn to one common revenue scale.
RMB67.68bn capex equalled 17.8% of the three-year RMB380bn AI/cloud commitment in one quarter.
At $130.20, the $190.01 consensus target implied about 46% upside. Targets are opinions, not forecasts of certain returns.
Adjusted EBITA margin reached about 12%, up from roughly 7%. Sustained gains would validate the infrastructure build-out.
The RMB13.86bn quarterly loss widened 330%. A flatter cost curve is needed before AI profit reaches group earnings.
Capex rose 75%, while free cash flow stayed deeply negative. Watch procurement, proprietary-chip deployment and buybacks.
Sources: Alibaba June-quarter 2026 results, Reuters, August 20, 2026, and S&P Global analyst data displayed by StockAnalysis. Market data are after-hours and may differ from the next official session.
| FY26 copper output | 1.953Mt |
| FY27 midpoint | 1.725Mt |
| Midpoint change | -11.7% |
| FY35 ambition | Up to +40% |
Near-term Escondida grades temper the long-duration copper growth case.
| Analyst | View | Target | Return |
|---|---|---|---|
| Bernstein | Hold | A$44.02 | -33.0% |
| Morgan Stanley | Buy | A$67.00 | +1.9% |
| Citi | Hold | A$63.00 | -4.2% |
| Bank of America | Hold | A$65.00 | -1.1% |
| 17-analyst consensus | Hold | A$59.86 | -9.0% |
Sources: BHP fiscal 2026 results; Reuters; Financial Times; TradingView; S&P Global analyst data compiled by StockAnalysis. Market figures use the August 20, 2026 ASX close. Calculations may differ slightly due to rounding.
| Measure | Value |
|---|---|
| Implied net issuance | $96.48 |
| Thursday close | $112.39 |
| Dollar spread | +$15.91 |
Record Amtagvi sales and a 56% gross margin powered the rerating. The shares now sit near their 52-week high and almost level with the broader analyst target.
The retrenchment can repay quickly. Order conversion still drives the stock.
| Rating | Count | Share |
|---|---|---|
| Strong Buy | 4 | 36% |
| Buy | 4 | 36% |
| Hold | 3 | 27% |
| Sell / Strong Sell | 0 | 0% |
The CRTC decision controls the ownership reset. Cost cuts may slow cash burn, but they do not change the proposed 99% creditor stake. Conditions protecting jobs or local stations could also change the savings case.
| Q2 result | Reading |
|---|---|
| Revenue | $11.54B |
| GAAP operating income | $1.99B |
| GAAP net margin | 19.91% |
| Adjusted EPS | $1.66 |
Q3 guide About $13.0B, ±$300M. The midpoint implies roughly 12.7% sequential growth.
Helios Rack-scale deployments need to convert announced demand into revenue and margin.
Watch AI spending, export rules, supply, pricing and NVIDIA competition.
Sources: Reuters, Micron fiscal Q3 results, Google Finance. Lab annualization is an illustration, not guidance.
Supermicro cleared current senior management in its internal review. The stock briefly jumped 5.9%, then gave back almost all of the gain.
The governance update lifted the shares to $38.74. By 14:06 EDT, they were back near the prior close.
FY2026 showed the split between reported profit and cash conversion.
Price-to-forecast earnings, lower is cheaper.
Consensus: Hold · 19 ratings · average target $42.38.
| Firm | Rating | Target | Date |
|---|---|---|---|
| Rosenblatt | Buy | $51 | Aug 12 |
| J.P. Morgan | Hold | $45 | Aug 17 |
| Bernstein | Hold | $42 | Aug 13 |
| Goldman Sachs | Sell | $34 | Aug 12 |
The $200 bull-bear gap is larger than SPCX’s entire trading range since its June listing.
−0.44% · 34.23 points lower
Higher long yields tightened the equity hurdle while Walmart and megacap shares weighed on the benchmark.
| Signal | Level / move | Read-through |
|---|---|---|
| 30-year Treasury | 5.244% | Valuation pressure |
| Energy sector | +1.4% | Oil hedge |
| Consumer staples | −1.5% | Walmart drag |
| Brent crude | +1.8% | $93.23/bbl |
| Walmart | −9.2% | Earnings miss |
FactSet forecasts. The multiple has already compressed from roughly 23.1× last October, so profits—not re-rating—now carry the bull case.
Market snapshot: August 20, 2026, 13:02 EDT (19:02 CEST), while Nasdaq trading was open. Prices are U.S. dollars.
Amazon has the larger base and a 3.8-point margin lead. Alphabet has the faster growth rate.
| Signal | GOOGL | AMZN |
|---|---|---|
| Consensus | Strong Buy | Strong Buy |
| Rating split | 46 strong buy · 13 buy · 5 hold | 43 strong buy · 15 buy · 2 hold |
| Target range | $340–$515 | $230–$405 |
| Fresh action | Bernstein Hold, $385 | Rosenblatt Buy, $335 |
| Google Cloud | 82% revenue growth |
| Company revenue | 24% growth to $119.80B |
| Operating income | 30% growth to $40.77B |
| Valuation | Similar target upside to AMZN at a lower multiple |
Reported net income included a $77.1B after-tax equity gain. Forward earnings are the cleaner comparison.
Sources: Alphabet and Amazon SEC-filed June-quarter results; StockAnalysis quote, valuation, price-history and analyst pages; Rosenblatt coverage reported by The Fly via TipRanks. Calculations use unrounded figures where available. Market data observed August 20, 2026, 13:02 EDT (19:02 CEST).
The back-to-school campaign targets dinner visits and direct digital orders. The investor test is whether traffic moves above 1% without another margin step-down.
Near the session high. Still 19.8% below the 52-week peak.
In-store after 3 p.m.; school apparel required.
App or website after 3 p.m.; code SUNDAYS.
Food costs rose 80 bps; labor rose 30 bps.
Average target implies 25.0% upside. Ratings: 25 Buy/Strong Buy, 9 Hold.
New units drive reported growth. Promotions must prove they can also improve existing-store visits.
High redemption without incremental visits can trade revenue for traffic optics. Stronger digital baskets and repeat rewards use would improve the economics, but promotion uptake is not yet disclosed.
| View | Target | Upside from $103.97 |
|---|---|---|
| KeyBanc · Buy | $145 | +39.5% |
| Bernstein · Buy | $142 | +36.6% |
| UBS · Buy | $141 | +35.6% |
| Consensus · Buy | $137.98 | +32.7% |
| Oppenheimer · Hold | $111 | +6.8% |
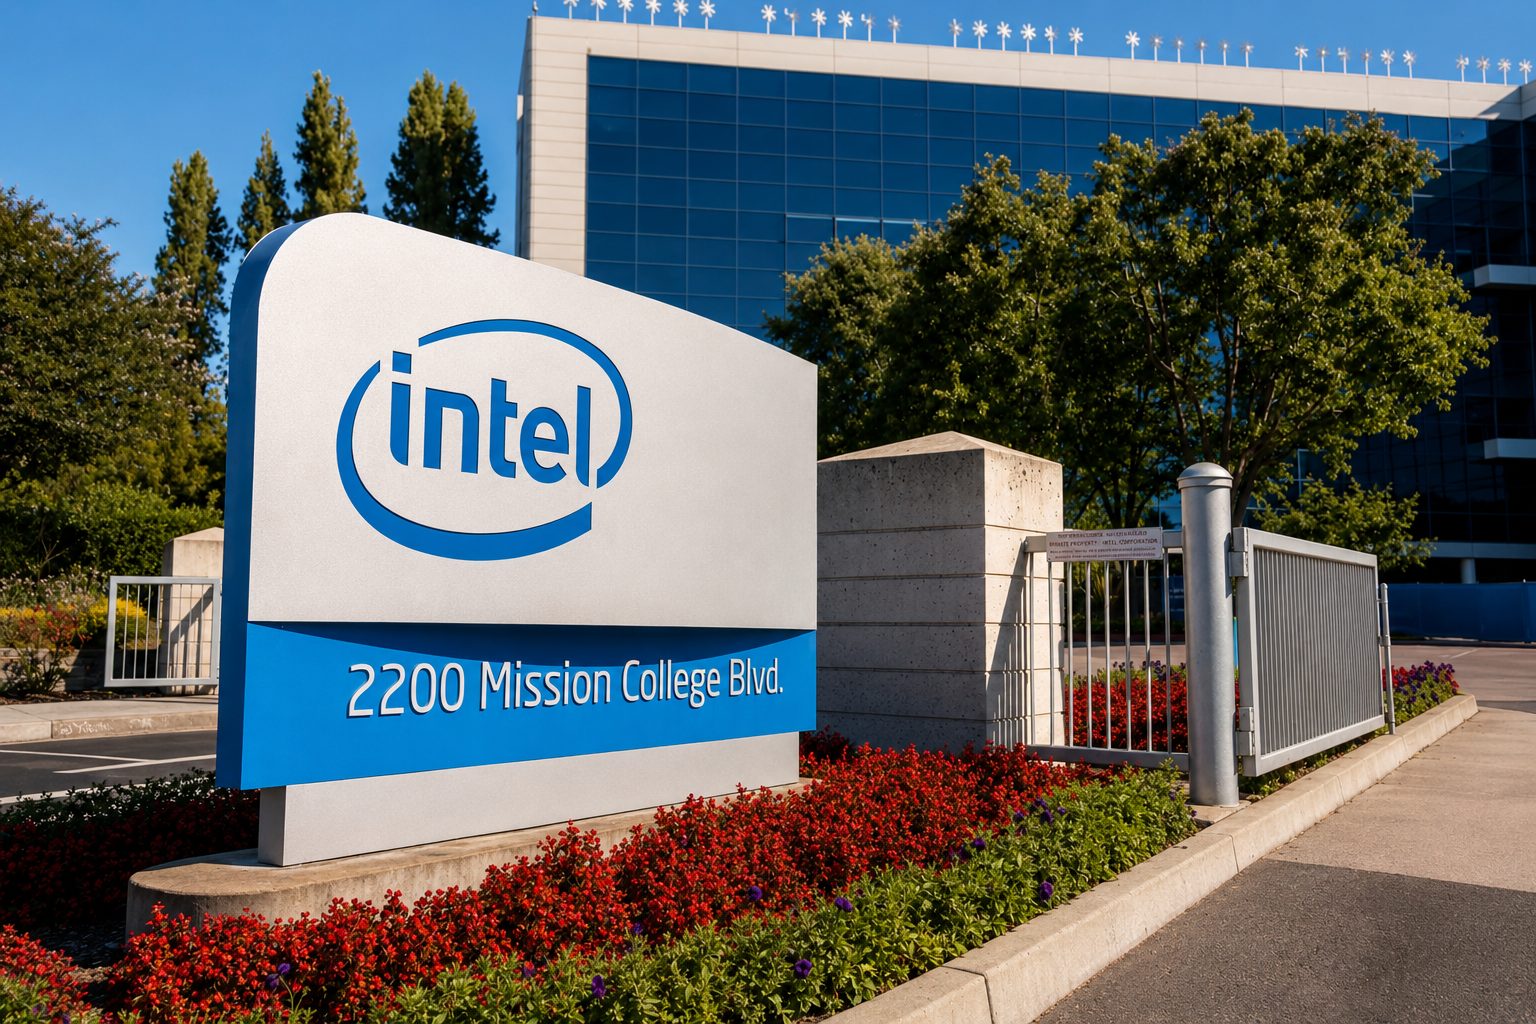
Intel’s equity raise nearly funds its full 2026 capital plan. The stock now trades below the offer price, turning execution into the next valuation test.
3.8% below the $95 offering price. The stock is 35.8% under its 52-week high.
Net proceeds cover an illustrative 98.5% of gross capex. Funds are not formally earmarked one-for-one.
Estimated share-count increase, depending on the underwriters’ option.
Foundry still lost about $2.1B operationally. Revenue includes internal sales.
Recommendation mix: 14 Buy/Strong Buy, 32 Hold, 2 Sell/Strong Sell.
A smoother process ramp and stronger AI demand could lift returns quickly. Delays, weak external foundry orders or further dilution would make the $20B capital plan more expensive.
Today’s highest-ranked model selections.
The catalysts most likely to move markets.
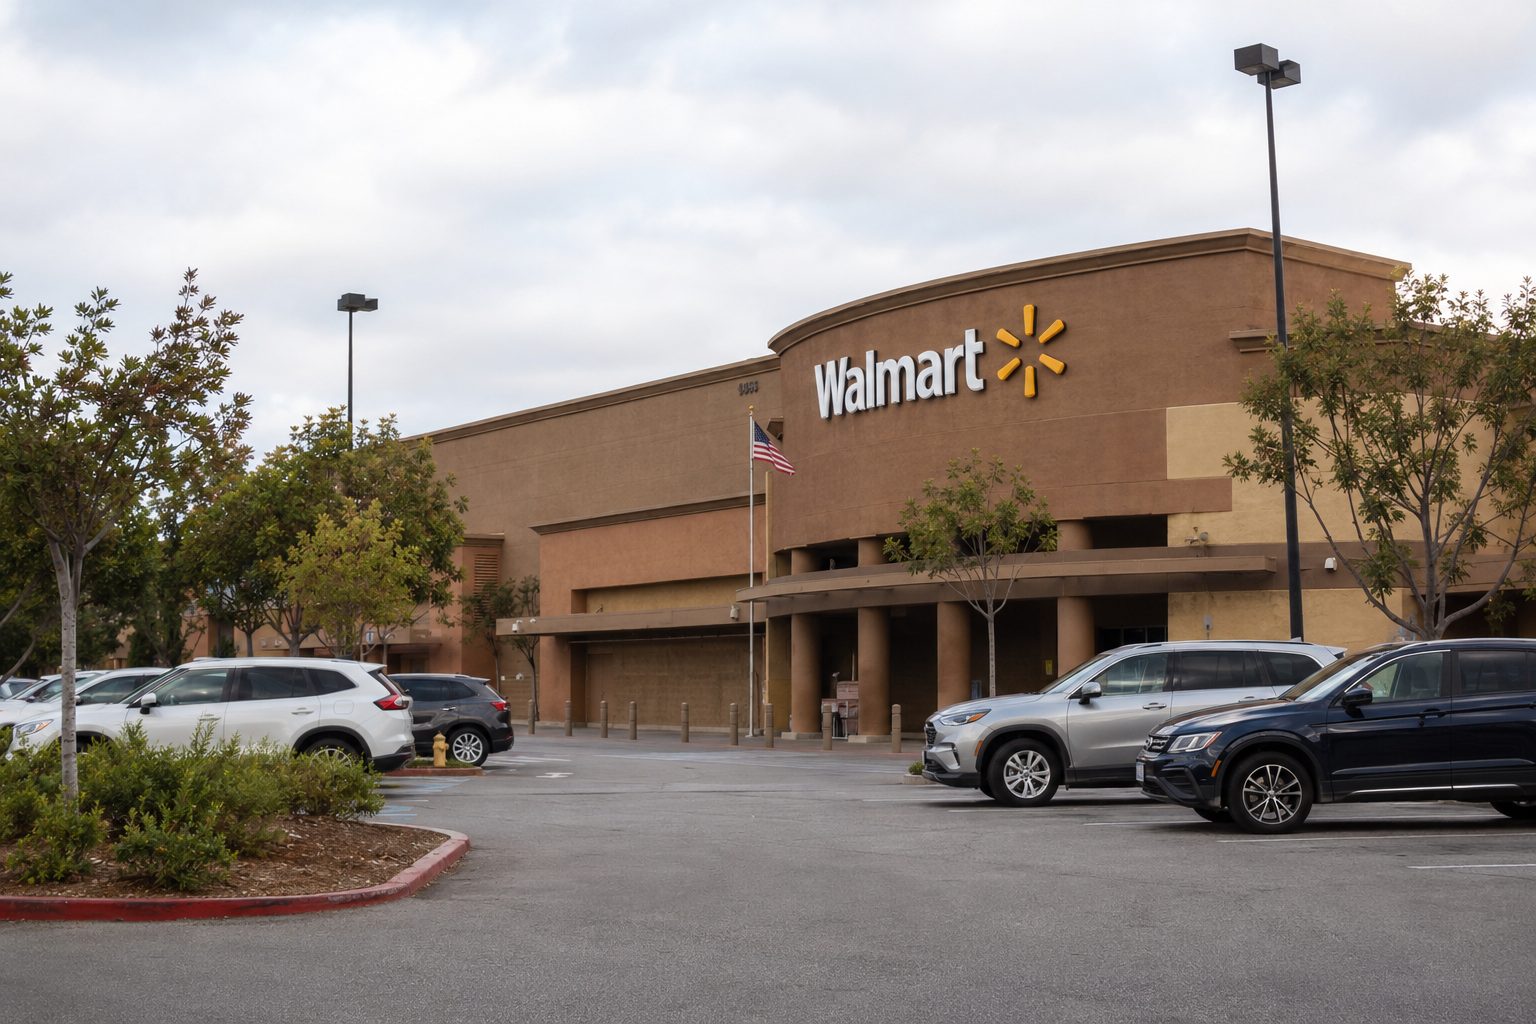
Walmart has the potential to influence outlooks on U.S. consumer strength, grocery inflation, discretionary spending, and retail profit margins.
Jobless claims and the Philadelphia Fed survey often influence Treasury yields, the US dollar, and equity index futures ahead of the market open.
Outlooks for large agriculture demand and construction equipment are key indicators for industrial cyclicals and the broader farm economy.