
NEW YORK, August 7, 2026, 13:19 (EDT) — U.S. trading underway.
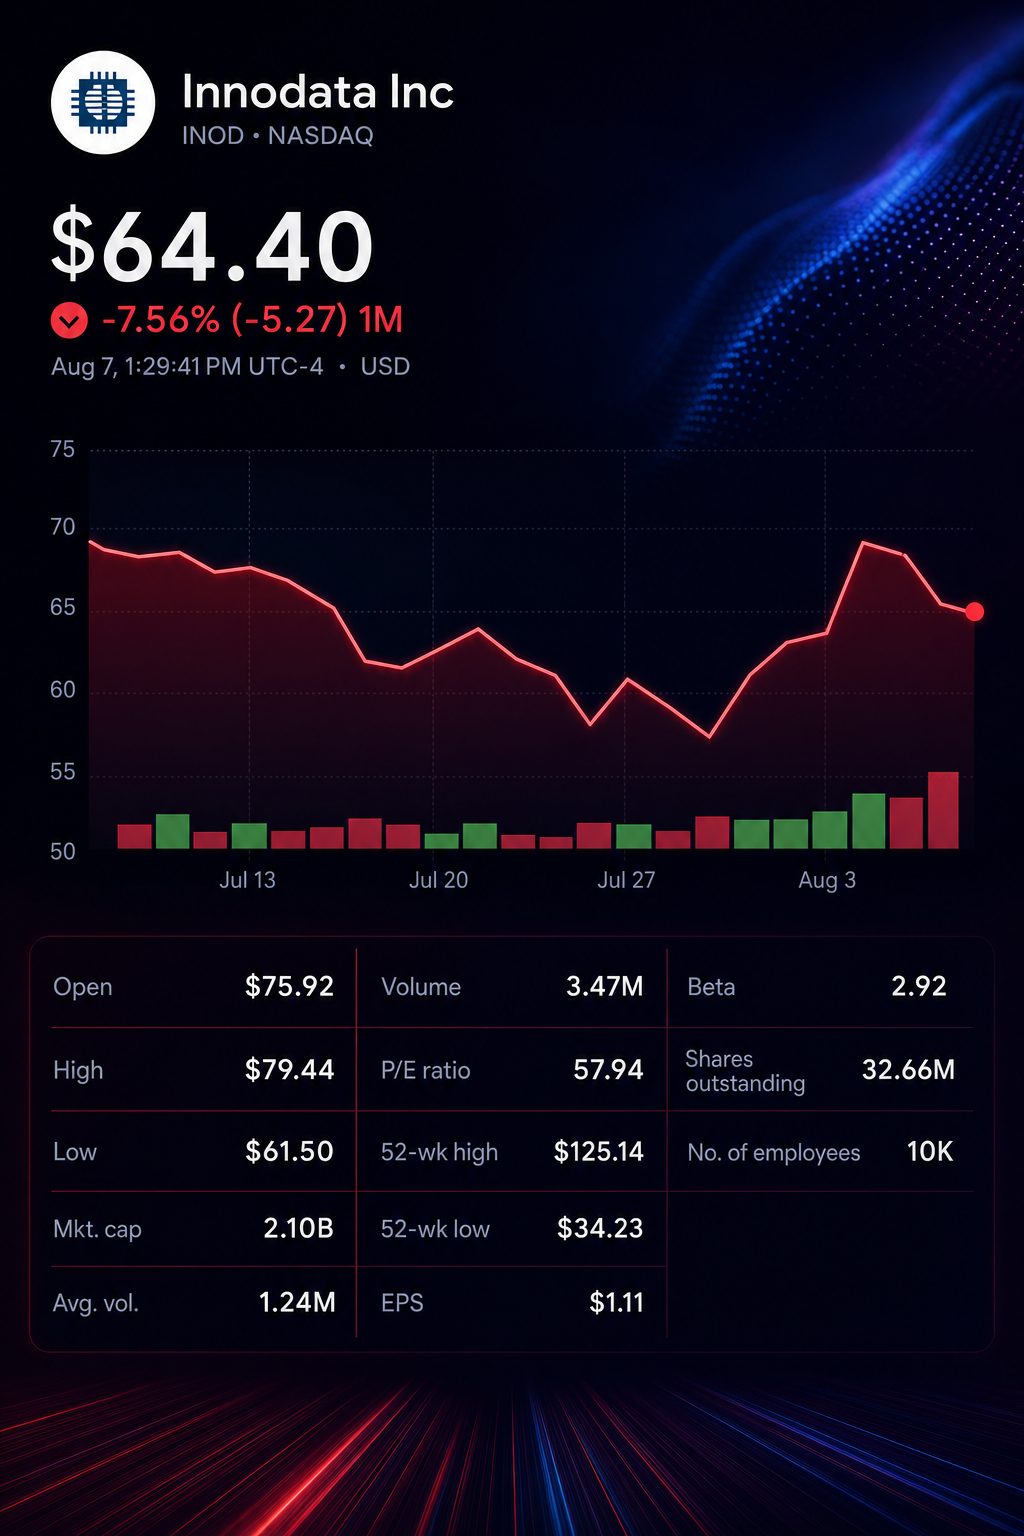
- The most recent quote stood at $64.35, a decline of 1.7%, after reaching an intraday peak of $78.05.
- Revenue for the second quarter climbed 58% to $92.1 million, with adjusted gross margin at 49%.
- Maintaining growth above 40% means average quarterly revenue in the second half must reach $85.0 million, which is 7.7% less than in Q2.
Innodata Inc. NASDAQ:INOD gave up a 19% surge seen earlier on Friday, pulling back despite posting record results for the second quarter. Shares ended the session below where they finished on Thursday.
The primary expectations test focuses on the steady revenue outlook. Management reaffirmed its full-year guidance for growth of at least 40%, maintaining the higher threshold set in May.
The guide may be achieved with an average quarterly run rate of $85.0 million during the second half, which is 7.7% lower than Q2. The current analyst consensus stands at $357.0 million, translating to $87.4 million per quarter and marking a 5.2% decrease from Q2.
| 2026 revenue scenario | Total year ($m) | Required H2 ($m) | H2 quarterly mean ($m) | Compared to Q2 |
|---|---|---|---|---|
| Company’s minimum 40% growth | 352.3 | 170.1 | 85.0 | -7.7% |
| Latest analyst average | 357.0 | 174.8 | 87.4 | -5.2% |
Figures are based on projected revenue of $251.663 million for 2025 and $182.238 million for the first half of 2026. Analyst numbers are projections.
Neither method forecasts a downturn. Both indicate a buffer above the stated minimum following robust results in the first half. Chief Executive Jack Abuhoff said that sequential decreases could occur when major projects result in interim lulls.
The latest quarter delivered robust results. Revenue climbed 58% and adjusted EBITDA surged 92%. The company stated both metrics surpassed its referenced consensus by 7% and 50%, respectively.
| Quarterly scorecard | Q2 2026 | Q1 2026 | Q2 2025 |
|---|---|---|---|
| Revenue ($m) | 92.1 | 90.1 | 58.4 |
| Adjusted gross margin | 49% | 47% | 43% |
| Adjusted EBITDA ($m) | 25.4 | 25.0 | 13.2 |
| Net income ($m) | 14.4 | 14.9 | 7.2 |
| Diluted EPS | $0.41 | $0.42 | $0.20 |
Adjusted gross margin and adjusted EBITDA represent non-GAAP metrics. All figures have been rounded.
Sequential growth slowed. Revenue rose by 2.3%, with adjusted EBITDA up 1.6%. Net income fell 3.3% compared to Q1.
Abuhoff described the second quarter as “another record quarter for Innodata.” He credited the 49% adjusted margin to reusable datasets and valuable pre-training initiatives. He noted that the quarterly margin is influenced by the mix of projects. Innodata Investor Relations
Customer turnover was swift, yet overall concentration remained elevated. The top account dropped to 37% of revenue from 56%. Meanwhile, the new Big Tech client’s portion rose to 34%, doubling its previous share.
| Customer breakdown | Q1 2026 | Q2 2026 |
|---|---|---|
| Overall revenue ($m) | 90.1 | 92.1 |
| Share from top customer | 56% | 37% |
| Top customer revenue, est. ($m) | 50.5 | 34.1 |
| Share from newly added Big Tech client | 17% | 34% |
| New Big Tech client revenue, est. ($m) | 15.3 | 31.3 |
| Combined share of largest two clients | 73% | 71% |
| Top two clients’ revenue, est. ($m) | 65.8 | 65.4 |
| Revenue from other clients, est. ($m) | 24.3 | 26.7 |
Customer-dollar amounts are estimated based on rough revenue proportions. Overall figures may not add up perfectly due to rounding.
Top-two revenue was estimated at $65.4 million, showing little change. Using a similar share calculation, revenue from other accounts increased roughly 10% to $26.7 million.
Trading on Friday highlighted investors’ split views. Shares started the session up 14.9%, climbed to a 19.2% rise, before dropping by as much as 5.9%.
| Friday trading tape | Price | Change from previous $65.48 close |
|---|---|---|
| Open | $75.21 | +14.9% |
| Intraday high | $78.05 | +19.2% |
| Intraday low | $61.61 | -5.9% |
| Latest available | $64.35 | -1.7% |
Quotes are based on the most recent data as of the dateline.
Analysts maintained their positive outlook. On Friday, both Craig-Hallum and Maxim reaffirmed their Buy ratings, with price targets set at $120 and $111 respectively.
| Analyst | Firm | Recommendation | Target | Latest action |
|---|---|---|---|---|
| George Sutton | Craig-Hallum | Buy | $120 | Reiterated Aug. 7 |
| Allen Klee | Maxim Group | Buy | $111 | Reiterated Aug. 7 |
| Hamed Khorsand | BWS Financial | Buy | $140 | Increased June 15 |
| Daniel Ives | Wedbush | Outperform | $120 | Increased June 4 |
| Four-analyst consensus | — | Strong Buy | $122.75 average | Now |
Projections represent analyst expectations and not official company forecasts.
The consensus is strong yet limited. Among the four analysts, none issue a Hold or Sell rating. Craig-Hallum, Maxim, and Wedbush are listed as sales agents for Innodata’s latest equity initiative.
An upcoming change in leadership introduces an additional factor. Rahul Singhal will assume the roles of president and chief executive on September 30, while Abuhoff is set to transition to executive chairman.
The company reported cash and short-term investments of $250.4 million. Management said cash was about $134 million after accounting for customer prepayments. Innodata launched a $300 million at-the-market (ATM) equity program on August 6.
Risks: Around 71% of revenue still comes from just two customers. Delays in project schedules may lead to quarter-over-quarter sales drops, and work with slimmer margins could impact the existing margin. Trading at $64.35, a full ATM drawdown would amount to about 4.7 million shares, or 13.6% of shares currently outstanding, before taking fees and price movements into account.
The upcoming test will not only be if Innodata meets the lower end of its guidance. It also hinges on whether sales in the second half stay close to Q2 levels and maintain the stronger margin mix.