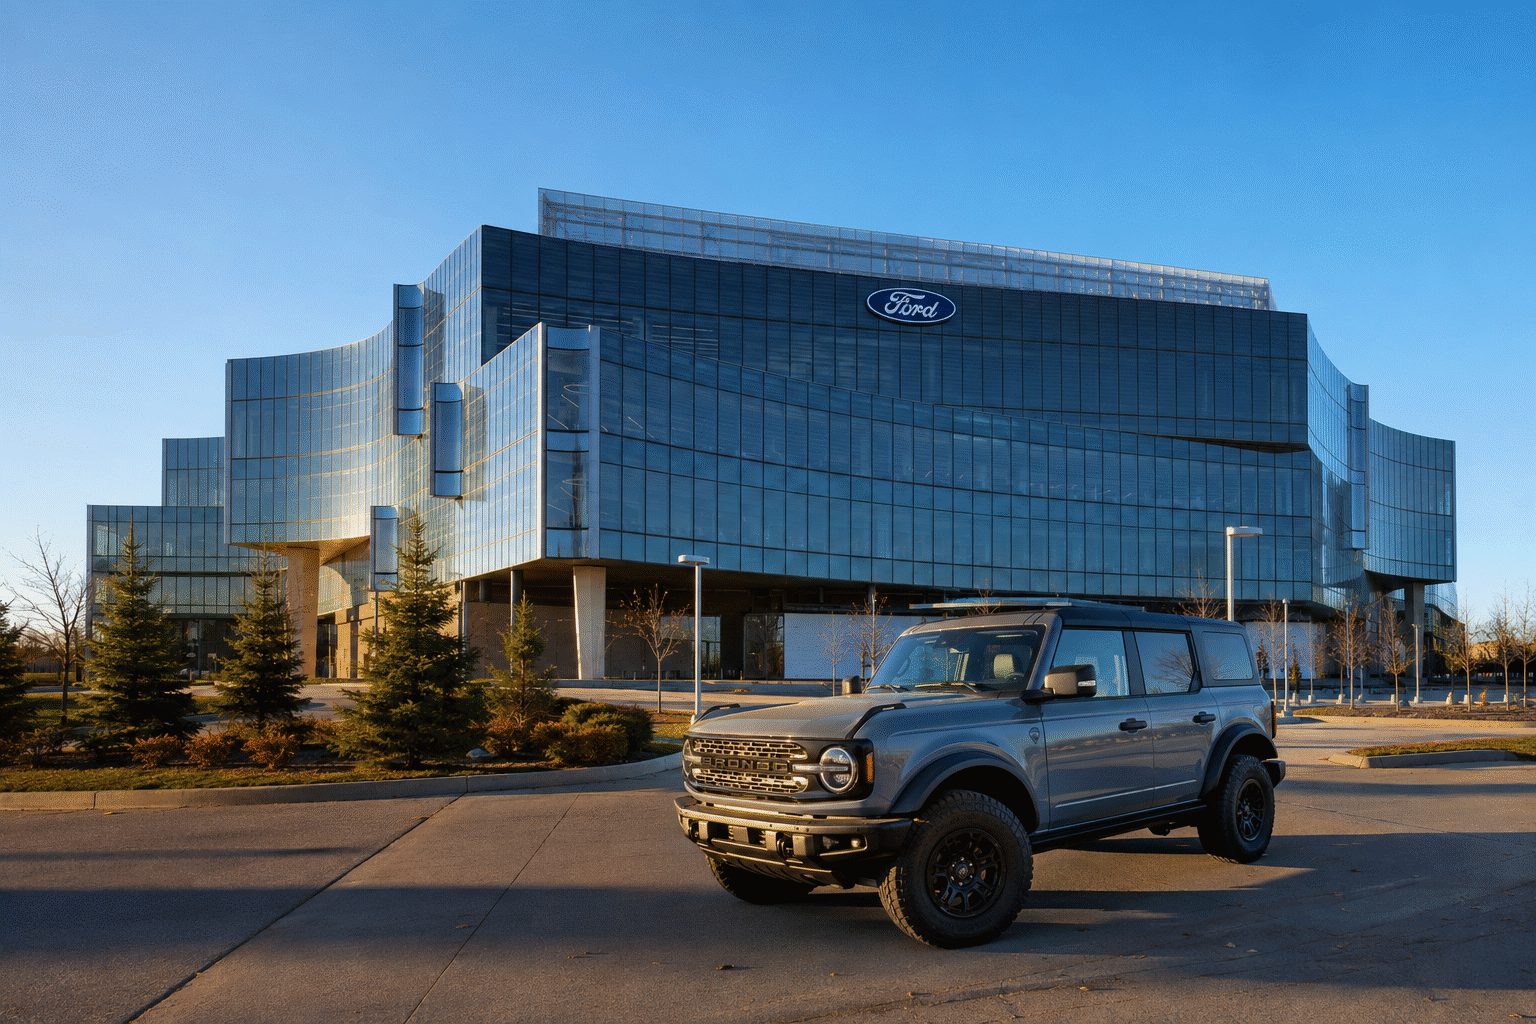
Ford Motor Company ended Wednesday's session up 4.1% after a new report suggested the Bronco lineup could expand to include both a hybrid model and a pickup. The potential pickup version is not expected before 2030, and Ford has yet to confirm these plans.
Bronco and Bronco Sport already represent one in every 6.4 Ford-brand U.S. vehicles. A wider family can improve mix only if it adds buyers rather than shifting them from Ranger or other Ford SUVs.
Recall letters are due to start Aug. 24 for 565,691 Broncos and Bronco Raptors. The reported wiring defect can short-circuit and raise fire risk. Ford will install sheathing free.
Market data: August 19, 2026 close, 16:00 EDT
Prepared after the U.S. session
Highest close in about three years
Phase 3 melanoma readout
One session, Financial Times estimate
Close × 399.24M shares
Investor read: the market priced a platform, not just a melanoma product. The $44 billion value gain equals about 14.7× Barclays’ $3 billion estimate for 2035 melanoma sales.
INTerpath-001 enrolled 1,137 patients with resected stage IIB-IV melanoma. No new safety signal was reported.
| Firm | View | Target |
|---|---|---|
| Piper Sandler | Overweight | $77 |
| Goldman Sachs | Neutral | $67 |
| Citigroup | Neutral | $60 |
| RBC Capital | Sector Perform | $45 |
| Wolfe Research | Underperform | $25 |
The $174.38 close is 126% above the old high target and 243% above the $50.84 consensus. These targets have not absorbed the trial result.
Bars share a $44 billion scale. The sales figure is an analyst estimate for melanoma in 2035, not company guidance.
| Next U.S. session | August 20, 09:30 EDT |
| Analyst model resets | Watch targets and probability assumptions |
| Medical presentation | Date not yet disclosed |
| Regulatory path | Companies are already in discussions |
| Possible availability | 2027, subject to approval |
KRX:005380 · Tucson 2027
The day's trading ranged from ₩408,000 to ₩421,000.
The 52-week range was ₩212,000 to ₩783,000.
Tucson reported 137,326 units sold through July
Hyundai's total units reached 533,048
Consensus from 31 analysts is Buy
Target range ₩463,129 to ₩900,000
The revamped model safeguards growth that outpaces the brand overall. Tucson deliveries in July surged at a rate five times higher than Hyundai’s overall U.S. sales.
The 2027 Tucson is required to maintain volume levels without resorting to substantial incentives. This will be the margin benchmark.
The consensus target suggests a potential upside of 61.2%, while the number of Strong Buy recommendations dropped from 17 in March to 15 in August.
Weak demand for the design, delays in manufacturing, rising costs or larger U.S. subsidies may erode the Tucson’s lead in volume. The unveiling provides a clearer boost to revenue than to profit margins.
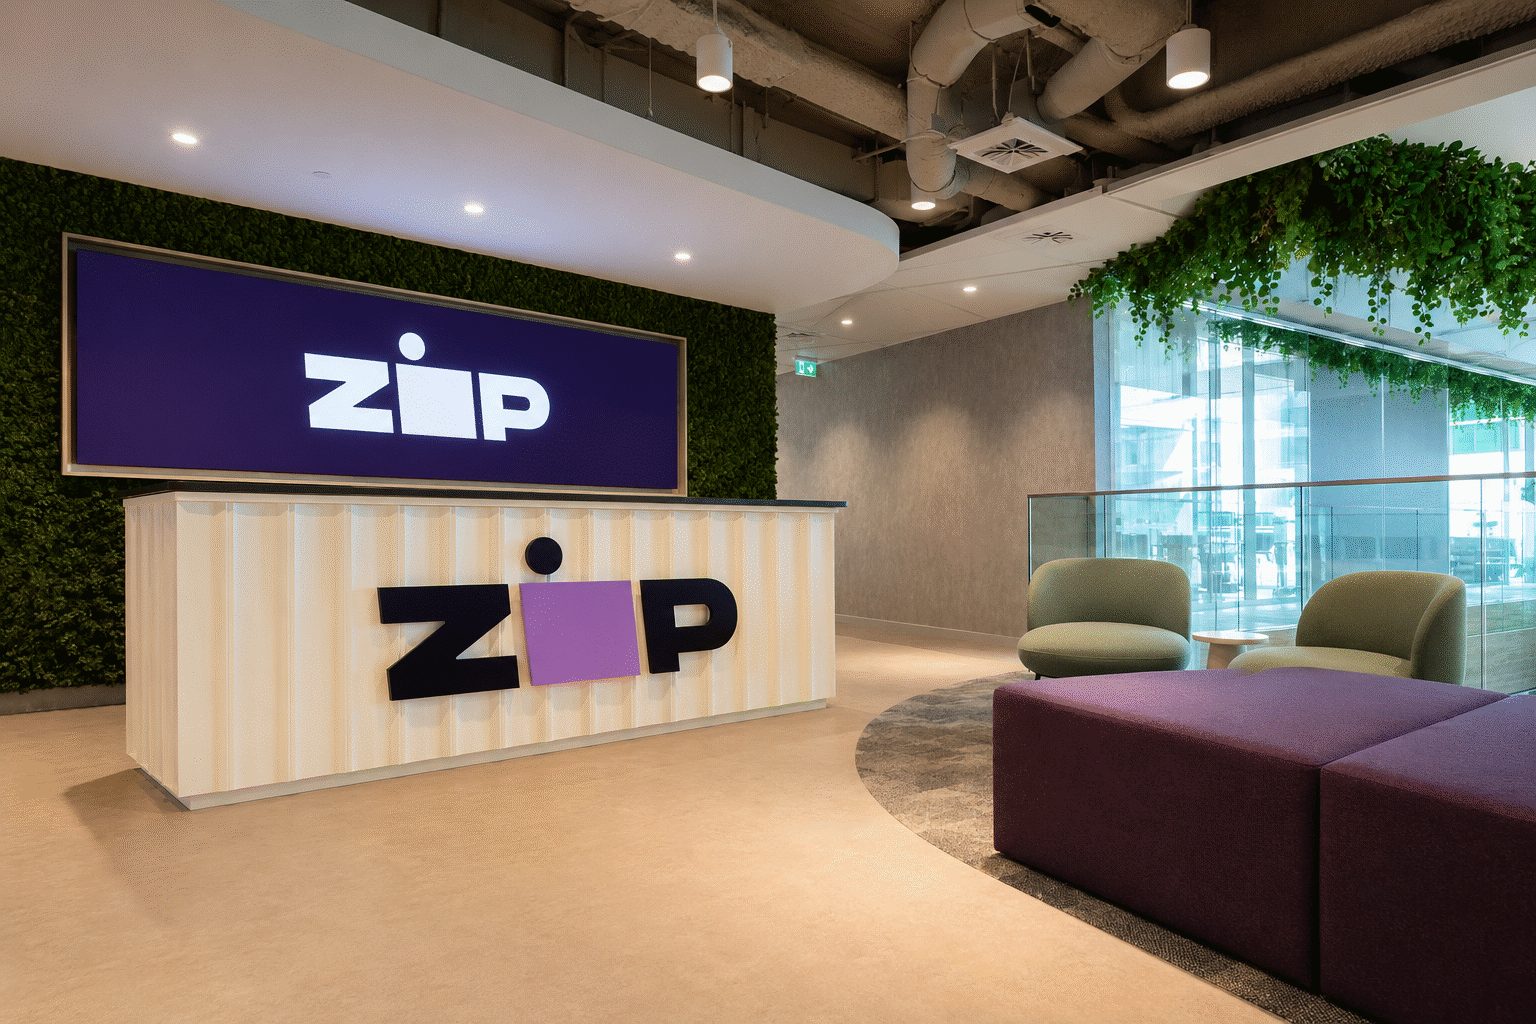
ASX:ZIP · FY26 outcome
The day's range is A$2.87 to A$3.01.
The 52-week range stands between A$1.375 and A$4.93.
Operating margin rose to 20.0%, an increase of 420 basis points.
Among twelve analysts, eight rate it as Strong Buy and four as Buy, with none recommending Hold or Sell.
Investors welcomed the record base. The upcoming challenge will be maintaining margins close to 20% as US volume and cash earnings growth slow.
Consensus targets received their latest update on July 20, ahead of the FY26 release. The next key indicator will be any post-result revisions.
Plans for margin growth could be offset if the US economy slows more than expected, if consumer credit weakens, or if funding costs rise. Results for the first quarter of FY27 are due on 23 October 2026.
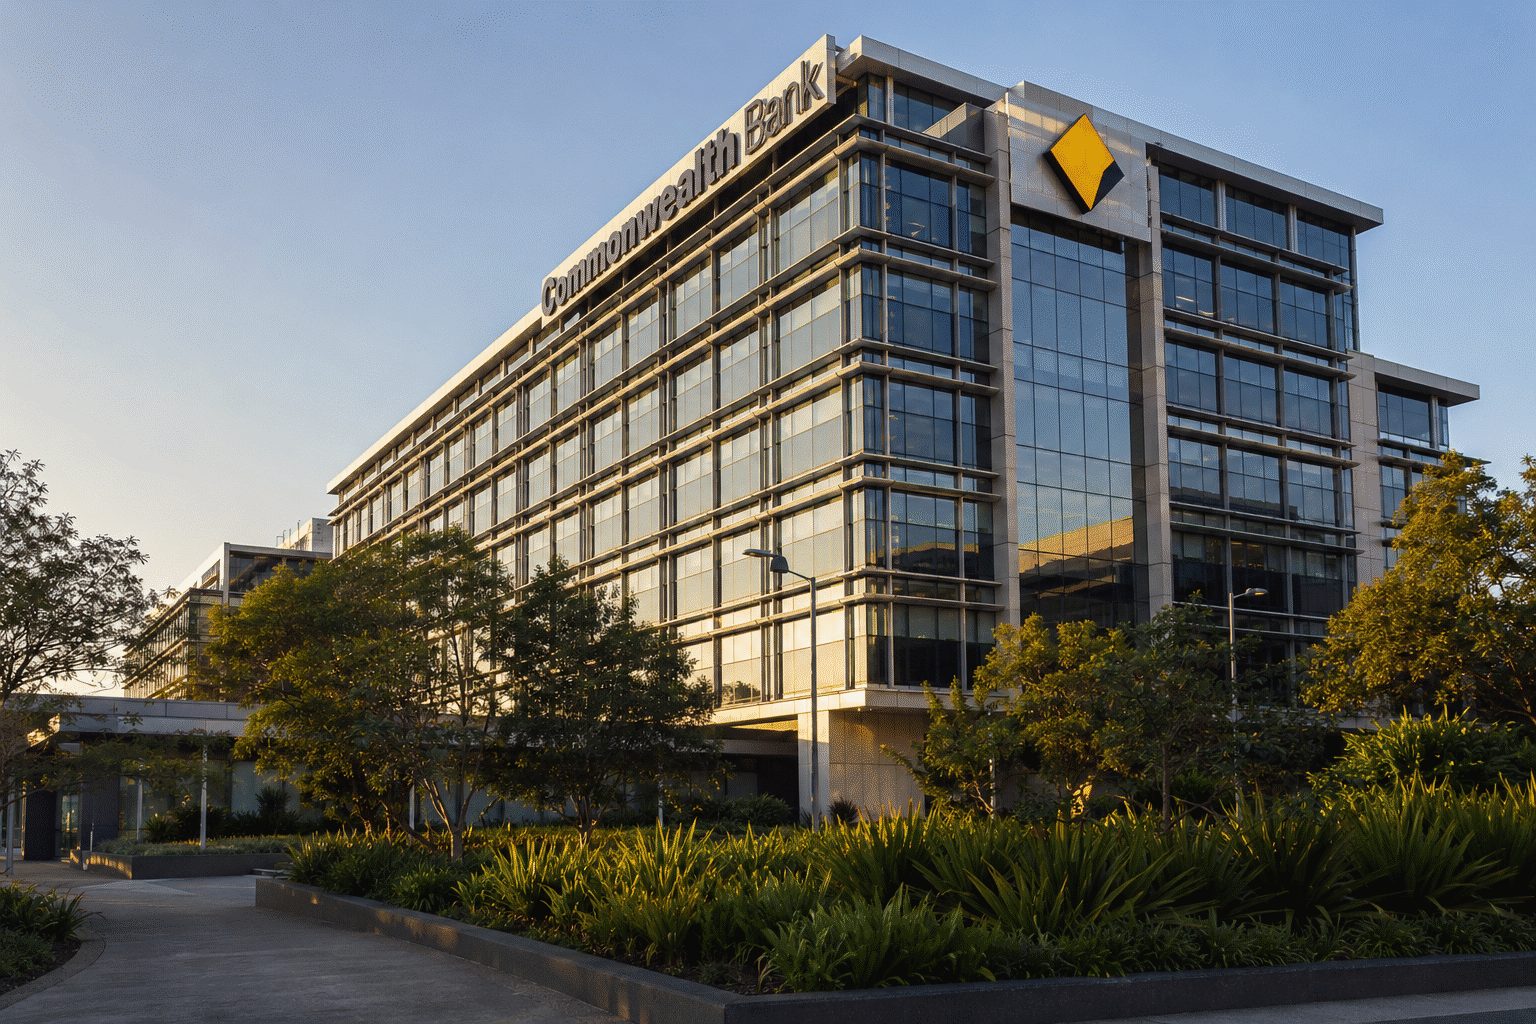
CBA's earnings remain solid. The share price still carries a large premium, and analysts see another 22% downside to their average target.
Trailing earnings multiple compared with Australia's other major banks.
Year ended June 30, 2026.
| Measure | Result | YoY |
|---|---|---|
| Cash profit | A$10.98bn | +7% |
| Pre-provision profit | A$16.47bn | +6% |
| Net interest margin | 2.05% | +3bp |
| Operating expense | A$13.76bn | +6% |
| Impairment expense | A$788m | +9% |
| Return on equity | 14.0% | +50bp |
STRONG SELL • 14 analysts • Aug. 13 update
Stable mortgage applications, contained arrears and a steady 2.05% margin would support CBA's quality argument.
Higher credit losses, weaker margins or FY27 investment above A$2.4 billion would make a peer-like multiple harder to avoid.
CET1 is 12.0%, above the 10.25% regulatory minimum. The full-year dividend rose 4% to A$5.05 a share.
| Metric | Q2 2026 | YoY |
|---|---|---|
| Revenue | $333.9m | +52.5% |
| Adjusted EBITDA | $199.2m | +115.2% |
| Operating cash flow | $174.9m | +61.4% |
| Free cash flow | $135.8m | +106.6% |
| Silver production | 4.21m oz | -6.8% |
| Silver move | Gross annual value at 15.6m oz | Share of market value |
|---|---|---|
| +$1/oz | +$15.6m | 0.11% |
| +$5/oz | +$78.0m | 0.57% |
| +$10/oz | +$156.0m | 1.13% |
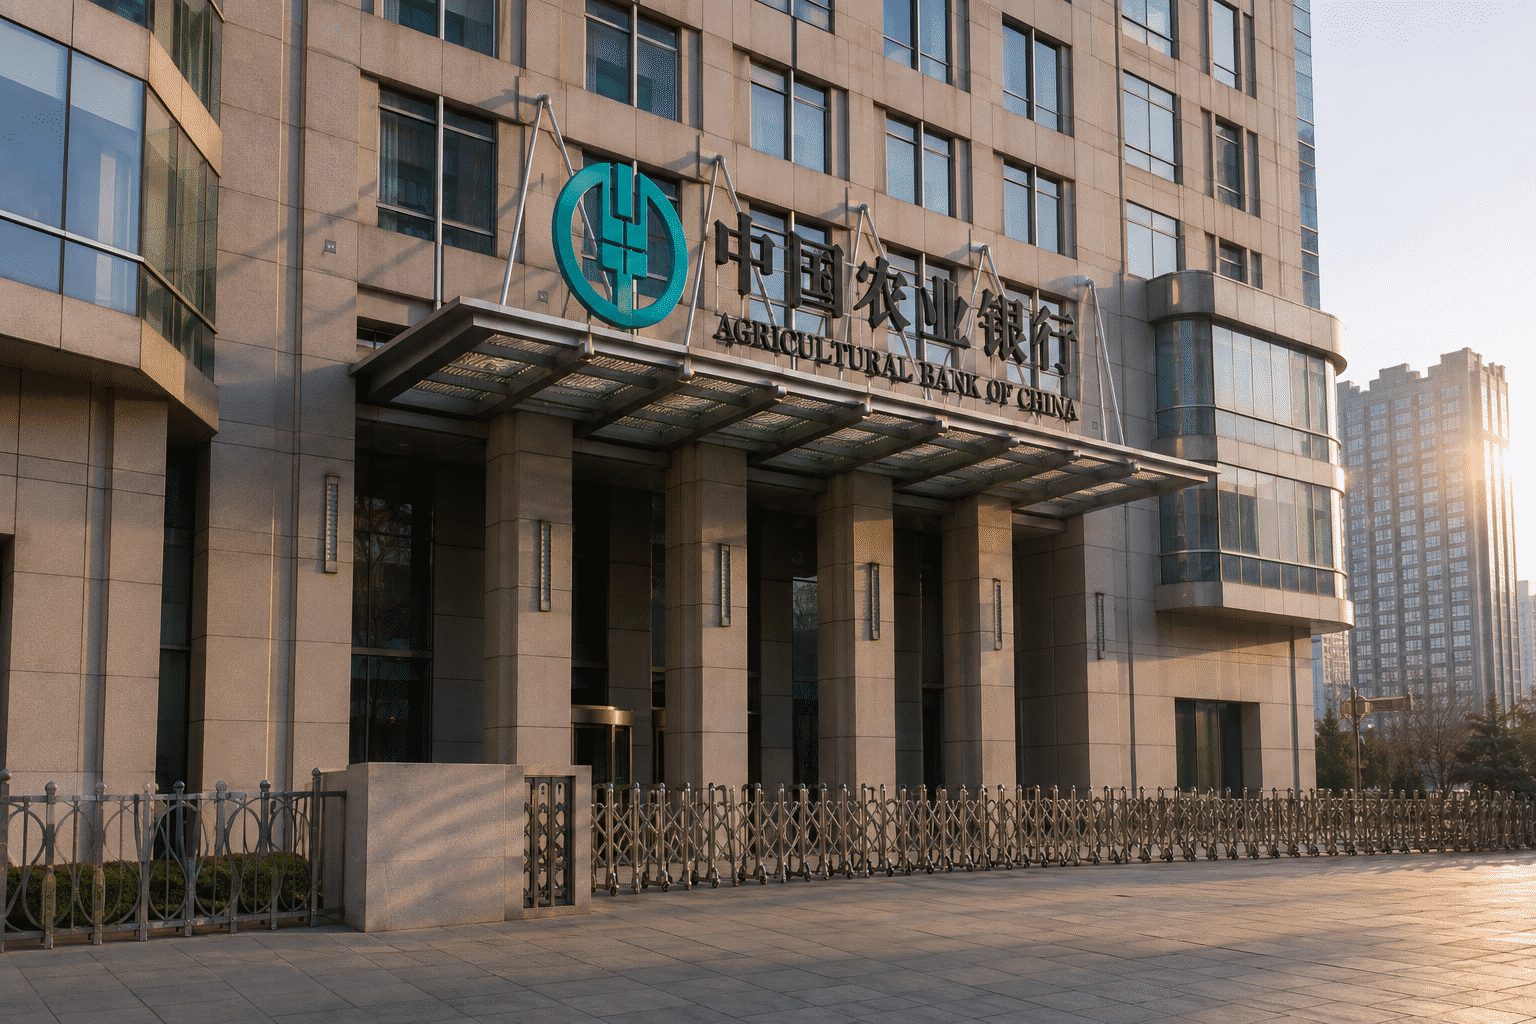
AgBank led the big-four state banks in both Wednesday’s A-share gain and first-quarter profit growth. The catch is a 1.26% net interest margin.
Source: TradingView/FactSet, August 19 close.
| Metric | Result | Change |
|---|---|---|
| Operating income | CNY206.35B | +10.50% |
| Attributable profit | CNY75.19B | +4.52% |
| Total assets | CNY51.03T | +4.60% |
| Net interest margin | 1.26% | −2 bp |
17 analysts; targets last updated July 2, 2026.
Sources: TradingView, Agricultural Bank of China, Reuters, and StockAnalysis/S&P Global. Market values and ratios are time-sensitive. Analyst targets apply to HKG:1288; the displayed share price applies to SHA:601288.
Median upside: 22.8% · Consensus: Buy · 29 analysts
Fiscal 2027 consensus calls for 33.3% revenue growth and 44.9% adjusted EPS growth.
The market is pricing a cleaner FY27 before brokers have caught up.
Behring supplies roughly 72% of group revenue. Vifor revenue is guided about 25% lower in FY27.
Sources: TradingView, CSL FY26 results summary, S&P Global analyst poll and CSL investor calendar. Financial figures are in US dollars unless marked A$. Market data as of 19 Aug 2026, 16:10 AEST.
The next share unlock is large enough to change trading. Revenue growth is fast enough to keep buyers interested. The tape decides which force wins.
Closing prices in U.S. dollars. The stock remains above the IPO price but has slipped 4.5% since Monday.
Eligible does not mean sold. It does show the size of the overhang.
Revenue and adjusted EBITDA accelerated. Capital spending still ran at 2.4 times revenue.
| Measure | Q2 2026 | Change |
|---|---|---|
| Revenue | $7.81B | +92% |
| Adjusted EBITDA | $3.50B | +191% |
| Net loss | $541M | Improved $467M |
| Capital spending | $18.4B | 2.4× revenue |
| AI revenue | $2.56B | +247.5% |
| Connectivity revenue | $4.29B | +65.8% |
Latest published calls through August 18. Upside is measured from $139.65.
| Firm | Call | Target | Gap |
|---|---|---|---|
| Morgan Stanley | Buy | $300 | +114.8% |
| Deutsche Bank | Buy | $235 | +68.3% |
| Clear Street | Buy | $217 | +55.4% |
| UBS | Buy | $210 | +50.4% |
| Phillip Securities | Sell | $75 | -46.3% |
| Measure | Result | Change |
|---|---|---|
| Reported pre-tax profit | $19.5bn | +23% |
| Adjusted pre-tax profit | $20.4bn | +6% CER |
| Reported revenue | $37.7bn | +11% |
| Banking NII | $22.9bn | +$1.6bn |
| Annualised RoTE | 18.2% | Above 17% target |
| Gauge | Latest | Reference |
|---|---|---|
| CET1 ratio | 14.1% | 14.0%-14.5% range |
| Distance from floor | 0.1 point | Thin |
| Second interim dividend | $0.10/share | Approved |
| Payout target | 50% | 2026-2028 |
| 2026 NII outlook | At least $46bn | Raised |
| Credit-cost outlook | ~45 bp | Above 30-40 bp normal |
| View | Target | Vs. close |
|---|---|---|
| 17-analyst average | 1,485.6p | −0.8% |
| Goldman Sachs · Buy | 1,860p | +24.2% |
| BofA · Buy | 1,720p | +14.9% |
| Morgan Stanley · Hold | 1,674p | +11.8% |
| UBS · Hold | 1,620p | +8.2% |
| JPMorgan · Hold | 1,450p | −3.2% |
| Measure | Value | CER | CHF |
|---|---|---|---|
| Group sales | 30.36bn | +6% | −2% |
| Pharma sales | 23.63bn | +6% | −1% |
| Diagnostics | 6.74bn | +3% | −3% |
| Core operating profit | 11.86bn | +10% | −1% |
| Core EPS | CHF10.85 | +9% | −2% |
| Company | P/E | EPS growth | Yield |
|---|---|---|---|
| Roche | 24.30× | +30.49% | 2.94% |
| Novartis | 24.18× | −11.50% | 2.95% |
| AstraZeneca | 24.18× | +21.16% | 2.08% |
| Novo Nordisk | 11.43× | +5.13% | 3.95% |
| View | Target | Rating |
|---|---|---|
| 18-analyst average | CHF363.92 | Buy |
| Bernstein | CHF434.50 | Outperform |
| Morgan Stanley | CHF410.00 | Overweight |
| UBS | CHF376.00 | Buy |
| Goldman Sachs | CHF365.00 | Neutral |
Arm's premium amplifies sensitivity to growth misses and higher bond yields.
Total revenue
Maestro Flow lets developers build, run and govern processes from Claude Code, Cursor, GitHub Copilot and Codex. The pitch is clear: ship the prototype without a rebuild. Revenue evidence comes next.
American lost less than its three large U.S. peers, even as volume accelerated.
The upside case is simple: jet fuel stays lower while fares hold. American's unhedged exposure then turns a modest price move into a large pre-tax benefit. The weak point is just as clear. A fare war, fuel reversal or operating disruption can consume that benefit before it reaches earnings.
| Driver | Reading | Effect |
|---|---|---|
| 1Y loan prime rate | 3.00% expected | Stable |
| 5Y loan prime rate | 3.50% expected | Stable |
| 2026 deposits maturing | CNY54tn | Cheaper rollover |
| Estimated funding-cost drop | ~135 bp | NIM support |
| Estimated sector NIM lift | ~12 bp | Buffer |
| Bank | Move | Yield | Market cap |
|---|---|---|---|
| ICBC | +1.69% | 4.05% | $387.08bn |
| Agricultural Bank | +2.58% | 3.78% | $336.26bn |
| China Construction Bank | +1.15% | 3.73% | $307.30bn |
| Bank of China | +0.83% | 3.75% | $264.00bn |
| View | Target | Signal |
|---|---|---|
| 16-analyst average | HKD8.36 | Buy |
| Citi | HKD8.97 | Buy |
| JPMorgan | HKD8.40 | Buy |
| HSBC | HKD7.90 | Buy |
| Goldman Sachs | HKD6.96 | Hold |
| View | Target | vs. close |
|---|---|---|
| Morgan Stanley · Equal Weight | $465 | -0.3% |
| D.A. Davidson · Buy | $550 | +17.9% |
| Consensus · Strong Buy | $608 | +30.4% |
| Rosenblatt · Buy | $700 | +50.1% |
The full published range spans $365 to $1,250 across 51 analysts.
Price data: August 19, 2026 close
Captured 23:20 CEST / 17:20 EDT
$937.11
-0.39% Wednesday
-7.4%
From Monday’s $1,011.75
$1.06tn
TradingView estimate
$1,507.79
+60.9% implied
The stock gave back Monday’s policy-led gain in one session.
Micron trades at 3.2× SK hynix’s trailing P/E.
| Firm | Rating | Target | Implied return |
|---|---|---|---|
| KeyBanc | Buy | $1,750 | +86.7% |
| UBS | Buy | $1,625 | +73.4% |
| Citi | Buy | $1,150 | +22.7% |
| ThinkEquity | Buy | $900 | -4.0% |
| Survey average | Strong Buy | $1,507.79 | +60.9% |
| Scenario | Share price | Implied value* | Change |
|---|---|---|---|
| Survey high | $2,200 | $2.49tn | +$1.43tn |
| Survey average | $1,507.79 | $1.71tn | +$646bn |
| Current | $937.11 | $1.06tn | — |
| Survey low | $361 | $408bn | -$652bn |
*Preliminary proportional estimates using current price and market capitalization.
Memory pricing: DRAM and NAND contract checks
Rates: U.S. two-, five- and seven-year auctions, Aug. 25–27
AI spend: customer capex and HBM allocation updates
Micron has no earnings report scheduled for the coming week.
TradingView for closing price, market value and peer multiples; Associated Press for Tuesday’s selloff; Barron’s for memory pricing and prior-week close; Investing.com for analyst consensus. Targets are not guarantees.
The stock leg was worth $29.12 at Santander’s Wednesday close.
Market data: August 19, 2026, 14:15 UTC / 10:15 EDT
Debt data: August 18, 2026
$40.047tn
First close above $40tn
$32.266tn
80.6% of gross debt
5.204%
+33 bps vs six-sale average
5.196%
-8.9 bps on the day
CBO baseline projection for debt held by the public.
| Metric | Result | Signal |
|---|---|---|
| Bid / cover | 2.53x | Firm |
| Foreign take | 62.9% | Above avg. |
| Yield tail | 0.4 bp | Small |
| Coupon-cost gap* | $52.8m/yr | Higher |
*Estimated annual gap on $16bn versus a 4.874% six-auction average; not a federal cash-budget forecast.
| Tenor | Yield | Daily move | Investor read |
|---|---|---|---|
| 2-year | 4.181% | +0.6 bp | Fed path stays restrictive |
| 10-year | 4.655% | -5.1 bps | Buyback signal trims term pressure |
| 30-year | 5.196% | -8.9 bps | Largest relief at long end |
| 10-year breakeven | 2.304% | Near 2.3% | Inflation expectations held steady |
| View | Positioning implication | Bias |
|---|---|---|
| BCA Research | Relief in long yields likely temporary | Cautious |
| Simplify | Favor long bonds and long TIPS | Constructive |
| TCW | Expect long yields to stay elevated | Cautious |
| Impax | Buyback scale is too small for lasting relief | Measured |
Aug. 25: $69bn two-year note sale
Aug. 26: $70bn five-year note sale
Aug. 27: $44bn seven-year note sale
Watch bid-to-cover ratios, indirect-bidder shares and auction tails.
Debt figures: Reuters / U.S. Treasury. Auction: Barron’s. Yields: Reuters. Fiscal outlook: CBO. Strategy views: Reuters, MarketWatch, WSJ. Market views are not investment advice.