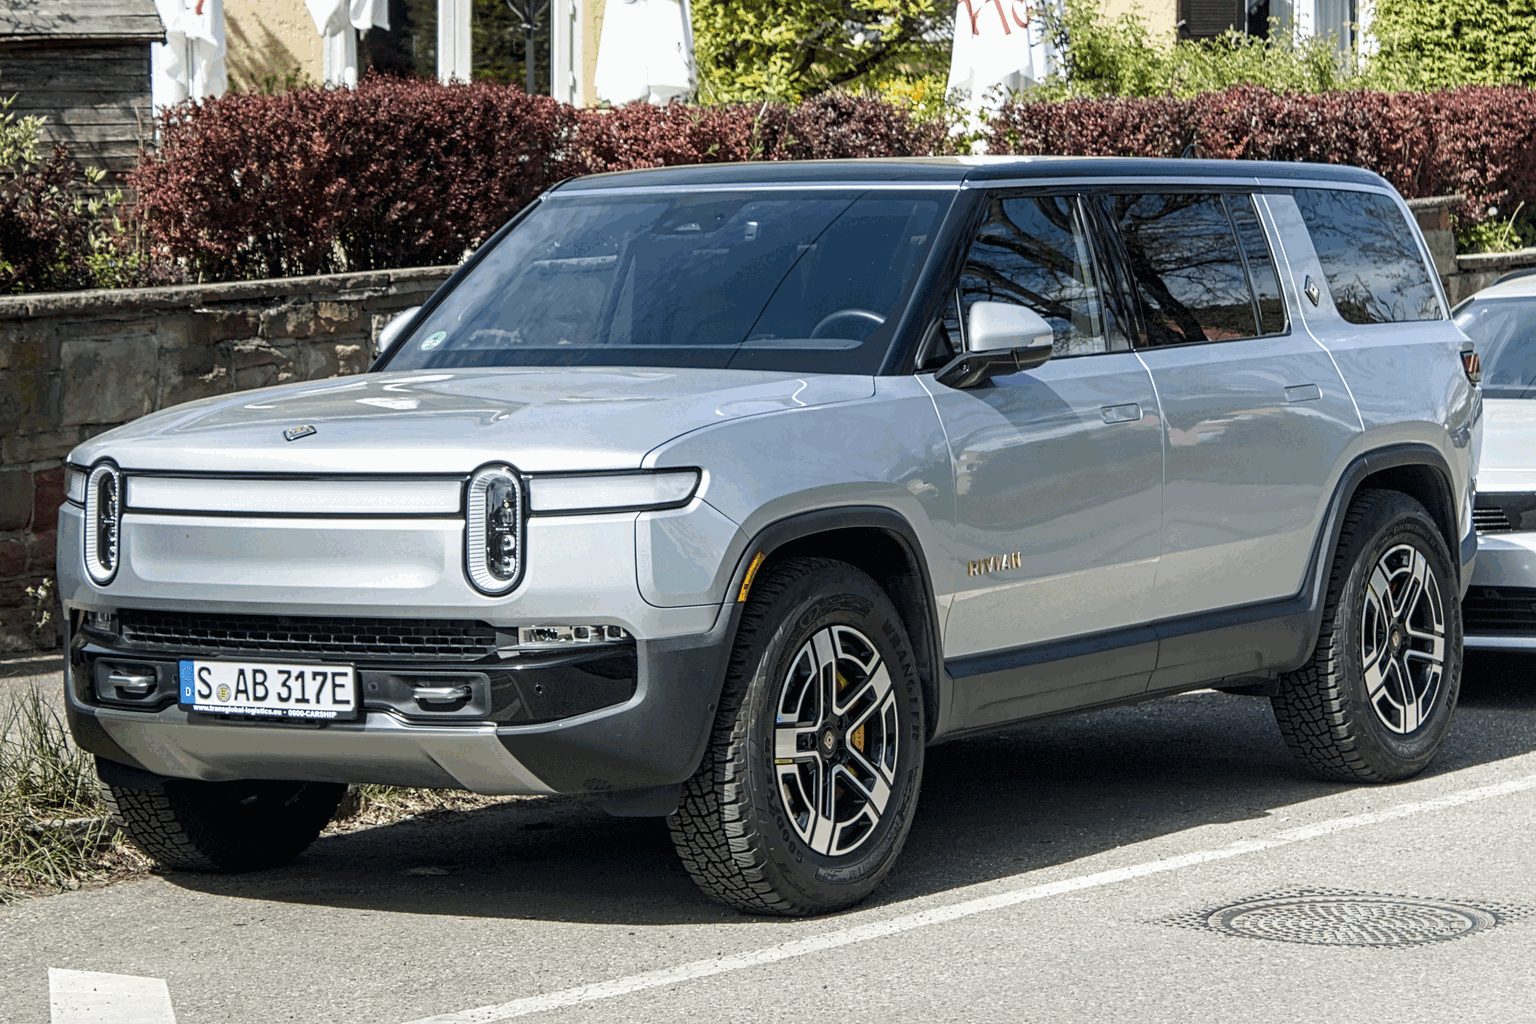
Rivian Shares Slip 4.4% After $1.19 Billion Cash Burn Leaves Stock Near Post-Offering Level
Rivian Automotive declined 4.35% on Friday to close at $16.07. Ahead of the market open, shares were at $15.96 as of 09:00 EDT, shedding another 0.68%.
NIO Inc. closed 3.2% lower at $4.23 on Monday, equalling the electric vehicle maker's 52-week low ahead of its quarterly earnings due on Tuesday. The stock started the session at $4.33 and failed to rebound.
NYSE closing price, U.S. dollars. As of .
Sources: Stock Analysis historical closes; Google Finance for August 31.
Vehicles delivered in the quarter ended June 30, 2026.
Source: NIO, July 1, 2026.
Reported vehicle margin; Q2 2026 is the next test.
Sources: NIO Q1 2026 results; NIO 2025 results.
The consolidated $179 million profit still depends on software and services.
| Measure | Q2 2025 | Q2 2026 | Change |
|---|---|---|---|
| Production | 5,979 | 12,613 | +111% |
| Deliveries | 10,661 | 12,194 | +14% |
| Automotive revenue | $927M | $1.143B | +23% |
| Software revenue | $376M | $515M | +37% |
| Net loss | −$1.115B | −$837M | Improved $278M |
| Measure | Value | Context |
|---|---|---|
| June 30 liquidity | $5.846B | −$742M from December |
| H1 capital spending | $734M | Normal plant and platforms |
| July equity raise | ≈$1.3B | 86.25M shares at $15.50 |
| April VW funding | $1.0B | ≈63M shares at $15.90 |
| R2 ramp cost | ≈$100M | Incremental Q2 cost |
| Market value | $23.27B |
| 52-week range | $12.39–$22.69 |
| Average analyst target | $19.23 |
| Target range | $13–$25 |
| Implied upside to average | 20.5% |
High short interest and above-average volume can magnify R2 news.
Watch first: automotive gross profit per vehicle as R2 volume rises.
Cash test: inventory and deferred-revenue swings must normalize.
Valuation test: $15.50 is the fresh financing anchor.
Risk: launch quality, warranty costs, demand and tariffs can delay margin gains.
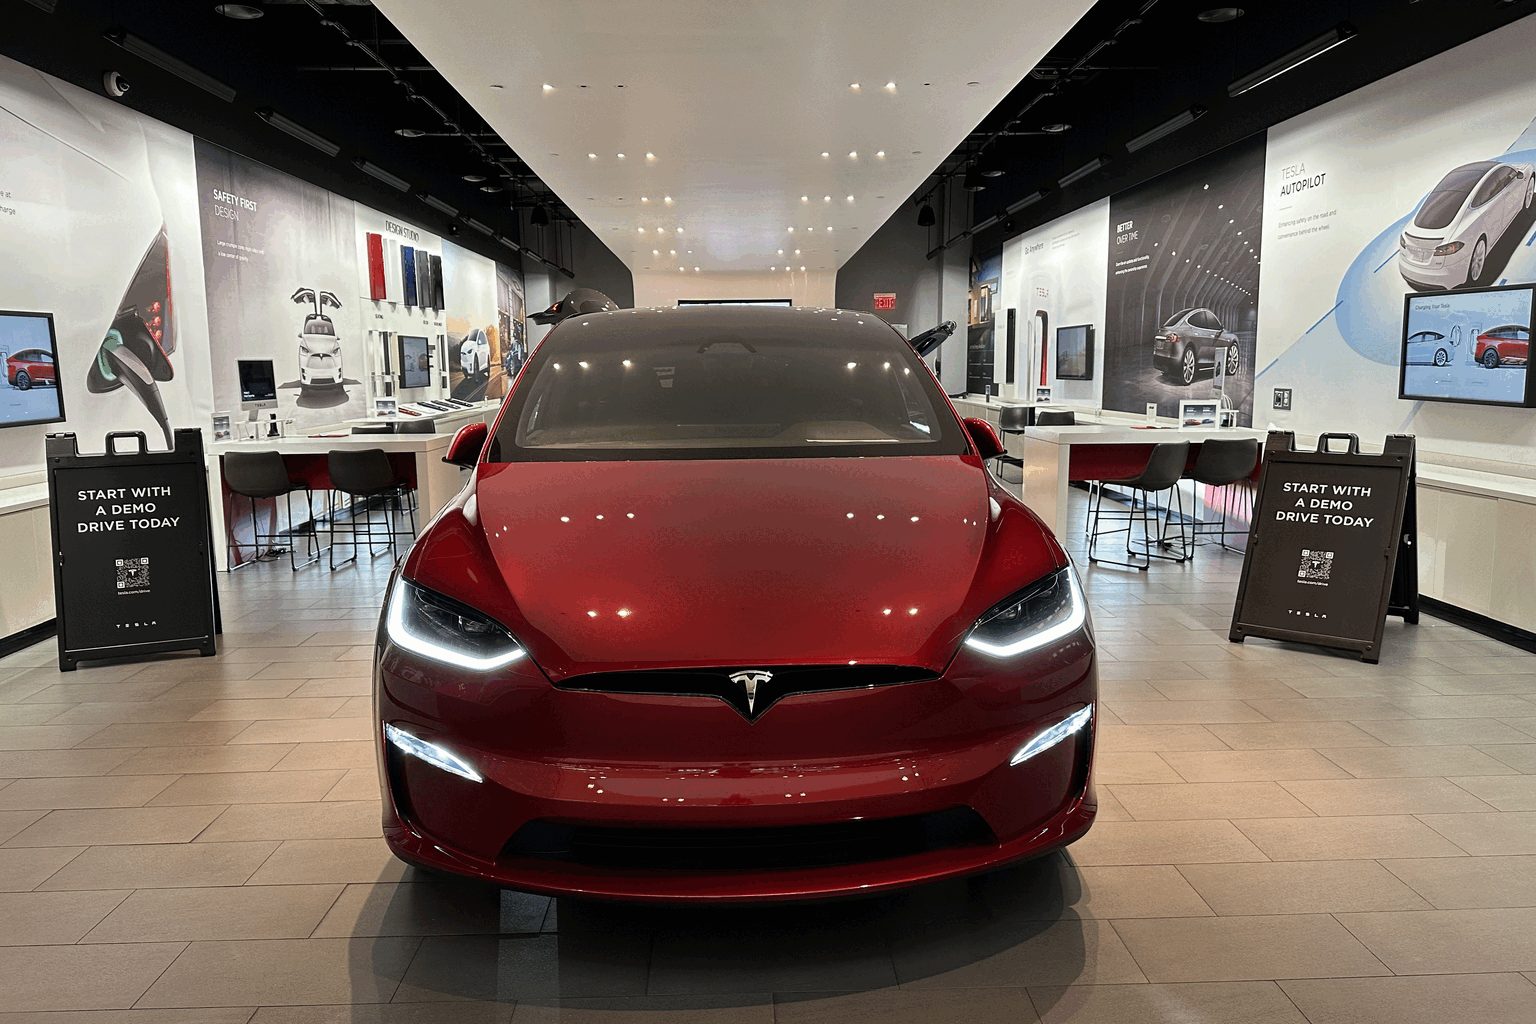
Price premium meets margin pressure
Q2 ended June 30, 2026; Tesla shareholder update.
| View | Count / target | Signal |
|---|---|---|
| Buy | 11 analysts | Supportive |
| Hold | 14 analysts | Largest group |
| Sell | 3 analysts | Cautious |
| Average target | $385.05 | +10.4% |
| Target range | $130–$505 | Wide dispersion |
Google Finance snapshot, Aug. 28, 2026.
| Cybertruck base trim | $74,990 |
|---|---|
| Premium AWD trim | $84,990 |
| Recent increase | +$5,000 each |
| H1 U.S. Cybertruck sales | 7,263 est. |
| Year-on-year change | -32.2% |
Prices reported Aug. 26; sales estimate from Cox Automotive.
Tesla lost about $19 billion of market value on Friday. Its balance sheet funds autonomy, robotics and energy expansion, but a 323.95× earnings multiple leaves little room for delays while operating margin sits at 1.4%.
The cheap multiple depends on containing EV losses.
| Measure | Latest | Signal |
|---|---|---|
| Q2 revenue | $48.3B | −3.8% YoY |
| Adjusted EBIT | $2.5B | ~+20% YoY |
| Adjusted EPS | $0.42 | 20% beat |
| EV/software EBIT | −$919M | 37% of total EBIT |
| 2026 EBIT guide | $10B–$11B | Raised |
Ford raised 2026 adjusted EBIT guidance after a 20% earnings beat. Friday’s subdued trading shows investors are still discounting the durability of that profit.
The key burden: a roughly $4 billion annual EV loss equals 36%–40% of guided company EBIT.
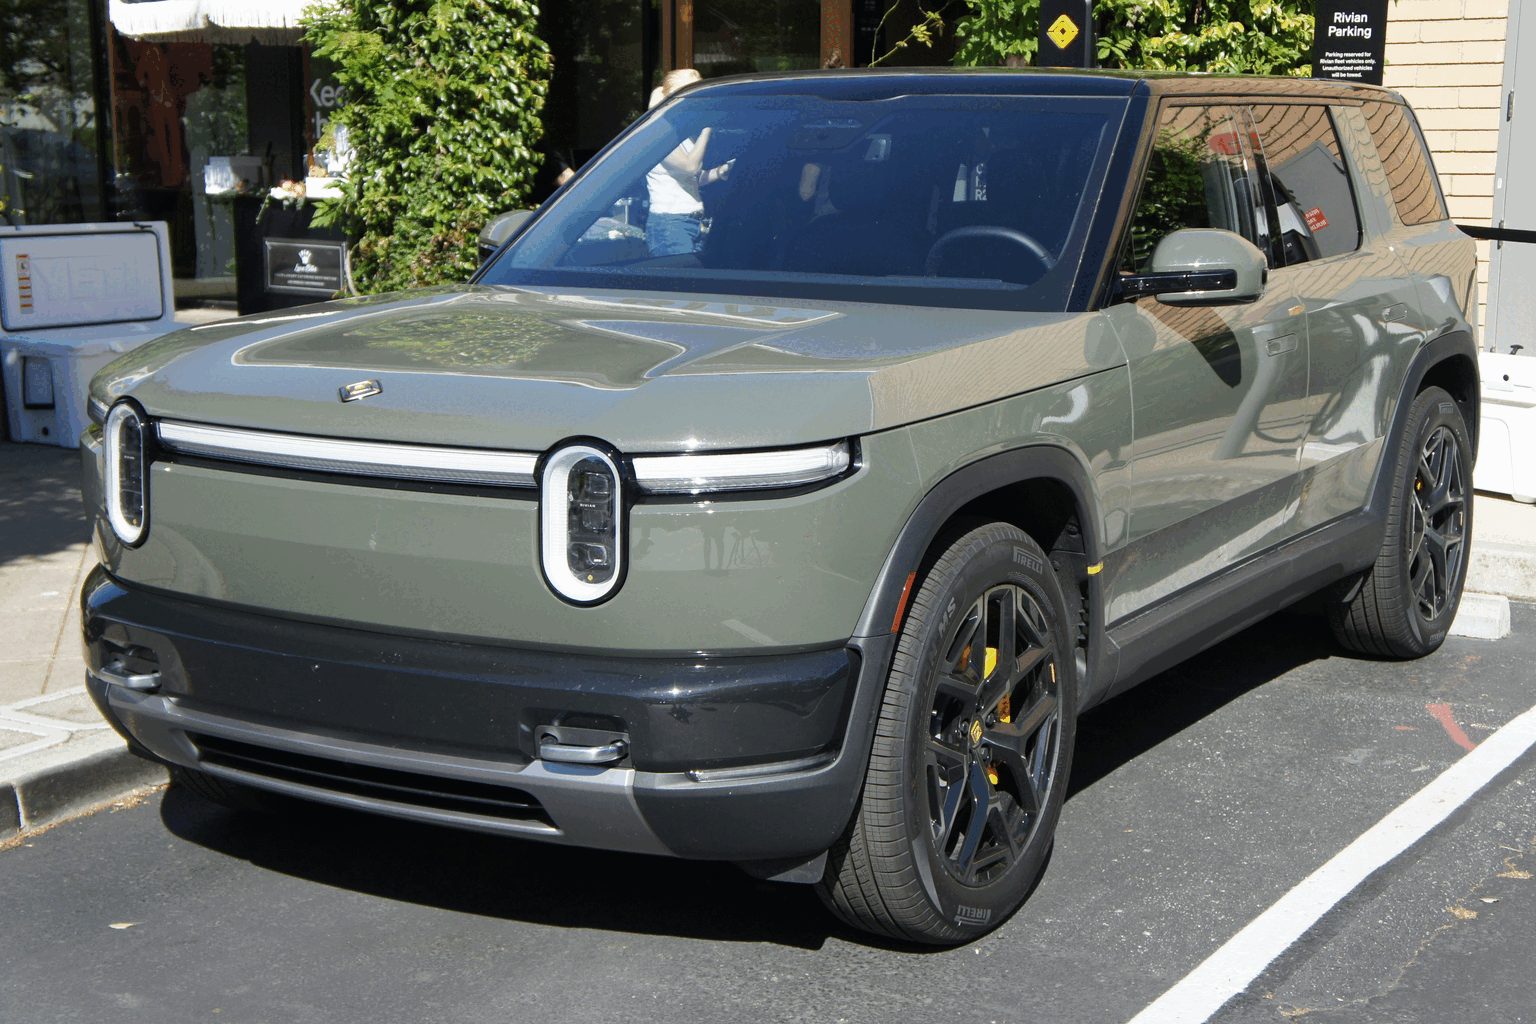
| Metric | Q2 '26 | Q2 '25 |
|---|---|---|
| Revenue | $1.66B | $1.30B |
| Gross profit | $179M | -$206M |
| Automotive gross profit | -$36M | -$335M |
| Adjusted EBITDA | -$379M | -$667M |
| Deliveries | 12,194 | 10,661 |
Quarter ended June 30, 2026; results released July 30.
$215M gross profit on $515M revenue.
Automotive gross margin-3%-$36M gross profit on $1.14B revenue.
| Annualized Q2 revenue | $6.63B |
| Price / run-rate sales | ≈3.5× |
| Cash + short-term investments | $5.31B |
| Cash / market value | ≈23% |
| IBES analyst consensus | Hold |
Market ratios use Aug. 28 close; analyst consensus dated Aug. 19, 2026.
Claire McDonough remains CFO through October. Rivian's successor must finance the R2 ramp while automotive gross margin turns positive.
2026 delivery guide: 65,000–70,000.
Signal to watch: Automotive gross profit per vehicle, not software profit alone.
R2 delays, supplier costs, weaker demand and financing needs could slow margin recovery. High short interest and a 1.94 beta can magnify price swings.
Sources: Rivian Q2 2026 results; Reuters, Aug. 27; MarketWatch, Aug. 28; Reuters/IBES, Aug. 19.
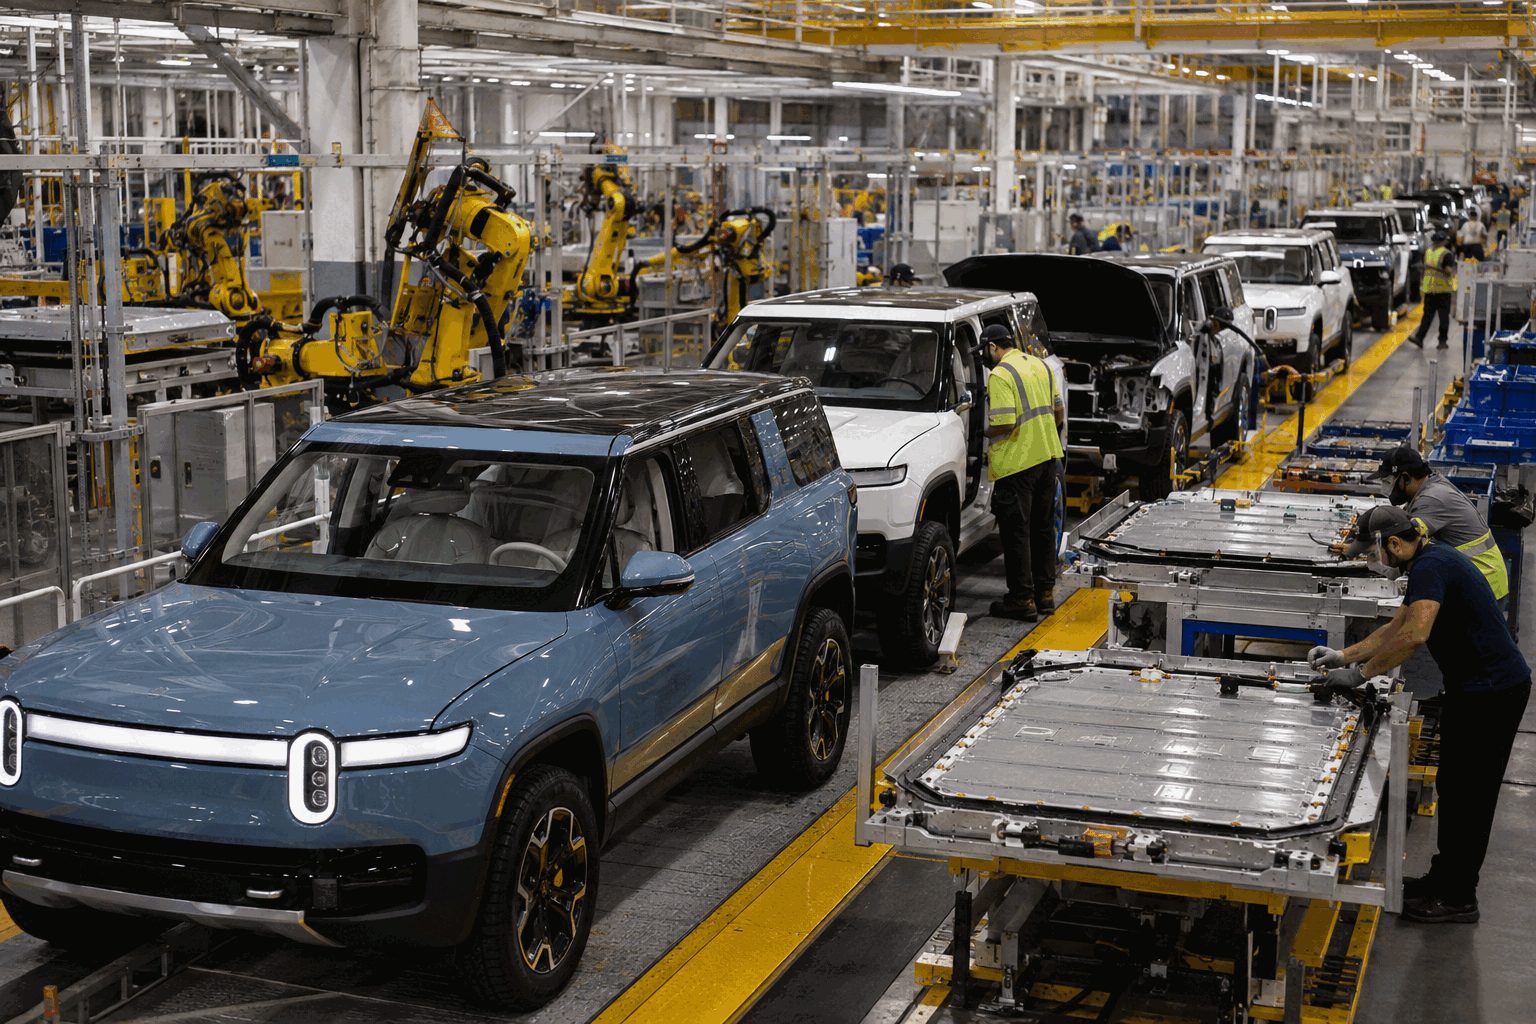
| Measure | Reading |
|---|---|
| Q2 vehicles produced | 12,613 |
| Q2 vehicles delivered | 12,194 |
| 2026 delivery guidance | 65,000–70,000 |
| Guidance midpoint | 67,500 |
| Software/services revenue | $515M, +37% |
| Software/services gross margin | 42% |
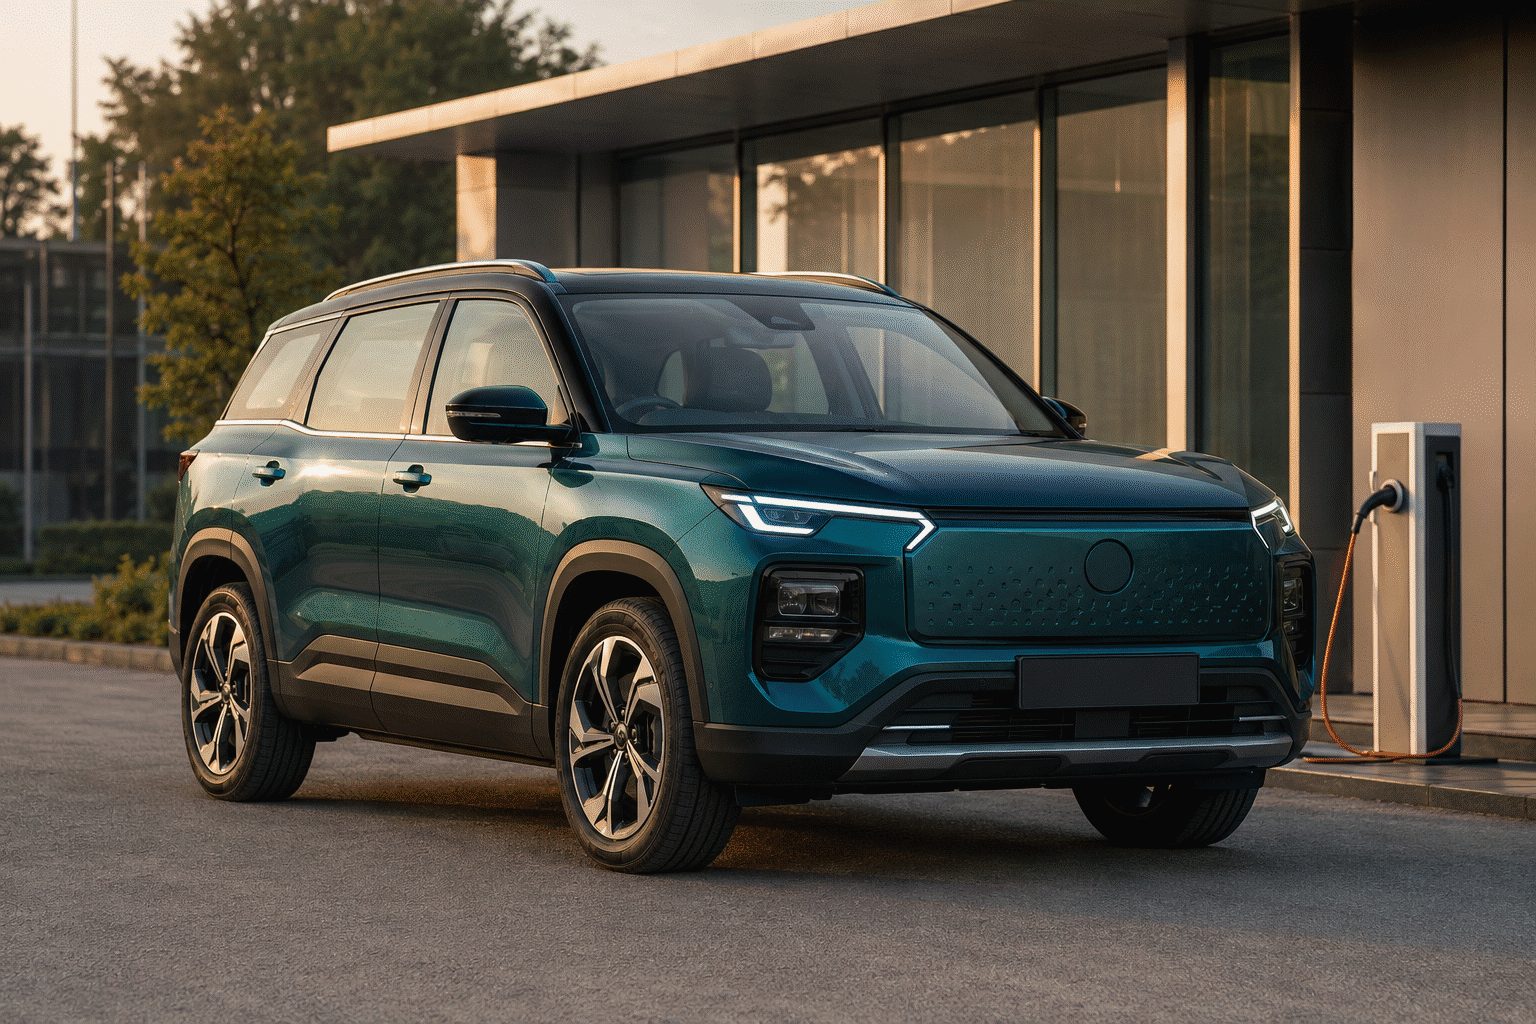
| Metric | EV | PHEV |
|---|---|---|
| Battery | 69.2kWh | 20.5kWh |
| Electric range | 517km | 115km |
| Combined range | — | 1,100km+ |
| BaaS rental | ₹4.90/km | ₹3.20/km |
| Delivery start | September | November |
EV BaaS cuts entry cost 28.2%; PHEV BaaS cuts it 15.2%. At 10,000km per year, rentals add ₹49,000 and ₹32,000.
| JSW MG 2025 sales | 70,500 vehicles |
| Growth vs. 2024 | +15.6% |
| Current annual capacity | 120,000 |
| Planned annual capacity | 300,000 |
| Planned investment | $330m–$440m |
| FY2025 venture loss | $121m |
| Close / daily move | CN¥10.39 / +0.78% |
| Volume | 32.57m shares |
| Market value | CN¥117.79bn |
| Trailing revenue | CN¥655.8bn |
| Trailing net income | CN¥10.11bn |
| Trailing P/E | 11.6× |
| Next earnings date | Aug. 29, 2026 |
| Checkpoint | Timing | Signal |
|---|---|---|
| EV registrations | September | Search interest converting into paid deliveries |
| PHEV handovers | November | Demand for long-range hybrid packaging |
| Localization | 2026–2027 | Lower FX and freight exposure |
| Capacity ramp | Multi-year | Utilization against 300,000-unit target |
15.3% below the RMB26.61B LSEG consensus.
About 58% of XPeng's current equity value, but the deal does not fix the near-term earnings gap.
Nearly three times the prior-year loss and well above expectations.
Bank of America maintained Buy with a $19 target on August 24. The target range still sits above the share price, but forecasts may lag the new guidance.
China's EV price war can keep vehicle margins under pressure. Robotics investment may deepen losses before commercial sales begin. The Dogotix financing terms do not reveal XPeng's exact economic stake, so its $6.3 billion-plus valuation should not be treated as cash attributable to XPeng shareholders.
Tesla’s 2.98 million-vehicle action equals 11.2× its 2026 China retail sales through July.
Most remedies use warning labels and remote software, limiting workshop time and hardware expense.
July local deliveries fell 32.9% YoY to 27,249. Exports reached a record 66,330.
Monday’s move also reflects wider auto-sector pressure from new tariff threats. The recall should not be treated as the sole price catalyst.
| Firm | Call | Target |
|---|---|---|
| GLJ | Sell | $200 |
| Barclays | Hold | $370 |
| Wells Fargo | Sell | $130 |
| Morgan Stanley | Hold | $400 |
| DBS | Hold | $330 |
47-analyst consensus: Buy. Target range: $125–$600.

NIO Inc. · overseas optionality versus Chinese operating leverage
The stock recovered Friday but remained 42.3% below its $8.02 52-week high. Monday's premarket reversal returned focus to execution risk.
NIO scopes include Firefly where reported. The scale difference makes Europe a strategic signal, not a near-term earnings driver.
| Measure | Q1'26 | Q4'25 | Q1'25 |
|---|---|---|---|
| Revenue | 25.53bn | 34.65bn | 12.03bn |
| Gross margin | 19.0% | 17.5% | 7.6% |
| Vehicle margin | 18.8% | 18.1% | 10.2% |
| Adj. operating P/(L) | 66.8m | 1.25bn | −5.95bn |
| Cash & liquid funds | 48.2bn | 45.9bn | — |
Q2 deliveries were 107,658, below NIO's 110,000–115,000 guidance. September 1 will reveal the margin cost.
| What to watch | Bull case | Bear case |
|---|---|---|
| Vehicle margin | Holds near 18.8% | Discounting breaks the trend |
| Cash conversion | Fourth positive operating-cash quarter | Working-capital reversal |
| August deliveries | Reaccelerate above July's 35,934 | Sequential decline persists |
| Europe plan | New platform timetable or distributors | Old stock lasts into late 2027 |
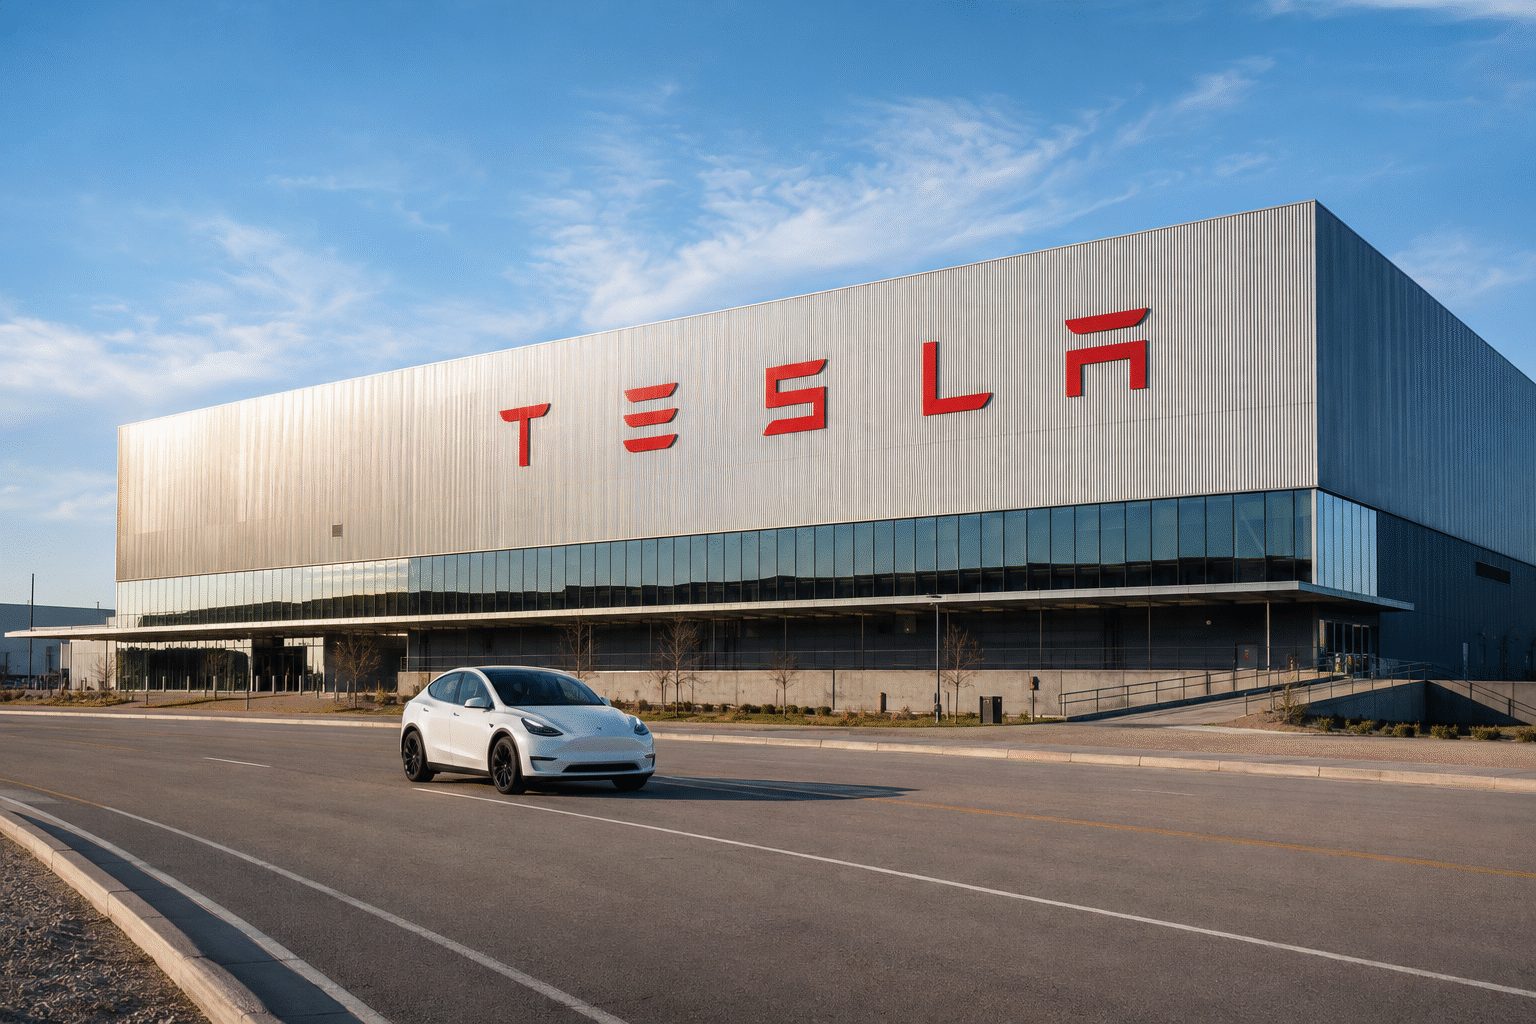
Nevada replaced a narrow interim limit with commercial authority for up to 5,000 Tesla robotaxis. The permit removes a regulatory bottleneck. The next valuation test is deployment: inspections, insurance and fare filings still come before paid rides.
| Firm | Call | Target | Vs. close |
|---|---|---|---|
| GLJ Research | Sell | $24.86 | -93.1% |
| Jefferies | Hold | $350 | -3.5% |
| TD Cowen | Buy | $460 | +26.8% |
| Stifel | Buy | $491 | +35.3% |
Rivian Automotive · NASDAQ:RIVN
Session range $16.06–$17.15 · Volume 29.89M vs. 24.89M average
Nearly equal to July's net equity proceeds.
Net proceeds from 86.25M shares at $15.50.
The follow-on discount has been repaired.
$7.163B pro forma liquidity ÷ Q2 free-cash outflow.
Rivian's rally repaired the dilution discount, but it also carried the stock to Wall Street's average target. The next rerating needs operating proof: R2 volume, better automotive gross margin and tighter cash use. Three months of free Adventure Network charging, a $3,000 lease contribution and discounted financing may pull R1 deliveries into Q3. They also test pricing power.
Runway is a static comparison, not company guidance. Options-led moves can reverse. Incentives, R2 delays or higher working capital could pressure margins and liquidity.
Sources: Google Finance · Rivian Q2 release · Rivian offers
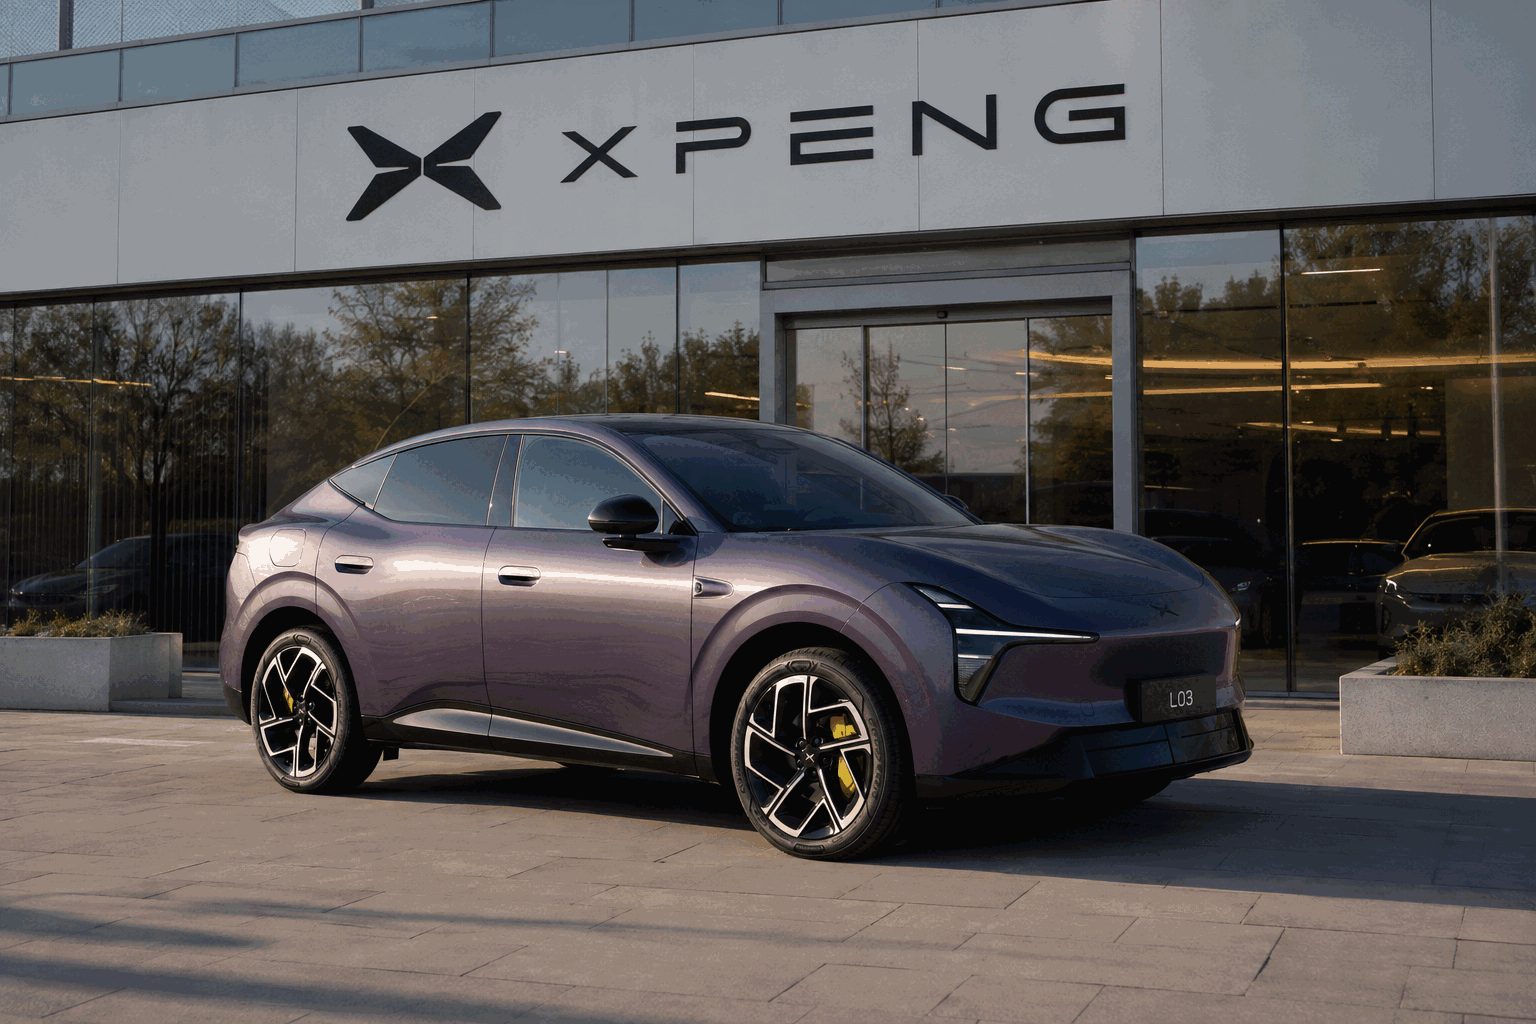
XPeng's L03 has a starting price of €35,600 in Germany. The key challenge is scaling up: to hit its 2026 goal, XPeng needs to more than double its average monthly overseas deliveries from the first quarter.
Last session ended at $11.99 on Aug. 19, 2026, 16:00 EDT. The five-session closing performance showed a rise of 2.04%.
XPeng recorded an average of 3,852 monthly overseas registrations during the first quarter. To approach 90,000 by 2026, the company requires approximately 8,716 registrations every month from April to December.
As of the close on Aug. 19
Close stands 4.4% higher than the low
+84.1% compared to Aug. 19 close · 26 analysts
up 125.9% from a year earlier
Deliveries in Germany are set for Q4 2026. WLTP standard-range is 445 km, while long-range reaches 520 km.
The consensus rating is Buy, with price targets spanning from $15.07 to $28.16. Bernstein lowered its rating to Hold and set a $20 target on Aug. 18.
Analysts project revenue will grow by 20.3% in 2026, with adjusted EPS expected to turn positive in 2027.
Ahead of the U.S. market open. Conference call scheduled for 08:00 EDT / 14:00 CEST.
Monitor vehicle margin, the rate of overseas order conversion, and management’s assurance in achieving the approximately 90,000 overseas target.
Risk: L03 demand might fall short of bridging the run-rate shortfall. Returns could be restricted by pricing challenges, tariffs, execution lags, or softer residual values.
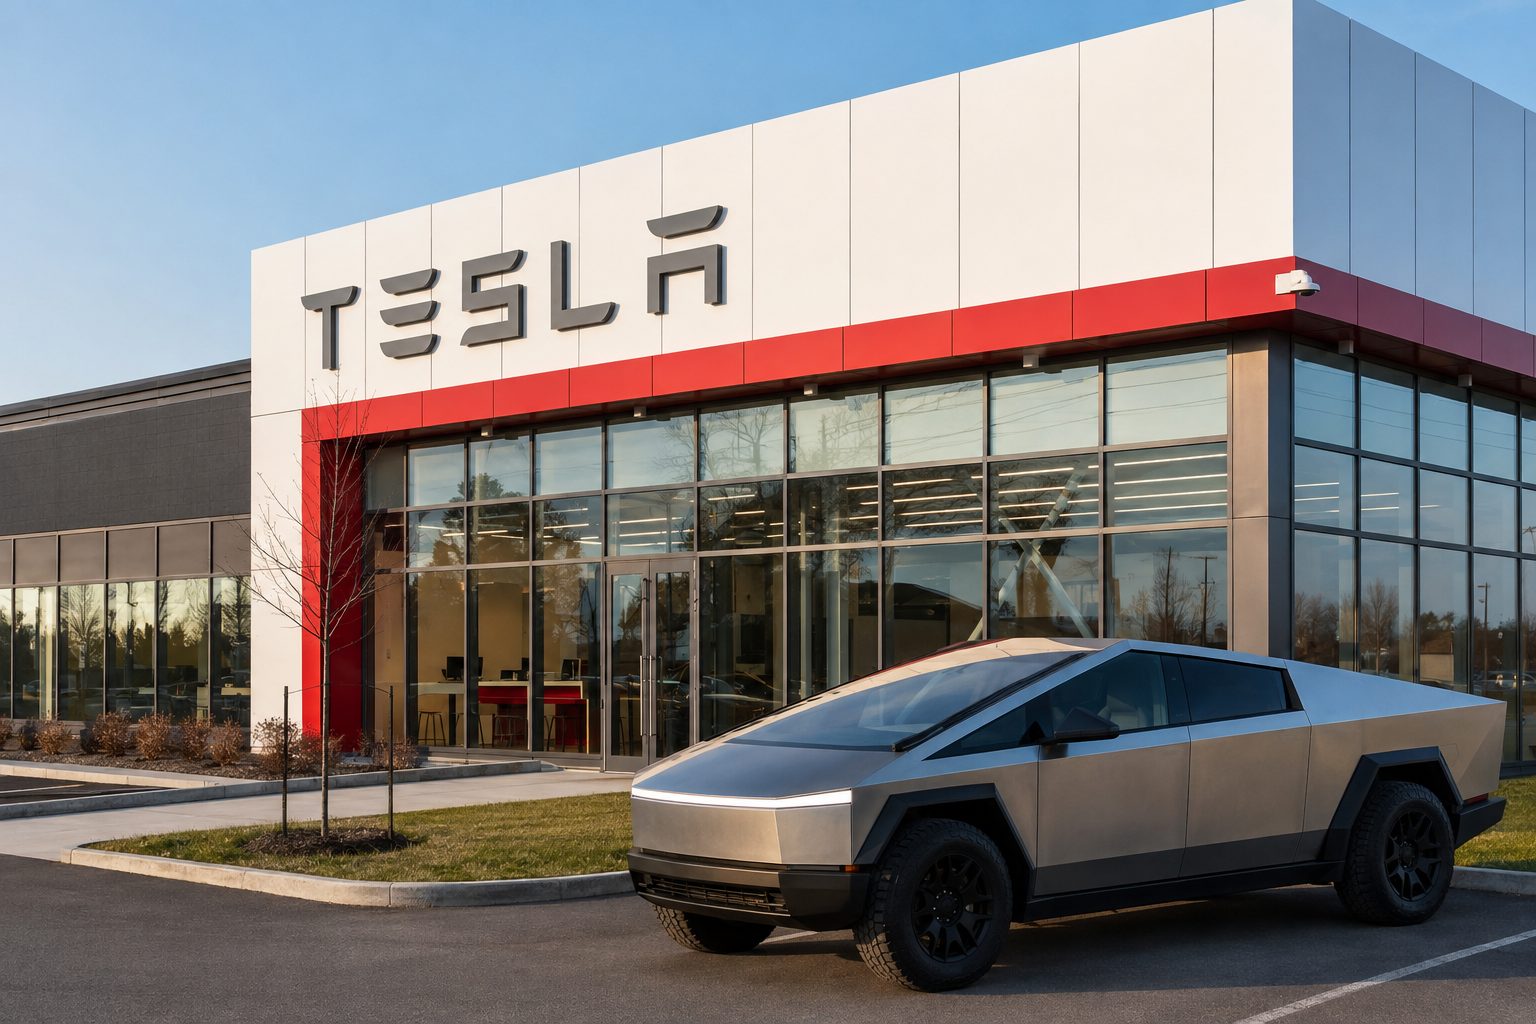
Tesla controls trade-in offer timing, while investors lack a standalone Cybertruck volume line. Watch completed resale prices and finished-goods inventory together. If both weaken, margin pressure can arrive before model-level disclosure does.
Trade-in estimates are not completed sales. A Cybercab launch, stronger total deliveries or lower Q3 inventory could overwhelm the resale signal. New safety actions would move it the other way.
Sources: Tesla Canada trade-in terms; Tesla Q2 2026 delivery release; Tesla Form 10-Q; Google Finance. Market data is time-stamped above and may be delayed. Percentages are calculated from reported figures.
Market closed
August 18, 2026 · 4:00 PM ET
Prices in U.S. dollars
Tesla’s cumulative disclosed unsupervised total equals about 0.67 day of Waymo’s weekly pace.
Cities with Tesla unsupervised miles versus Waymo paid rides.
Derived from Tesla’s six-month cash-flow statement; before other investing uses.
Revenue, up 26% year over year.
Net income attributable to common holders.
The $402.24 consensus implies 19.4% upside; published targets span $25.28 to $600.
Watch weekly unsupervised miles, rides per vehicle and revenue per mile—not only the number of Cybercabs produced.