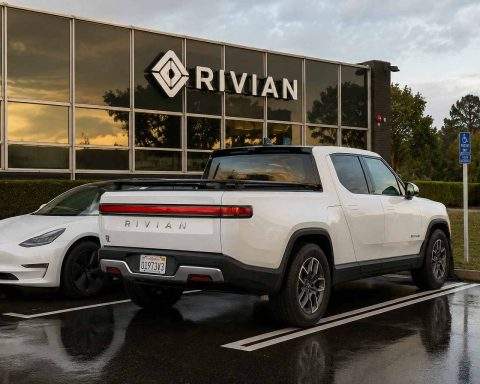

NEW YORK, July 30, 2026, 17:06 EDT — Rivian shares advanced after the automaker’s second-quarter results topped expectations, though the company’s gross profit continues to rely on software performance.
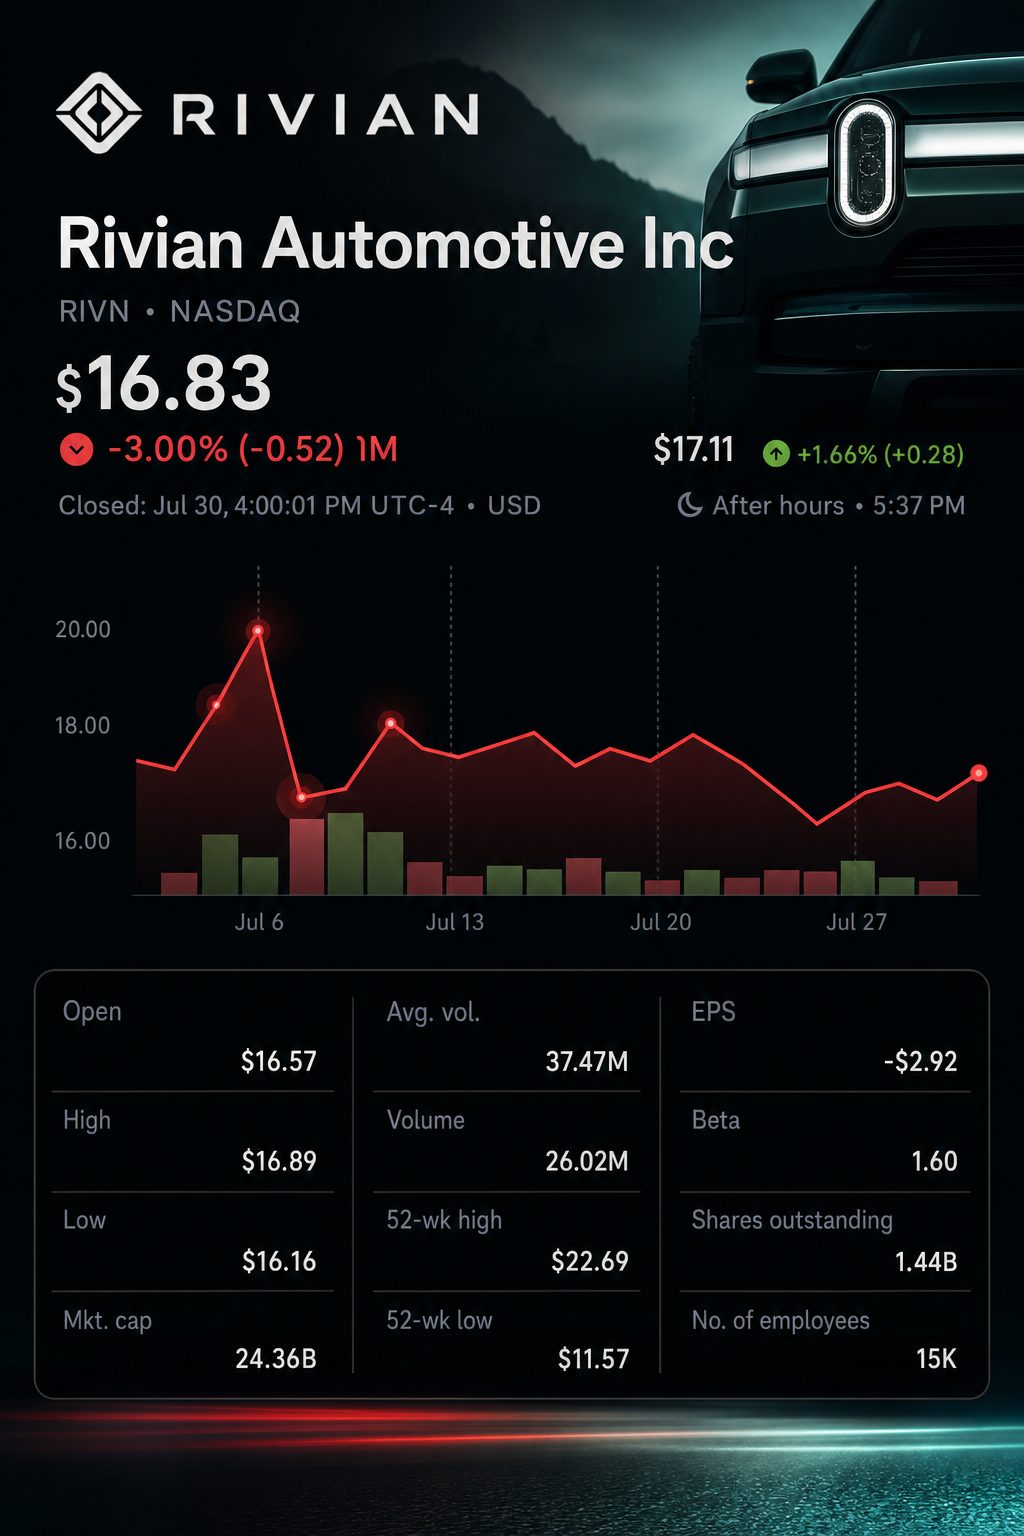
- Rivian ended the session at $16.83, rising 2.9%, and added almost 2% in after-hours trading.
- Revenue exceeded expectations by approximately 10%, while the adjusted loss was 17 cents better than anticipated.
- Gross profit from software totaled $215 million, counterbalancing an automotive segment loss of $36 million.
Shares of Rivian Automotive NASDAQ:RIVN climbed close to 2% in after-hours trading on Thursday, following stronger-than-expected revenue and a smaller adjusted loss. The company also started R2 customer deliveries. These developments came after the close of regular trading on the Nasdaq.
The underlying numbers painted a bleaker picture for vehicles. Software generated $215 million in gross profit, which amounts to 120% of Rivian’s combined gross profit. The automotive segment, meanwhile, reported a gross loss of $36 million.
Software accounted for only 31% of revenue in the quarter, but despite the loss on vehicles, it generated the entire consolidated gross profit. The company’s heavy reliance on software continues to be a key concern for investors.
Rivian met key quarterly targets. The LSEG numbers listed are projections, not official results from the company.
| Q2 measure | Rivian result | Street estimate | Variance |
|---|---|---|---|
| Revenue | $1.658 billion | $1.51 billion | Exceeds by about $148 million |
| Adjusted loss per share | $0.46 | $0.63 | $0.17 less negative |
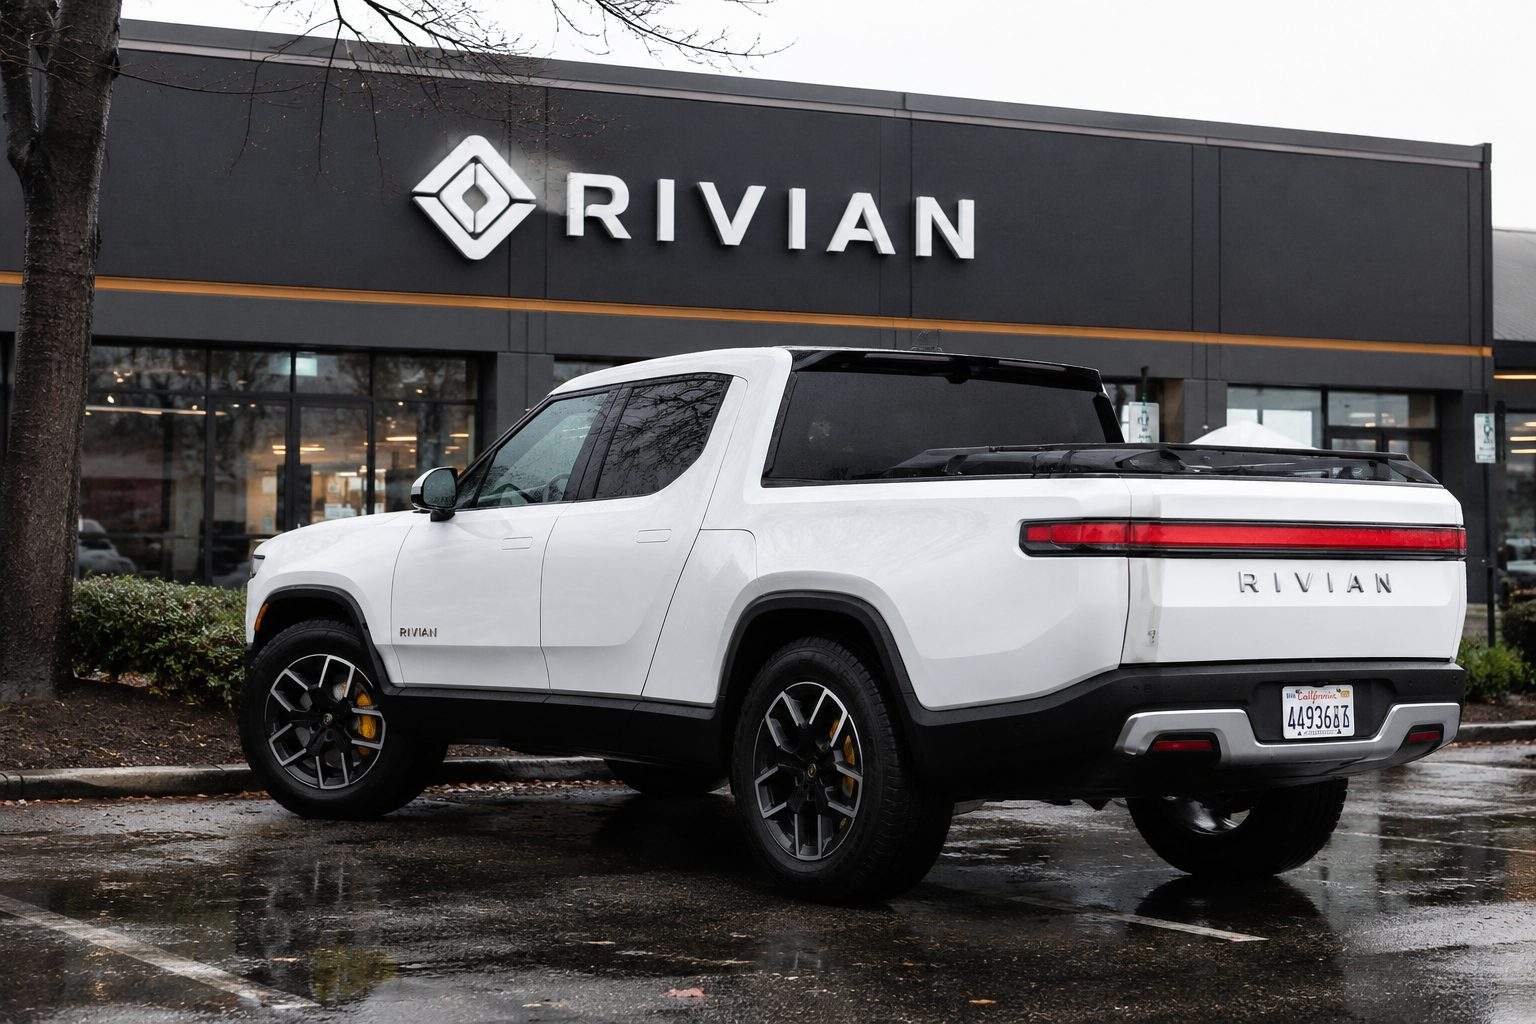
Rivian started delivering R2 vehicles on June 9. The company provided 57,000 demo drives over the quarter. CEO RJ Scaringe stated that Launch Edition conversions came in “meaningfully above our own internal projections.” Scaringe anticipates a positive R2 gross margin in the second half. Business Wire
Rivian built 12,613 vehicles and handed over 12,194 to customers. Deliveries increased 14% compared to the same period last year. Average selling prices declined, with a greater proportion of R2 units and commercial vans in the total.
Segment margins help explain why the profit discussion continued despite the earnings beat. The following margins are derived from company data.
| Q2 segment | Revenue | Gross profit | Calculated margin | Revenue change |
|---|---|---|---|---|
| Automotive | $1.143 billion | $(36) million | (3.1)% | up 23% |
| Software and services | $515 million | $215 million | 41.7% | up 37% |
| Consolidated | $1.658 billion | $179 million | 10.8% | up 27% |
Volkswagen Group ETR:VOW3 generated $308 million in software revenue, representing 60% of the segment and 19% of overall sales. The automotive segment’s gross loss was reduced by $299 million from a year earlier, aided by credits, increased production and a tariff refund.
The R2 ramp incurred additional expenses of approximately $100 million. Consequently, gross profit did not equate to net profit. Rivian reported a loss of $833 million attributable to common shareholders, or 63 cents per share.
The delivery guidance set out in early July was kept by management. Other yearly targets have been raised compared to the projections from the first quarter. These numbers continue to represent projections, rather than reported results.
| 2026 measure | Q1 outlook | Current outlook | Midpoint change |
|---|---|---|---|
| Vehicle deliveries | 62,000–67,000 | 65,000–70,000 | Increase of 3,000 vehicles |
| Adjusted EBITDA loss | $1.80–$2.10 billion | $1.80–$2.00 billion | Loss improved by $50 million |
| Capital expenditure | $1.95–$2.05 billion | $1.70–$1.80 billion | Down by $250 million |
The EBITDA midpoint rose by just $50 million. Higher credit revenue and increased deliveries were partially weighed down by costs for raw materials, memory, and logistics. Reduced capital expenditures were due to greater project efficiency and changes in timing.
Cash burn continued to be the most evident limitation. Free cash flow, after accounting for capital expenditures, showed sequential improvement. However, it was still down significantly compared to a year earlier.
| Cash measure | Q2 2025 | Q1 2026 | Q2 2026 |
|---|---|---|---|
| Cash and short-term investments | $7.508 billion | $4.830 billion | $5.310 billion |
| Operating cash flow | $64 million | $(703) million | $(487) million |
| Capital expenditure | $(462) million | $(372) million | $(362) million |
| Free cash flow | $(398) million | $(1.075) billion | $(849) million |
The 86.25 million-share offering in July increased net proceeds by $1.317 billion on a pro forma basis, raising available liquidity to $7.163 billion. This figure does not represent quarter-end cash.
Rivian rose approximately 6% between last Friday and Thursday’s close. However, the stock was still down around 15% for 2026 prior to the late advance.
Lucid Group NASDAQ:LCID is set to announce quarterly earnings on August 4. The report could offer fresh insight into demand and cash flow trends.
Key risks are still focused on R2 execution, weak demand for electric vehicles, and volatility in credit. New dilution further increases the challenge. Automotive gross margin continues to be negative and free cash outflows remain elevated.
Investors are now focused on a clear milestone. R2 needs to achieve positive automotive gross profit and cut its reliance on software. Until that happens, group gross profit gives an inflated view of vehicle economics.
Related articles: NASDAQ:RIVN