
LONDON, August 19, 2026, 23:52 BST
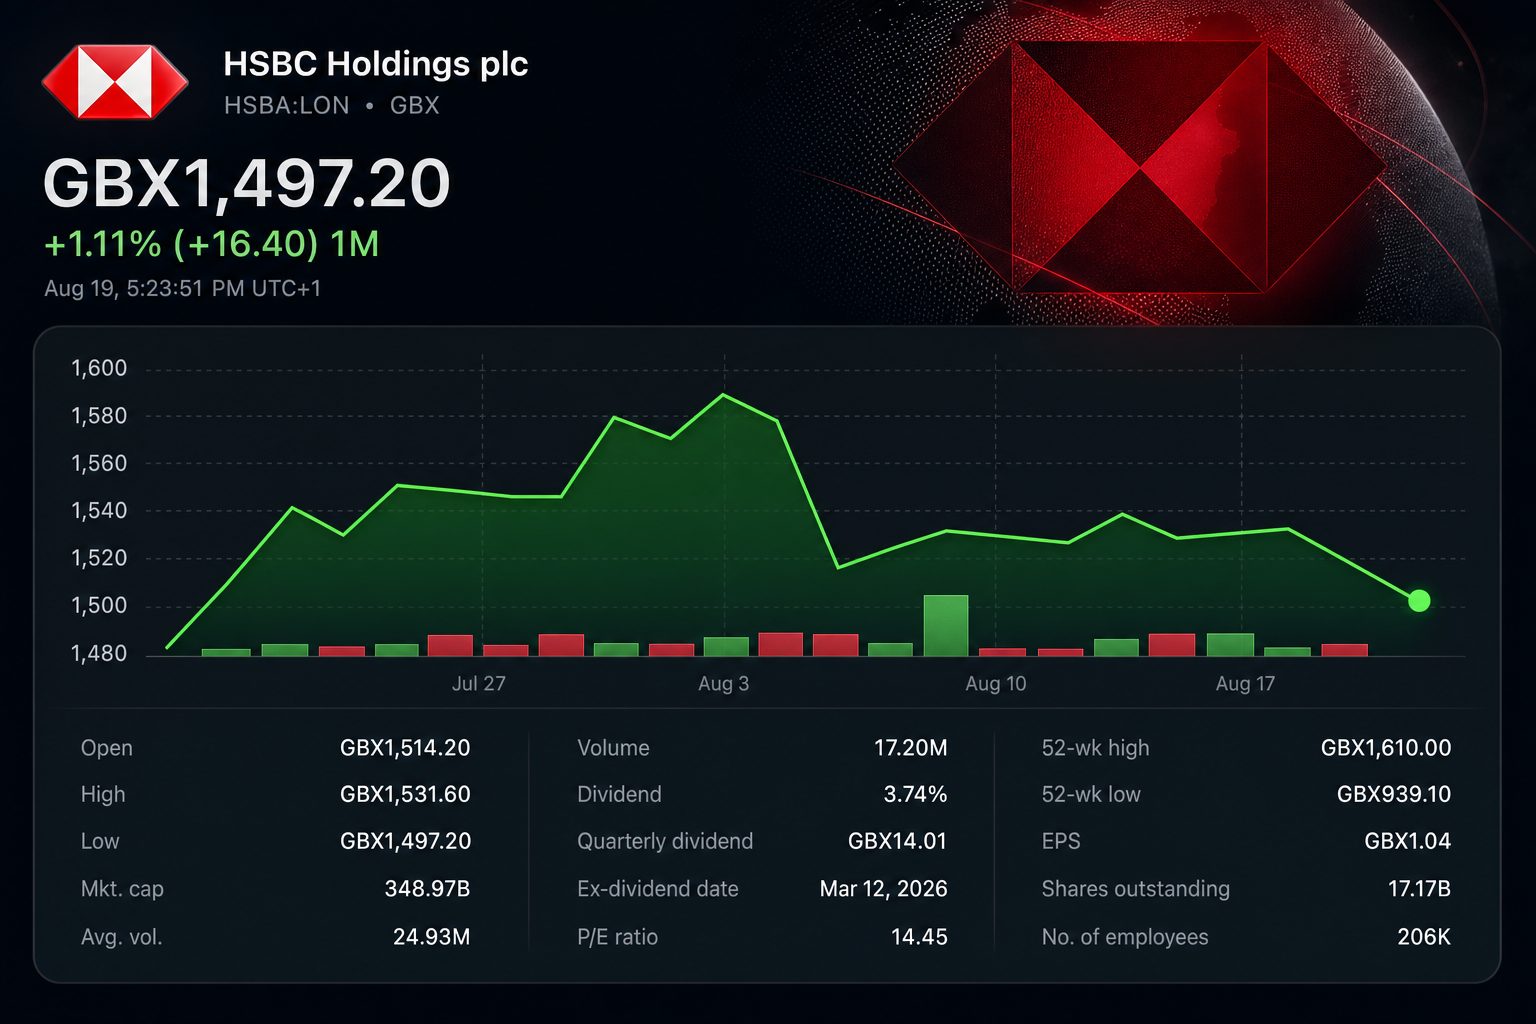
- HSBC shares closed 1.15% lower at 1,497.2 pence on August 19.
- The planned $1 billion buyback equals about 0.28% of market value.
- HSBC’s 14.1% CET1 ratio sits near the bottom of its target range.
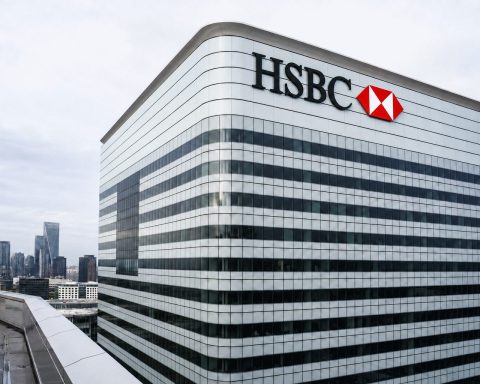
HSBC Holdings plc (LON:HSBA; HKG:0005) fell 1.15% to 1,497.2 pence on Wednesday. Its planned $1 billion buyback equals only 0.28% of the bank’s $352.08 billion market value.
That makes the repurchase a signal, not a large valuation support. HSBC is restarting buybacks after the Hang Seng Bank privatisation. Yet its capital ratio leaves limited room above management’s floor.
The London market is closed. HSBC has slipped about 2.1% from an August 5 market snapshot of 1,529.2 pence. Strong interim earnings therefore face a more cautious view on capital returns.
HSBC trades above European peers on trailing earnings. Banco Santander SA BME:SAN offers a lower multiple but a smaller yield. UBS Group AG SWX:UBSG carries a higher multiple and lower yield. Banco Bilbao Vizcaya Argentaria SA (BME:BBVA) also trades below HSBC’s valuation.
| European bank | Aug. 19 move | Market cap | Trailing P/E | Dividend yield |
|---|---|---|---|---|
| HSBC | -1.15% | $352.08bn | 14.38x | 3.71% |
| Santander | -1.24% | $211.50bn | 11.31x | 1.56% |
| UBS | -0.44% | $160.50bn | 18.41x | 1.99% |
| BBVA | -1.05% | $160.30bn | 12.74x | 2.38% |
HSBC’s first-half result was strong. Reported profit before tax rose 23% to $19.5 billion. Excluding notable items, profit increased 6% at constant currencies to $20.4 billion.
| First-half 2026 measure | Result | Year-on-year change | Investor read |
|---|---|---|---|
| Reported profit before tax | $19.5bn | +23% | Helped by notable-item base |
| Adjusted profit before tax | $20.4bn | +6% at constant currency | Underlying growth |
| Reported revenue | $37.7bn | +11% | Higher NII and fees |
| Adjusted revenue | $38.2bn | +6% at constant currency | Broad business momentum |
| Banking net interest income | $22.9bn | +$1.6bn | Rate support |
| Annualised RoTE | 18.2% | 19.1% excluding notable items | Above target |
Chief Executive Georges Elhedery said, “HSBC is becoming the stronger bank we set out to build.” Management targets a return on tangible equity of at least 17% through 2028. HSBC
Capital is the constraint. The CET1 ratio fell 0.8 percentage points to 14.1%. That leaves only 0.1 point above the bottom of HSBC’s 14.0% to 14.5% operating range.
| Capital-return measure | Latest | Reference | Scale |
|---|---|---|---|
| Planned buyback | Up to $1.0bn | $352.08bn market cap | 0.28% |
| Second interim dividend | $0.10 per share | Board approved | Cash return |
| Dividend payout target | 50% | 2026-2028 | Excludes material notable items |
| CET1 ratio | 14.1% | 14.0%-14.5% range | 0.1 point above floor |
| 2026 banking NII outlook | At least $46bn | Raised outlook | Rate-sensitive |
| 2026 credit-cost outlook | About 45 bp | 30-40 bp medium-term range | Above normal |
Analysts are split. The 17-analyst average target is 1,485.6 pence, about 0.8% below Wednesday’s close. Goldman Sachs sees 1,860 pence, while JPMorgan’s 1,450 target implies downside.
| Analyst or consensus | Recommendation | Target | Vs. 1,497.2p |
|---|---|---|---|
| 17-analyst consensus | Neutral | 1,485.6p | -0.8% |
| Goldman Sachs | Buy | 1,860p | +24.2% |
| Bank of America | Buy | 1,720p | +14.9% |
| Morgan Stanley | Hold | 1,674p | +11.8% |
| UBS | Hold | 1,620p | +8.2% |
| Citi | Hold | 1,570p | +4.9% |
| JPMorgan | Hold | 1,450p | -3.2% |
Risks: Hong Kong property exposure could lift credit costs. Lower interest rates may pressure net interest income. The Hang Seng privatisation and disposals may also consume capital or create restructuring charges.
In the week ahead, investors will watch buyback execution and UK yield moves. Hong Kong credit indicators will matter too. A stable CET1 ratio would make the resumed capital return more credible.
Related articles: LON:HSBA
Strong earnings, small buyback
London close
Market value
Trailing P/E
Dividend yield
Buyback scale
First-half scorecard
| Measure | Result | Change |
|---|---|---|
| Reported pre-tax profit | $19.5bn | +23% |
| Adjusted pre-tax profit | $20.4bn | +6% CER |
| Reported revenue | $37.7bn | +11% |
| Banking NII | $22.9bn | +$1.6bn |
| Annualised RoTE | 18.2% | Above 17% target |
Capital headroom
| Gauge | Latest | Reference |
|---|---|---|
| CET1 ratio | 14.1% | 14.0%-14.5% range |
| Distance from floor | 0.1 point | Thin |
| Second interim dividend | $0.10/share | Approved |
| Payout target | 50% | 2026-2028 |
| 2026 NII outlook | At least $46bn | Raised |
| Credit-cost outlook | ~45 bp | Above 30-40 bp normal |
Analyst target range
| View | Target | Vs. close |
|---|---|---|
| 17-analyst average | 1,485.6p | −0.8% |
| Goldman Sachs · Buy | 1,860p | +24.2% |
| BofA · Buy | 1,720p | +14.9% |
| Morgan Stanley · Hold | 1,674p | +11.8% |
| UBS · Hold | 1,620p | +8.2% |
| JPMorgan · Hold | 1,450p | −3.2% |