Friday close
$13.64
−0.58%
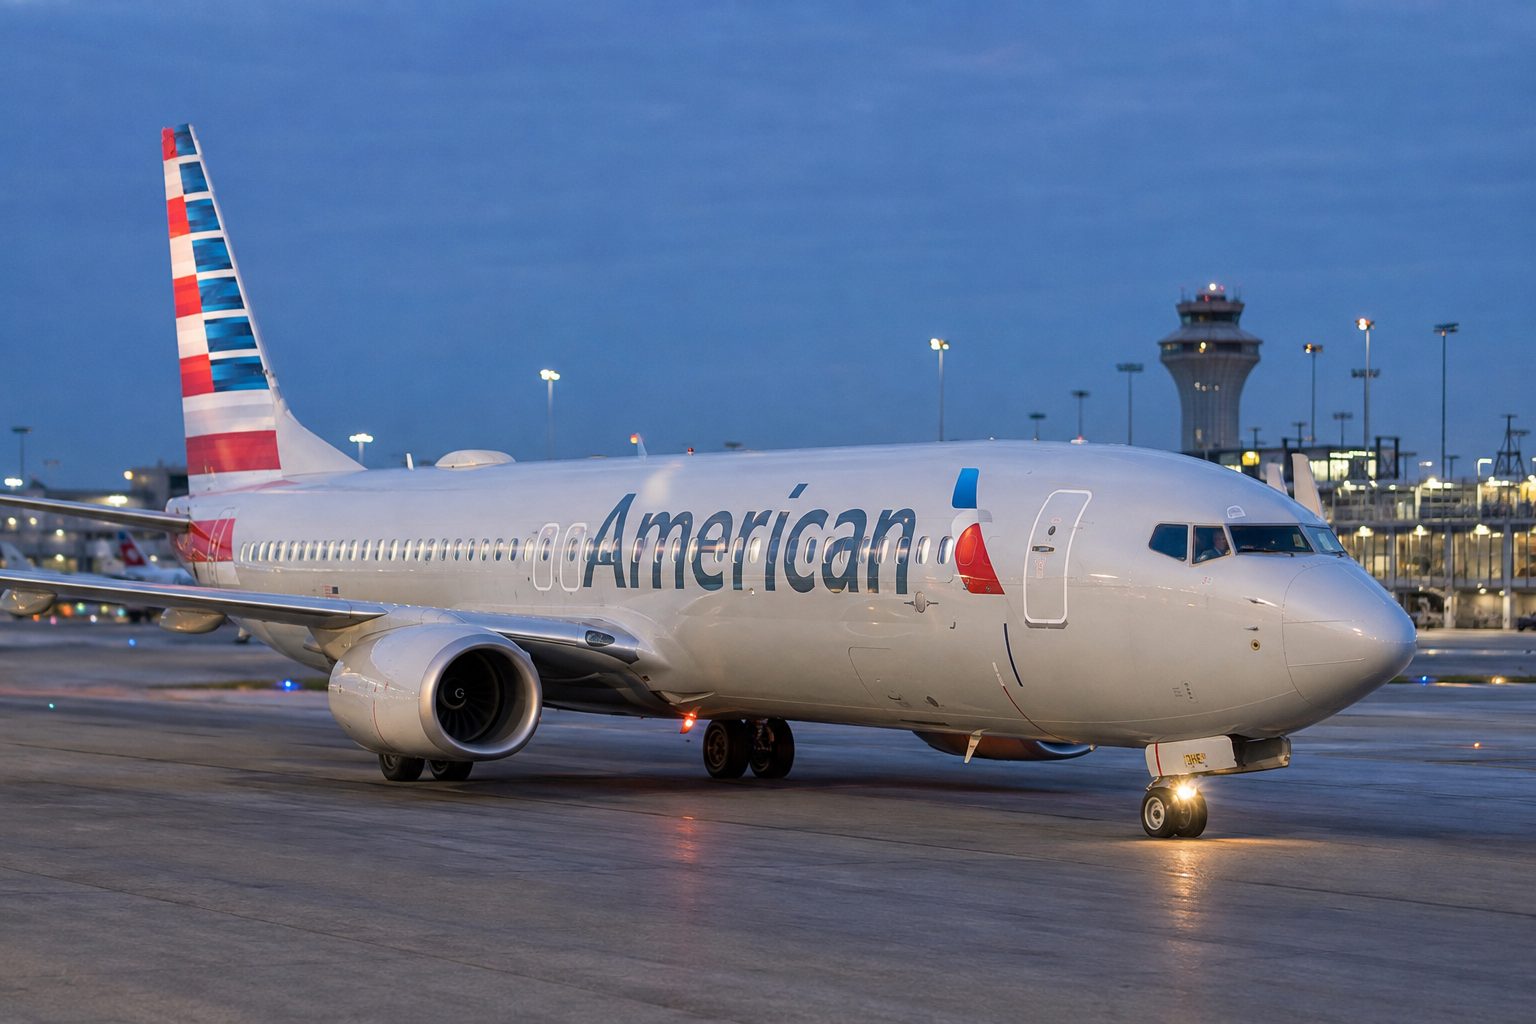
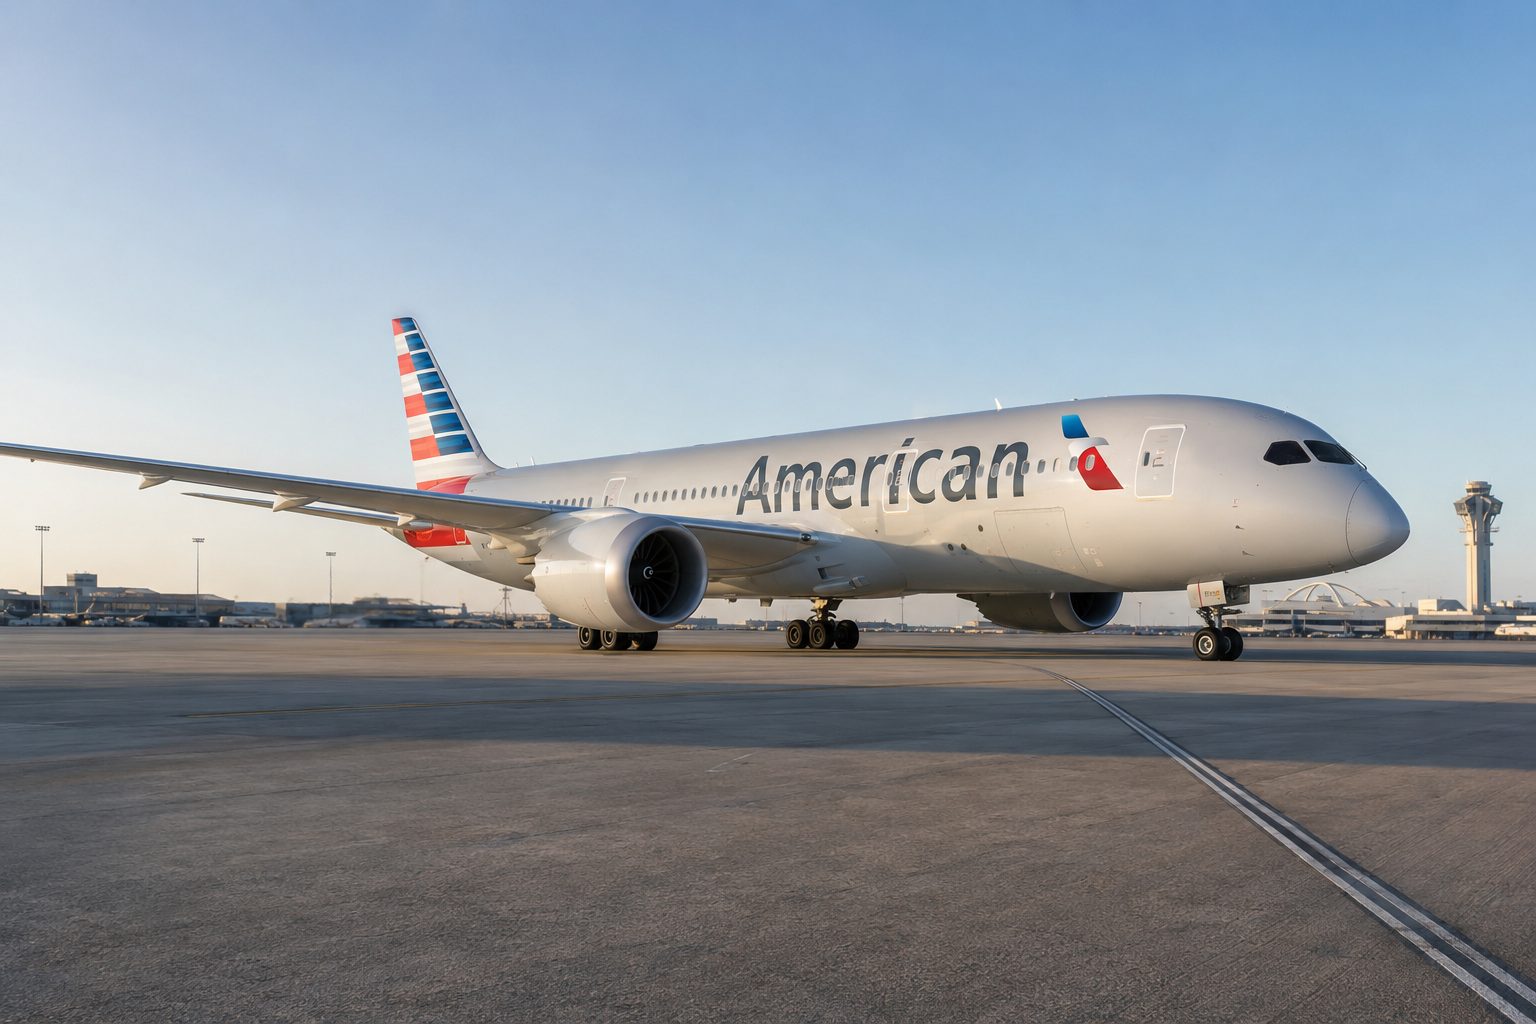
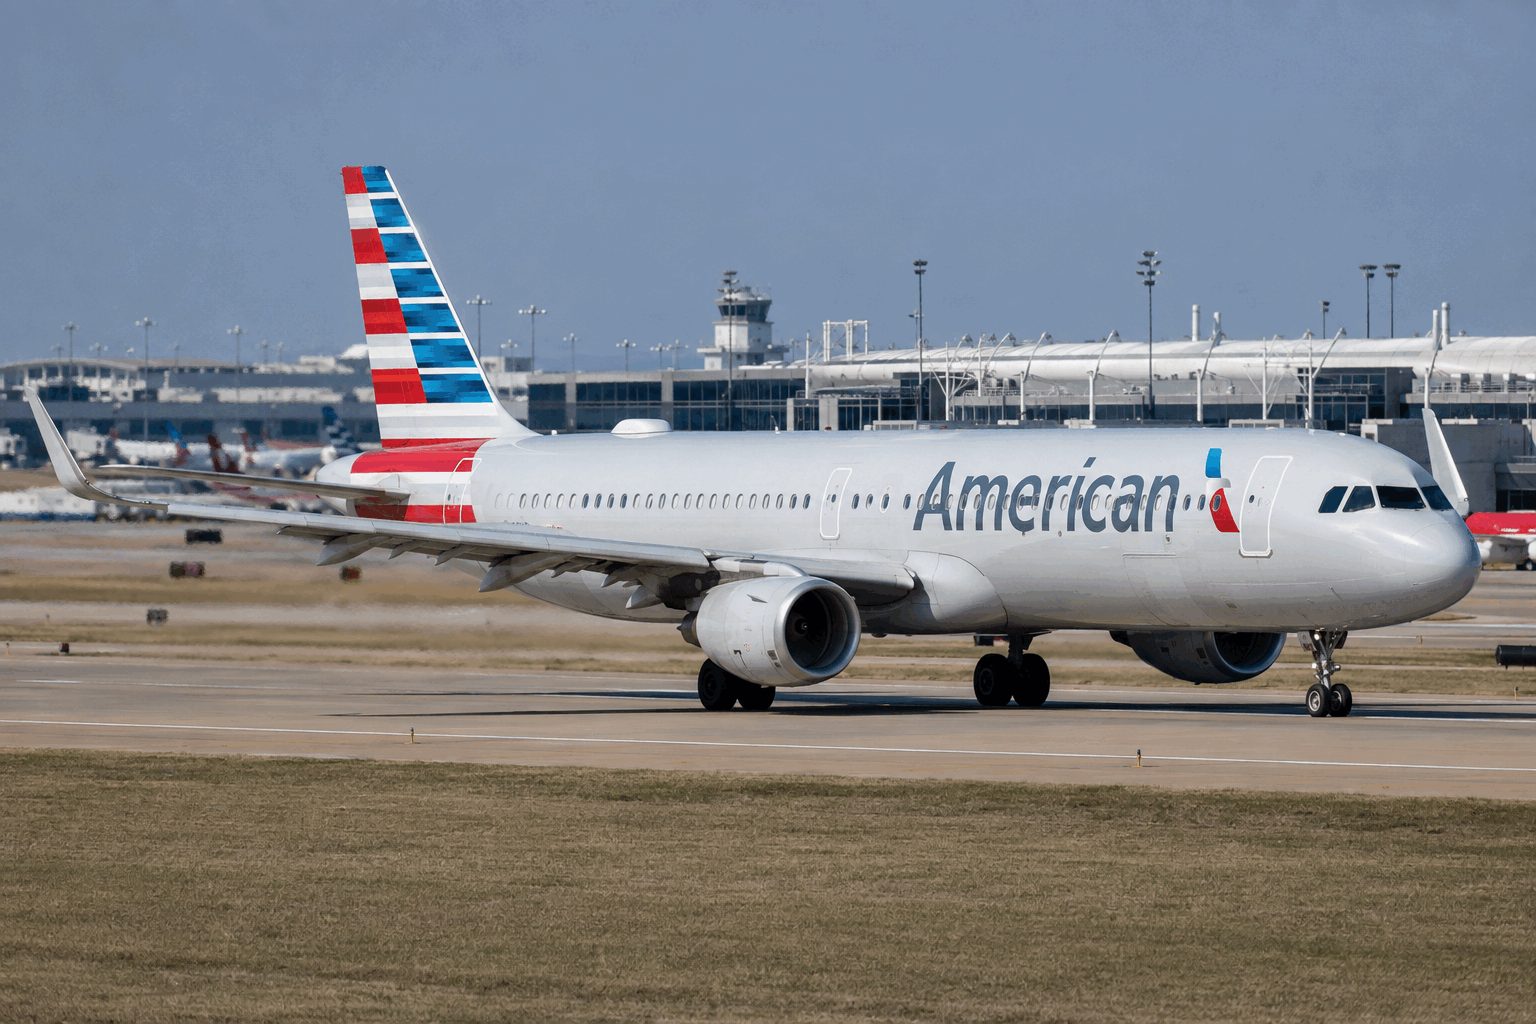
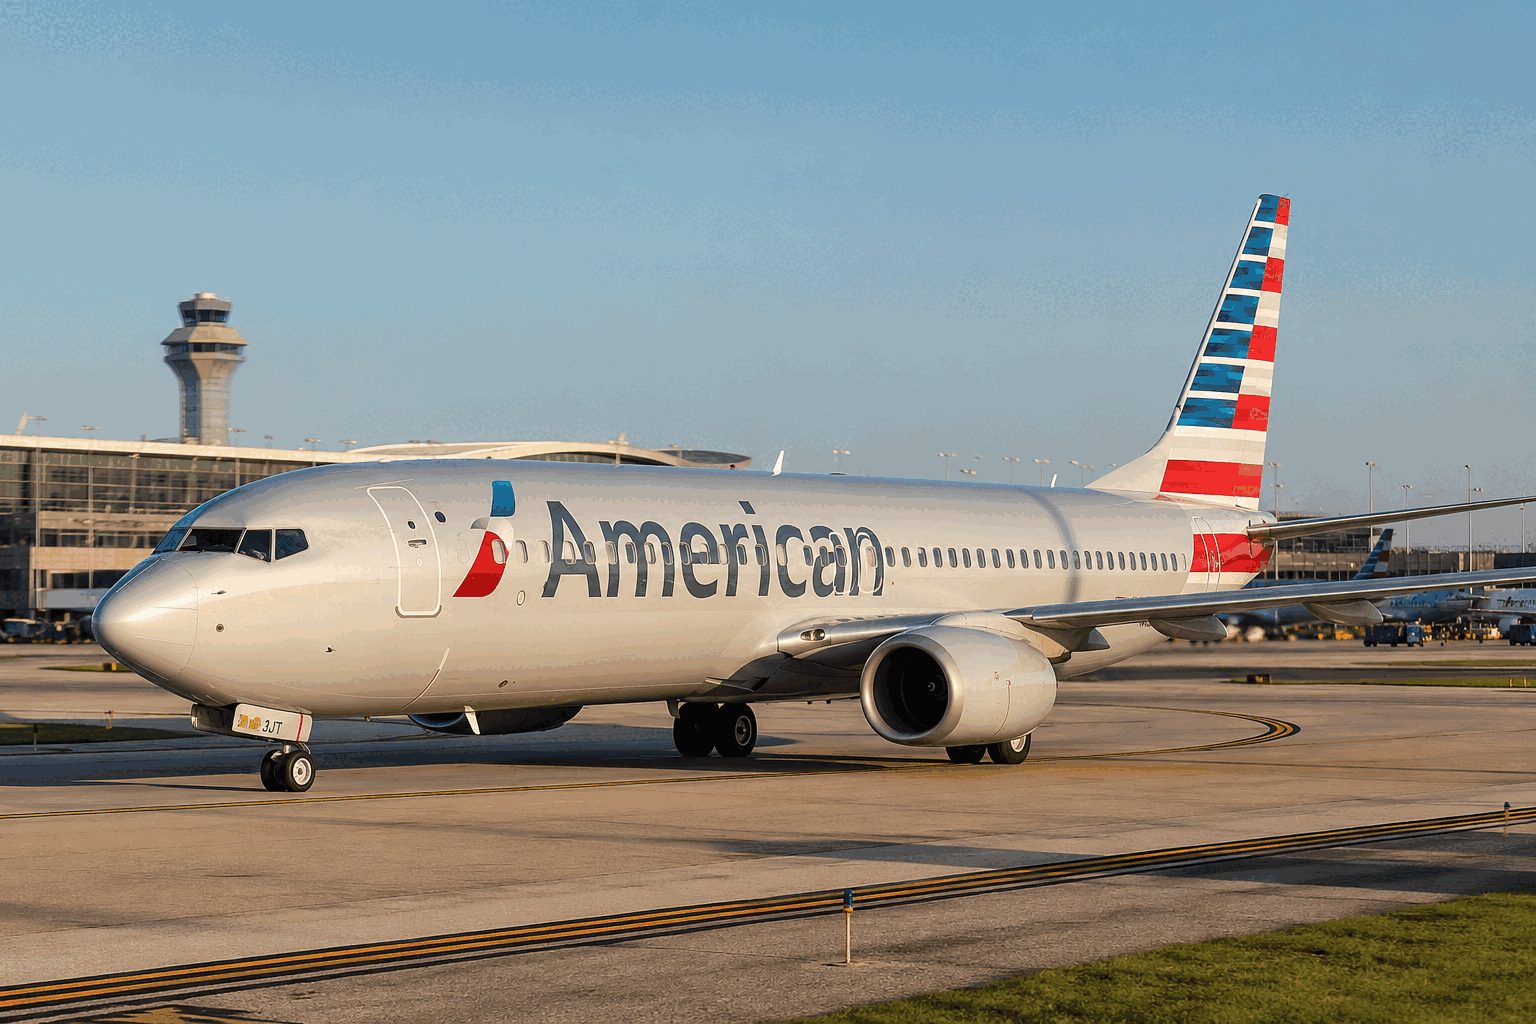
American Airlines Group Inc. ended Friday down 0.58%, with trading volumes substantially above average. The stock finished the session at $13.64 on 63.4 million shares traded.
NASDAQ: AAL
Investor dashboard
Updated Aug. 29, 2026, 14:21 ET
Friday close
$13.64
−0.58%
Volume
63.4M
Near 64.4M daily average
Market value
≈$9.0B
At Friday close
Analyst target
$18.50
+35.6% implied
Record sales, narrow profit
$16.7B revenue
Revenue +16.3% year over year; GAAP net income only $71M.
Fuel versus pricing
+$2.2B fuel expense
Fuel cost rose 83%. Higher fares offset nearly half the headwind.
Approximate share of fuel increase offset through fares, company disclosure.
Operating and outlook snapshot
| Measure | Current / latest | Signal |
|---|---|---|
| Premium passenger unit revenue | +13.4% YoY | Demand strength |
| Managed corporate revenue | +26% YoY | Business travel |
| Q3 revenue guide | +16% to +19% | Momentum |
| Q3 adjusted EPS guide | ($0.70) to ($0.10) | Loss expected |
| Q3 fuel assumption | ≈$3.75/gal | Margin pressure |
| Available liquidity | $11.3B | Buffer |
Analyst spread
$10–$25
12 Buy · 11 Hold · 2 Sell
$13.64 lies 56.7% through the published target range.
What changes the thesis
Upside: realized fuel below $3.75, sustained premium demand, and improved non-fuel unit costs.
Risks: fuel volatility, weaker travel demand, labor disruption and high debt.
Price and volume: Aug. 28, 2026 close, Reuters/Yahoo-derived market data. Fundamentals and guidance: American Airlines Q2 2026 release dated July 23. Analyst consensus observed Aug. 29, 2026. Figures may be rounded.
| Carrier | Move | Market cap |
|---|---|---|
| American | −0.58% | $9.03B |
| Southwest | −0.30% | $19.45B |
| Delta | −1.32% | $53.36B |
| United | −1.59% | $36.48B |
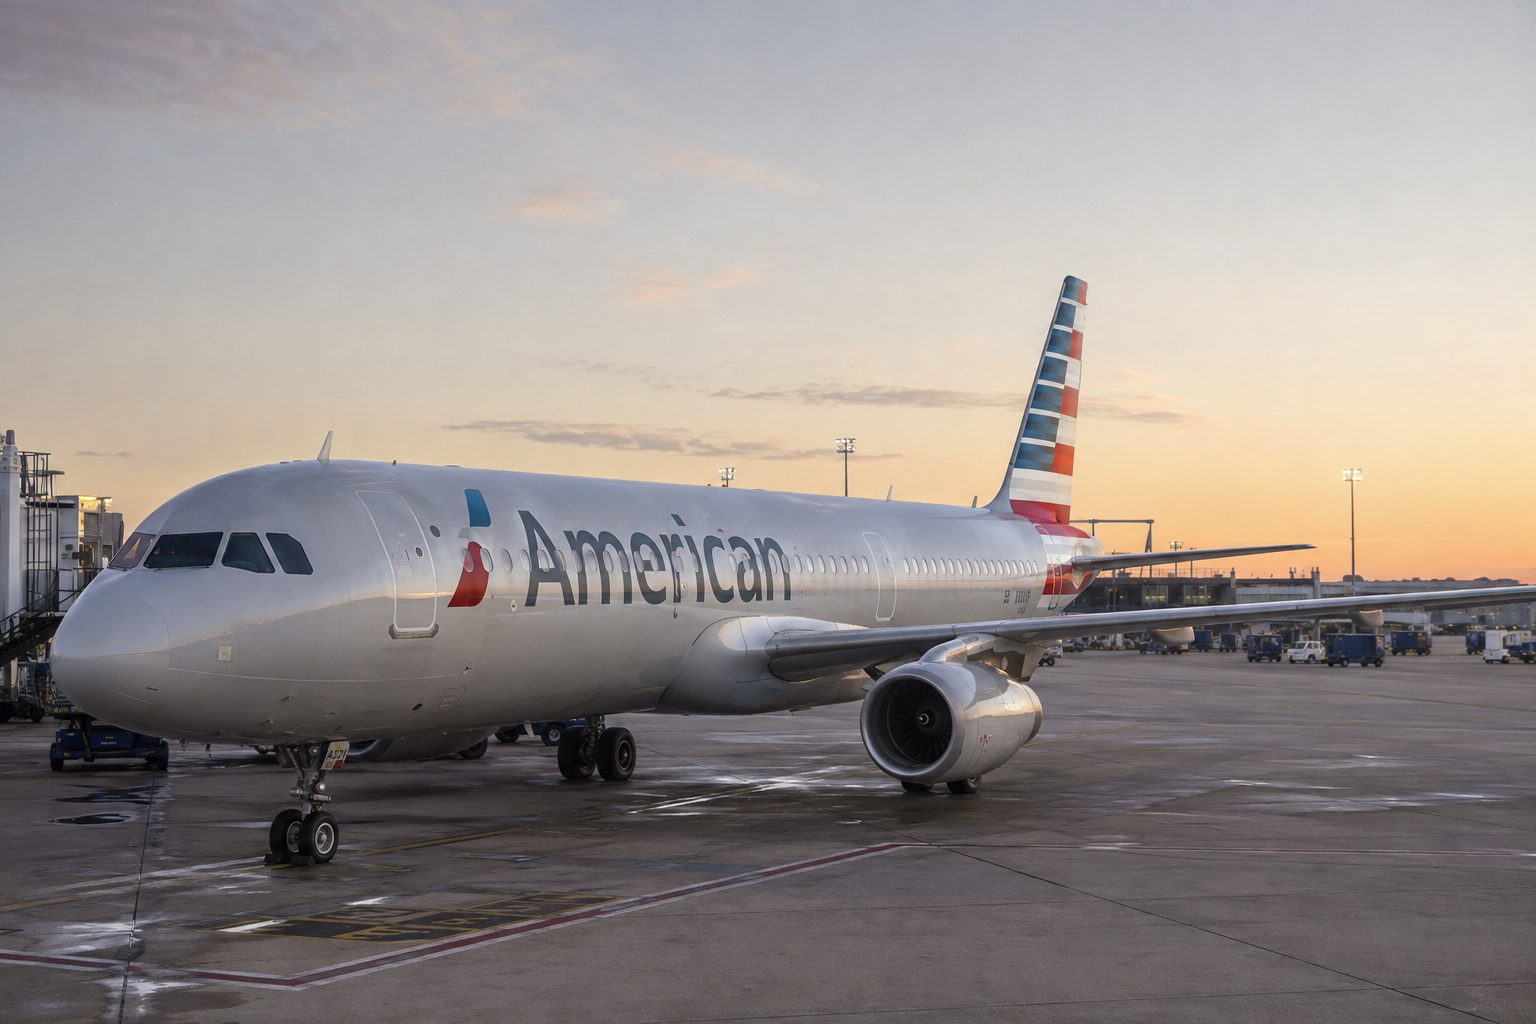
Prices reflect the Aug. 28 close. American changed less than Delta and United despite unusually prominent share activity.
Revenue: $16.7B. GAAP net income: $71M. Adjusted EPS: $0.15.
Seven new international routes go on sale Monday. Management expects third-quarter revenue growth of 16%–19%, but another $1.7B year-over-year fuel increase.
| Consensus | Hold |
| Buy / Hold / Sell | 8 / 11 / 2 |
| Average target | $18.86 |
| TD Cowen | Buy · $16 |
Consensus checked Aug. 29, 2026 at 01:57 EDT.
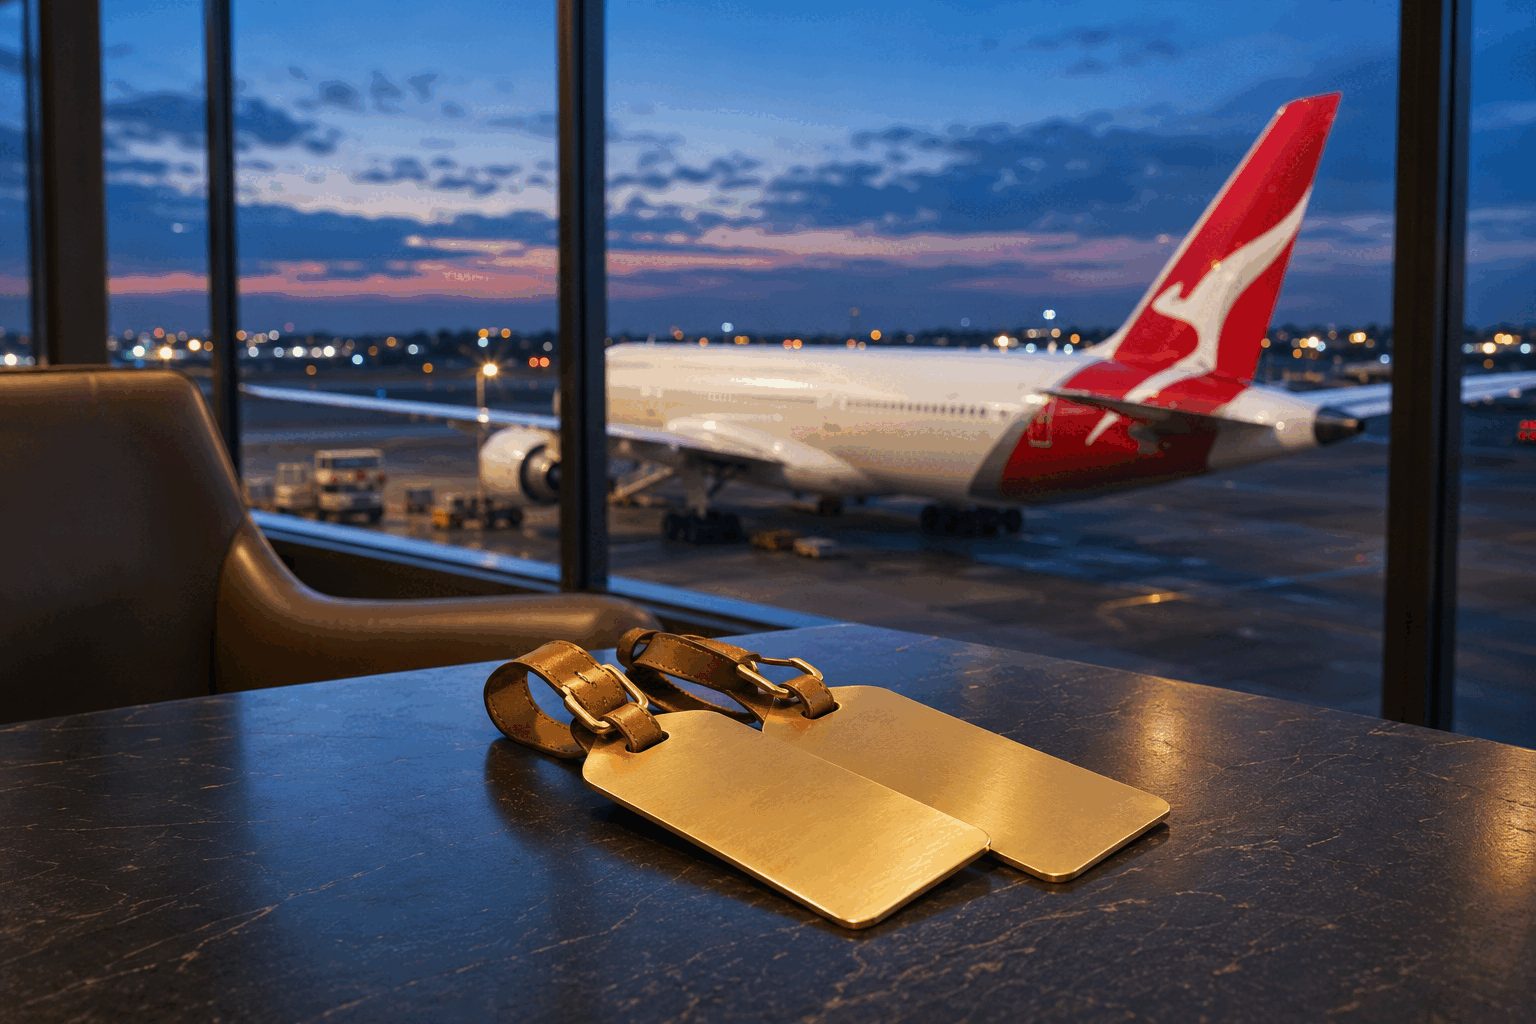
Eight booking days, 346 travel days and an earnings test
All figures are Qantas 1H26 year-on-year measures. Loyalty margin was 20%.
| Measure | Latest figure | Why it matters |
|---|---|---|
| Reward choice | 2× Status Credits or Points | Targets status seekers and redemption users |
| Hotel stacking | Double hotel points | Supports Hotels and Holidays revenue |
| Reward seats | 2.5M in 1H26 | About 14,000 booked daily |
| EBIT per member | A$15.63 in 1H26 | A$286M divided by 18.3M members |
| FY26 Loyalty guide | +10% to +12% EBIT | Thursday's results benchmark |
| Consensus FY26 NPAT | A$1.418B | External earnings expectation |
| Market capitalisation | ≈A$13.65B |
|---|---|
| Trailing P/E | ≈8.7× |
| Dividend yield | ≈4.3% |
| 52-week range | A$8.04–A$12.62 |
| Consensus | Buy |
|---|---|
| Analysts | 17 |
| Buys / Holds / Sells | 15 / 2 / 0 |
| Target range | A$10.00–A$12.50 |
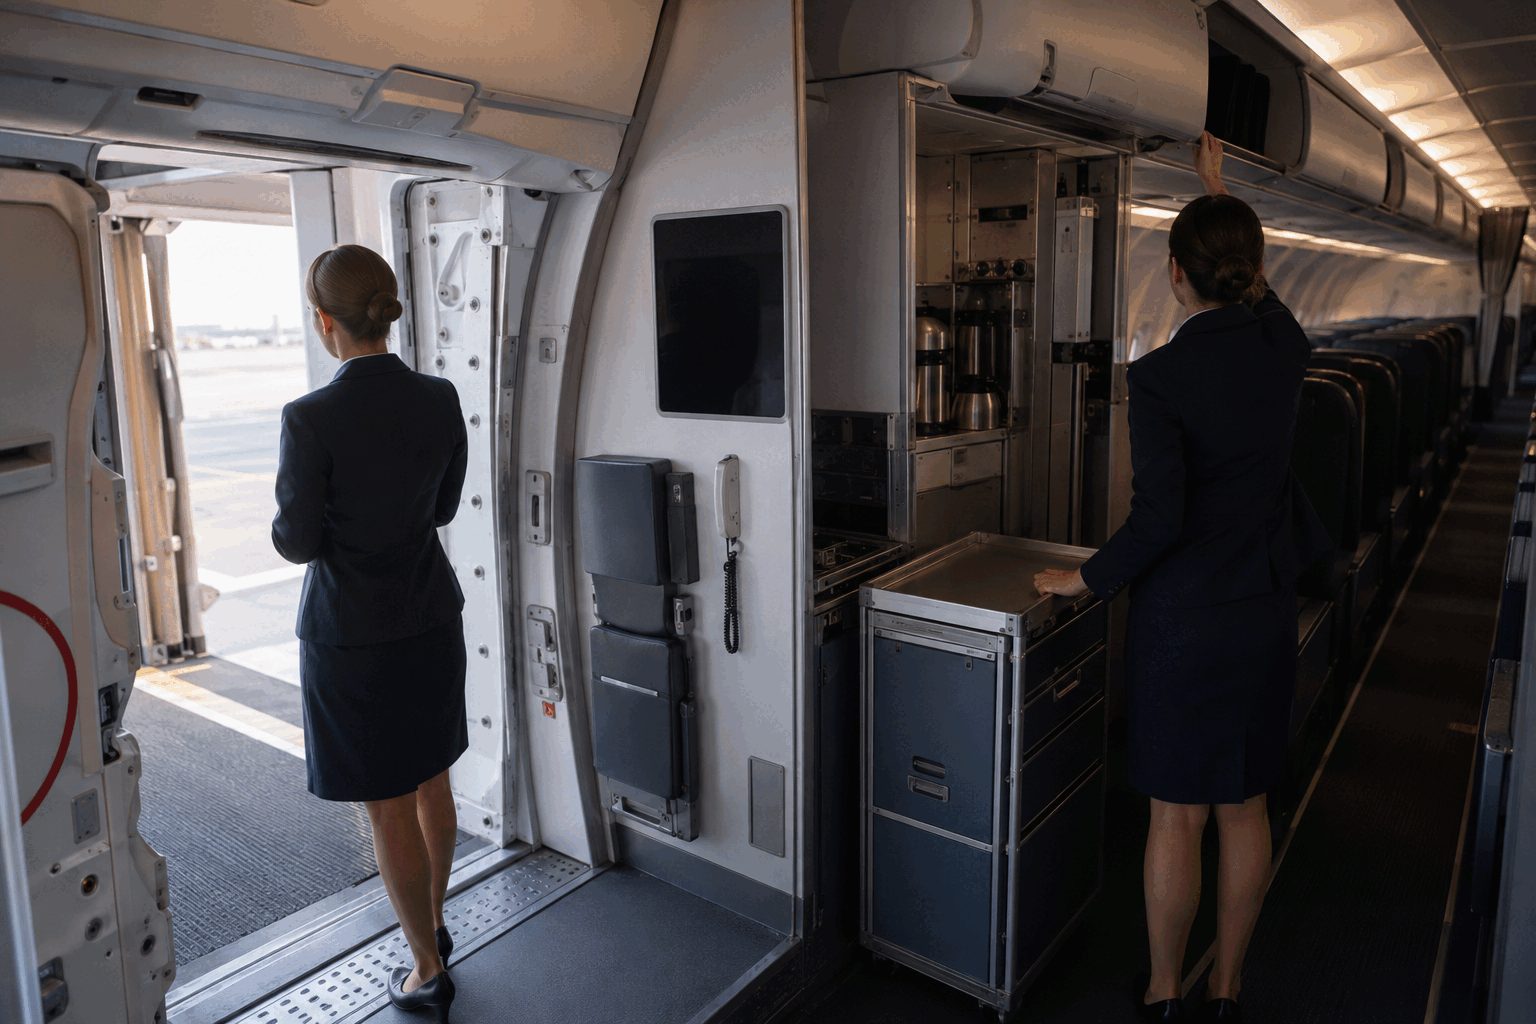
WestJet's ratified cabin-crew agreement expands compensation beyond flying hours. The disclosed wage path compounds to roughly 18.85%; the undisclosed duty-premium formula is the key margin variable.
| Measure | WestJet | Air Canada |
|---|---|---|
| Workers | ~4,400 | ~15,000 |
| Year-one raise | 13% | 8%–13% |
| Ground pay | Premium; rate private | 60%, to 70% |
| Term | 2026–2028 | To Mar. 2029 |
| Exposure | Close | Move | Read-through |
|---|---|---|---|
| Onex (TSE:ONEX) | C$114.15 | +0.67% | WestJet majority owner |
| JetBlue (NASDAQ:JBLU) | $4.95 | +1.23% | Highest basket move |
| Southwest (NYSE:LUV) | $40.71 | +0.82% | U.S. domestic exposure |
| Delta (NYSE:DAL) | $82.48 | +0.08% | Boarding-pay adopter |
| United (NASDAQ:UAL) | $113.57 | +0.35% | Ground-pay adopter |
| S&P 500 | 7,652.86 | -0.28% | Broad benchmark |
The market did not price an immediate sector shock on Monday. The agreement still matters. Its structure moves cabin-crew economics from a simple wage-rate question toward total compensated duty time. Until WestJet discloses the premium formula, investors should treat the 18.85% compounded wage path as a floor—not a full estimate of labor-cost growth.
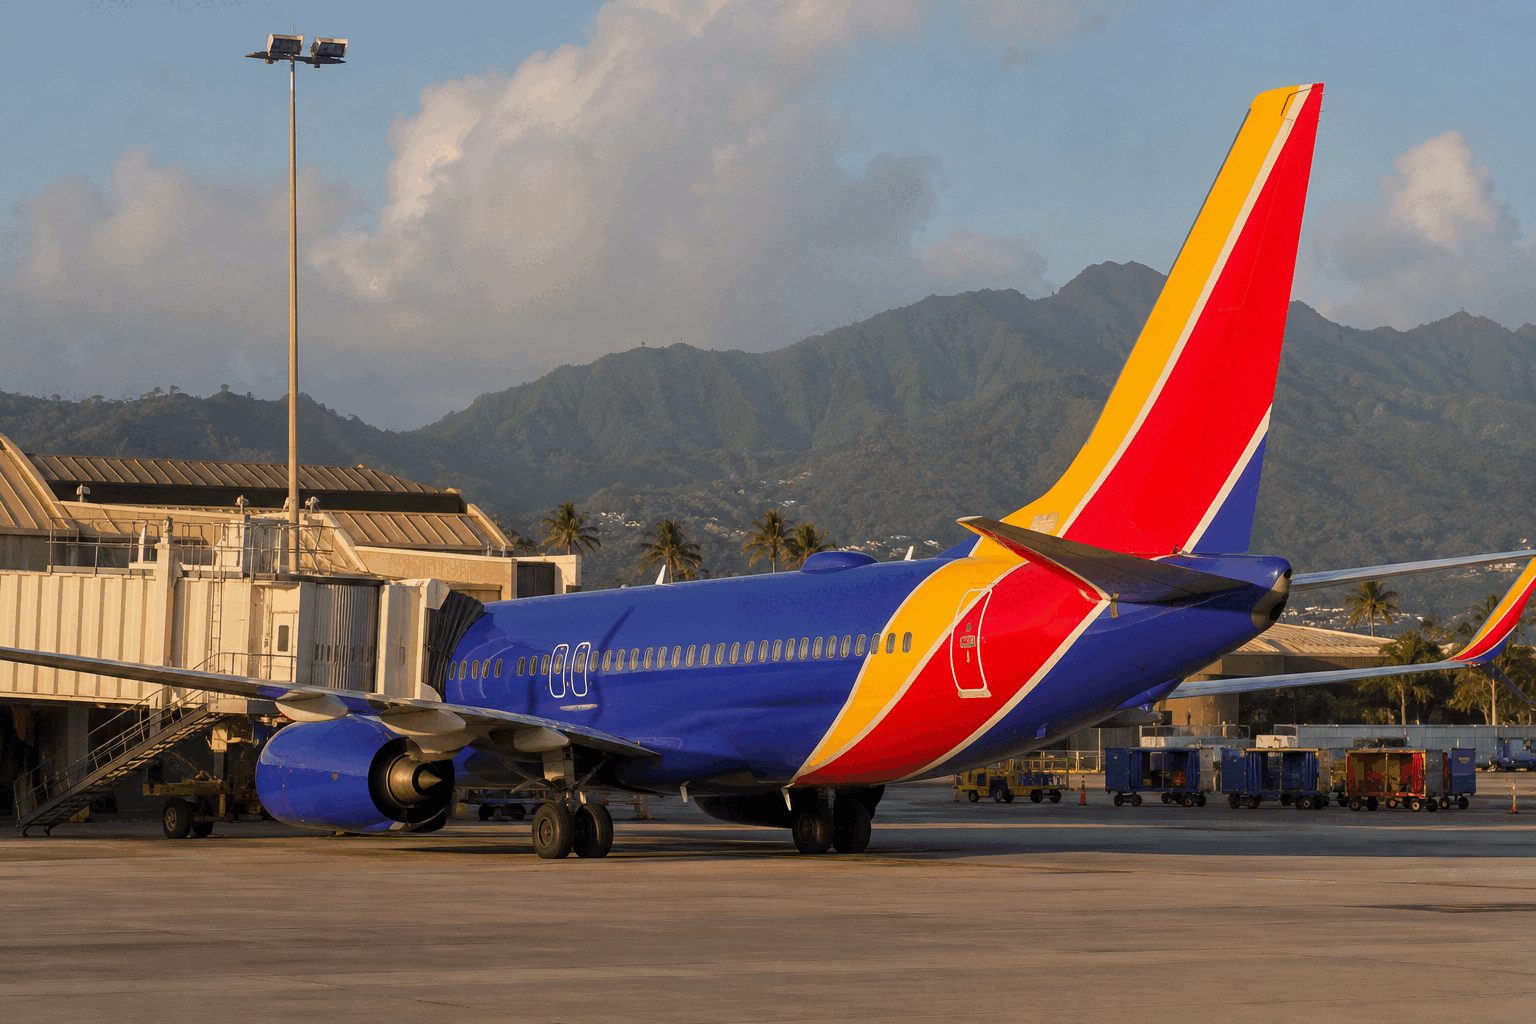
Honolulu police are investigating an employee’s death during a Waikīkī layover. No manner of death, operational disruption, regulatory action or financial charge has been established.
NYSE close, 16:00 EDT
Volume: 5.81M shares
| Security | Move |
|---|---|
| JetBlue (JBLU) | +1.23% |
| Southwest (LUV) | +0.82% |
| United (UAL) | +0.35% |
| Delta (DAL) | +0.08% |
| S&P 500 | −0.28% |
| American (AAL) | −1.37% |
LUV beat an equal-weight basket of four airline peers by about 0.75 percentage point. That does not prove causality, but it shows no visible company-specific selloff.
| Firm / date | View | Target |
|---|---|---|
| Raymond James Aug. 24 | Overweight | $54 ↓ |
| TD Cowen Aug. 24 | Buy | $48 ↓ |
| Wells Fargo Aug. 20 | Hold | $50 |
| S&P Global Aug. 20 | Hold | $51.68 avg. |
Monday’s published cuts cited higher fuel assumptions, not the Hawaii investigation.
Revenue
$8.4B · +16.4% YoY
Adjusted operating margin
6.7% · +3.3 pts
Liquidity
$5.3B
Q3 fuel assumption
$3.70–$3.75/gal.
Base case: investigation stays an employee-welfare and reputation matter without disclosed operational impact.
Escalation trigger: official findings identify workplace-safety failures, company misconduct, a broader threat, litigation or regulatory action.
Watch next: HPD updates; Southwest policy or staffing changes; Q3 revenue, fuel and non-fuel unit-cost delivery.
Market data: regular-session closes on August 24, 2026, 16:00 EDT; FinanceCharts, MarketWatch, S&P Global via Stock Analysis and AP. Fundamentals: Southwest Q2 release dated July 22, 2026. Investigation status: Honolulu Police Department update dated August 24, 2026. Analyst consensus data last checked August 20, 2026. Figures may differ slightly by market-data consolidation.
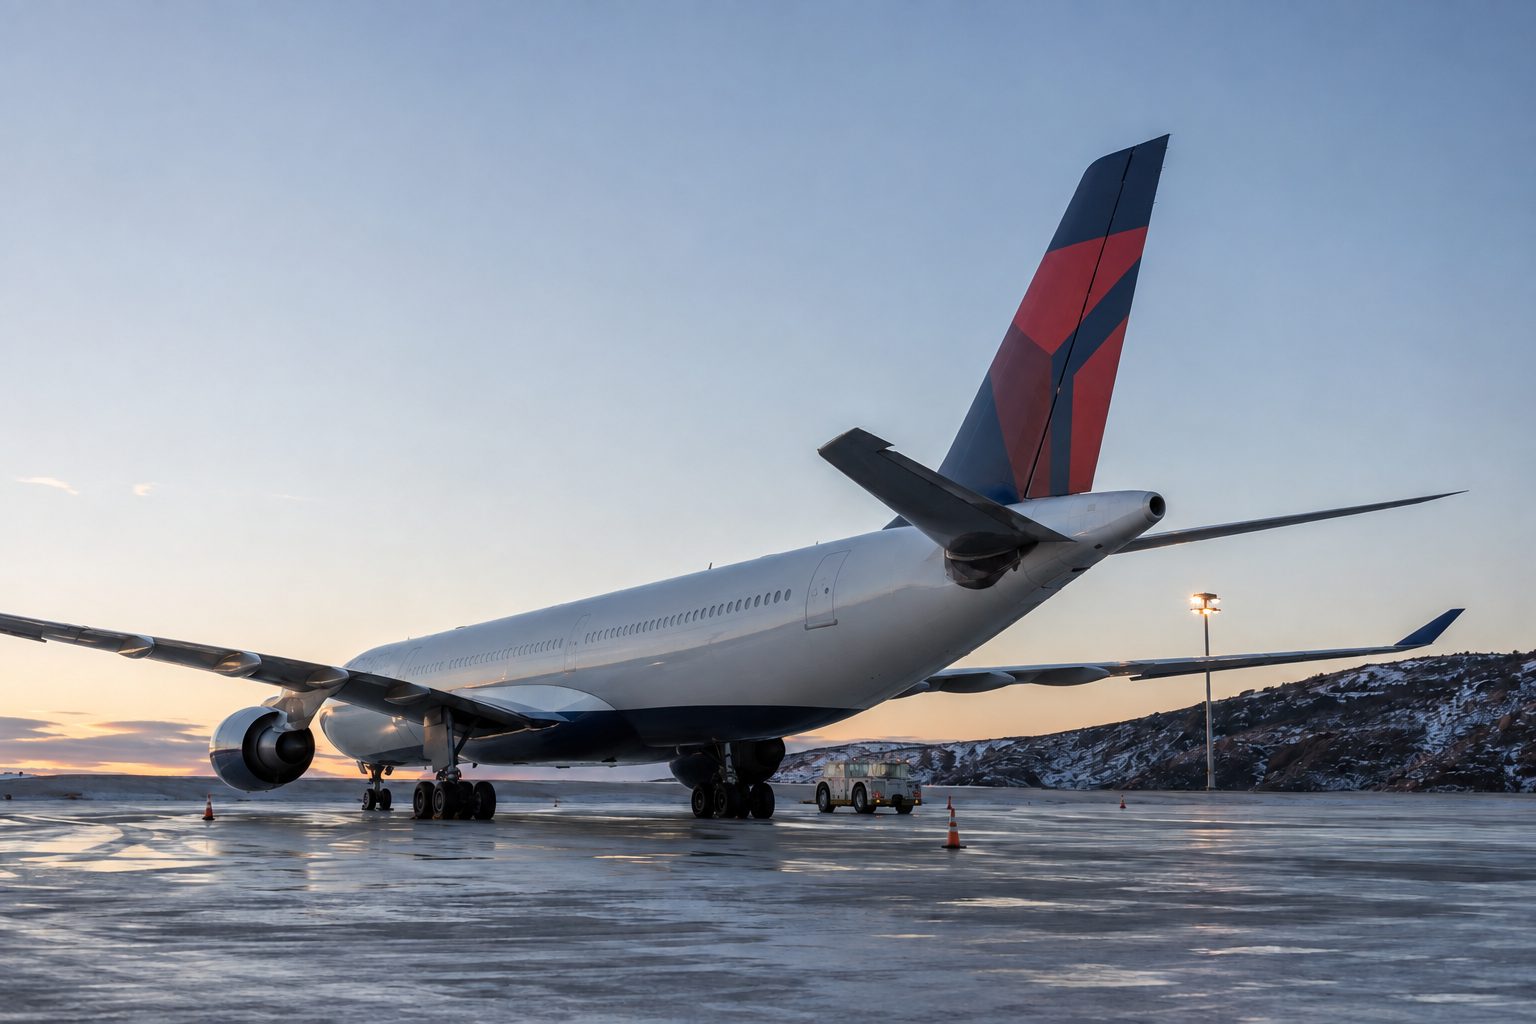
One affected aircraft equals 3.23% of the A330-300 subfleet and 0.10% of Delta’s mainline fleet. A330-300 average age: 16.9 years at Dec. 31, 2025.
| 2Q26 adjusted metric | Result |
|---|---|
| Operating revenue | $17.7B |
| Operating margin | 8.8% |
| EPS | $1.56 |
| FY26 EPS guide | $6.50–$7.50 |
| FY26 FCF guide | $3B–$4B |
| Analyst | Firm | Rating | Target | Date |
|---|---|---|---|---|
| Sheila Kahyaoglu | Jefferies | Buy | $110 | Aug. 21 |
| Christian Wetherbee | Wells Fargo | Buy | $105 | Aug. 20 |
| Jason Sum | DBS | Buy | $110 | Aug. 13 |
| John Godyn | Citi | Buy | $110 | Aug. 7 |
| Catherine O’Brien | Goldman Sachs | Buy | $116 | Aug. 3 |
| DAL | $82.48 | +0.08% |
| UAL | $113.57 | +0.35% |
| LUV | $40.71 | +0.82% |
| JBLU | $4.95 | +1.23% |
Friday Aug. 21 DAL volume: 5.1M shares versus a 6.8M 50-day average.
| Scenario | Likely investor read |
|---|---|
| Single-aircraft repair | Contained cost |
| Short subfleet checks | Schedule friction |
| Engine-wide directive | Material capacity risk |
| No follow-on action | Event fades |
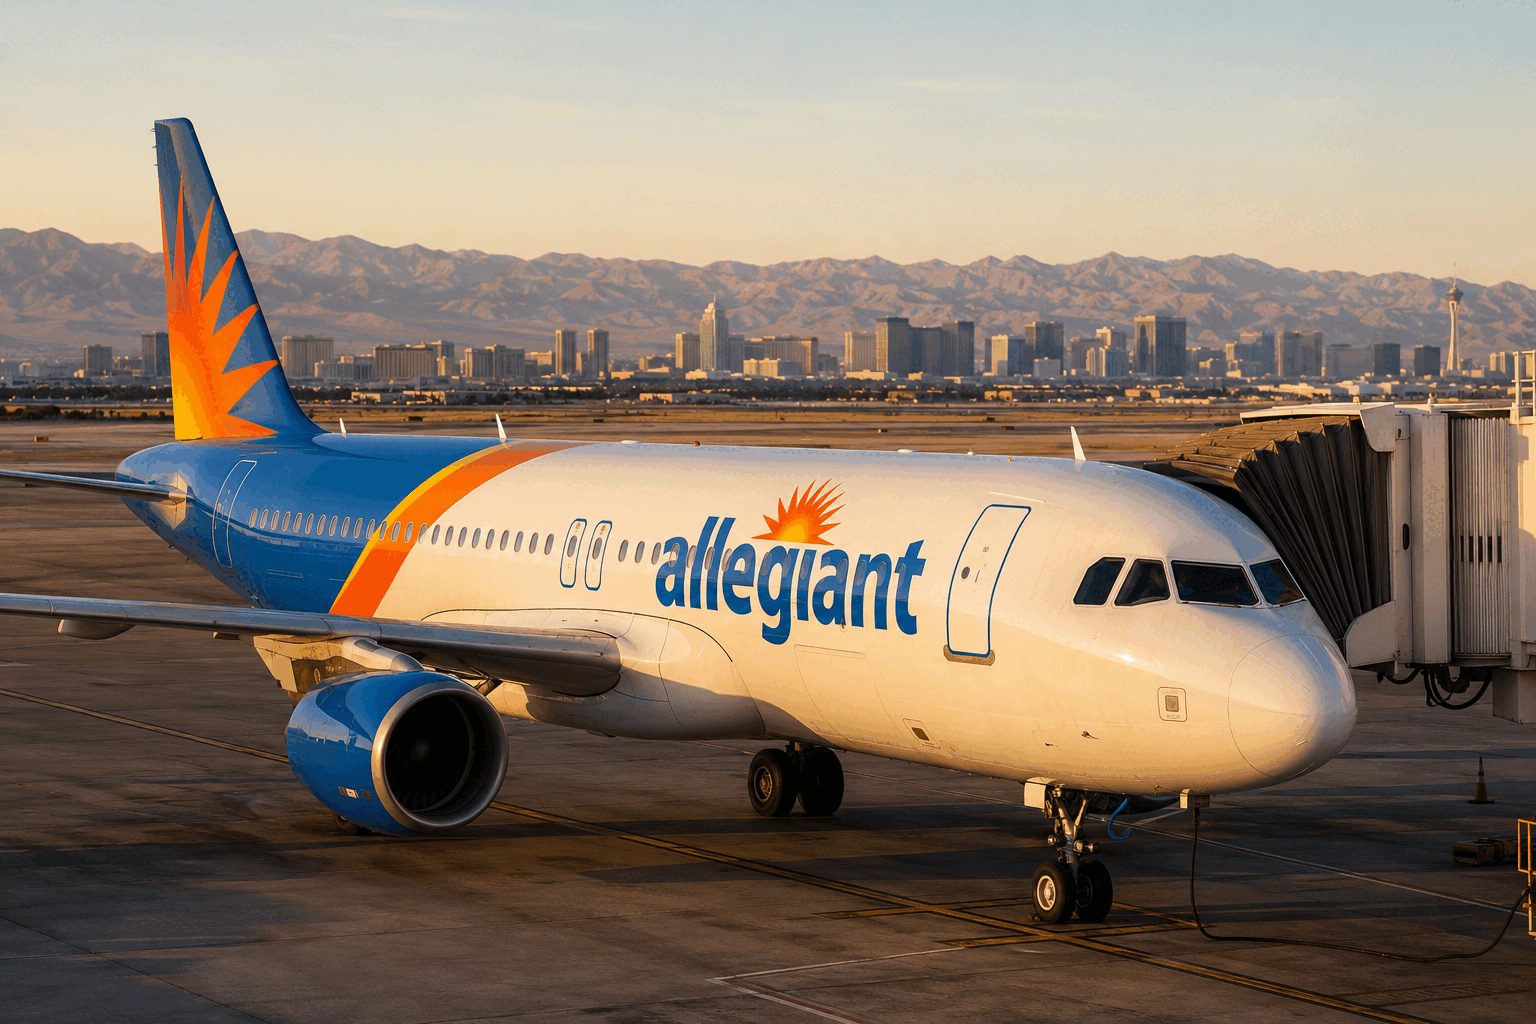
Market data as of August 24, 2026, 11:52 EDT. Operating data covers Allegiant's second quarter of 2026.
Lower flying coincided with stronger unit revenue. Fuel remained the largest pressure point.
Read-through: today's upgrade supports the rebound, but ALGT remains below its 52-week peak. The market is rewarding proof that capacity cuts can lift unit revenue without eroding the network.
Consensus: 8 Buy, 4 Hold, 0 Sell. Targets are not guarantees.
| Action | Markets | Scale |
|---|---|---|
| Pause | FLL–SBY, FLL–AVP, RSW–ALB, MCO–PSM | 7/wk |
| Reduce | FLL–CAK, MCO–MSN, PVU–SNA | −3/wk |
| Defer | CHS–CUN | To Dec. 19 |
The four pauses are a small slice of Breeze's 300-plus route map.
| Signal | What to watch | Investor relevance |
|---|---|---|
| Capacity | Whether targeted reductions persist | Supports fares and unit revenue |
| Fuel | Jet-fuel assumptions for late 2026 | Can overwhelm revenue gains |
| Competition | Breeze overlap across 35 routes | Tests pricing in shared leisure markets |
| Integration | Sun Country synergy delivery | Central to the Raymond James upgrade |
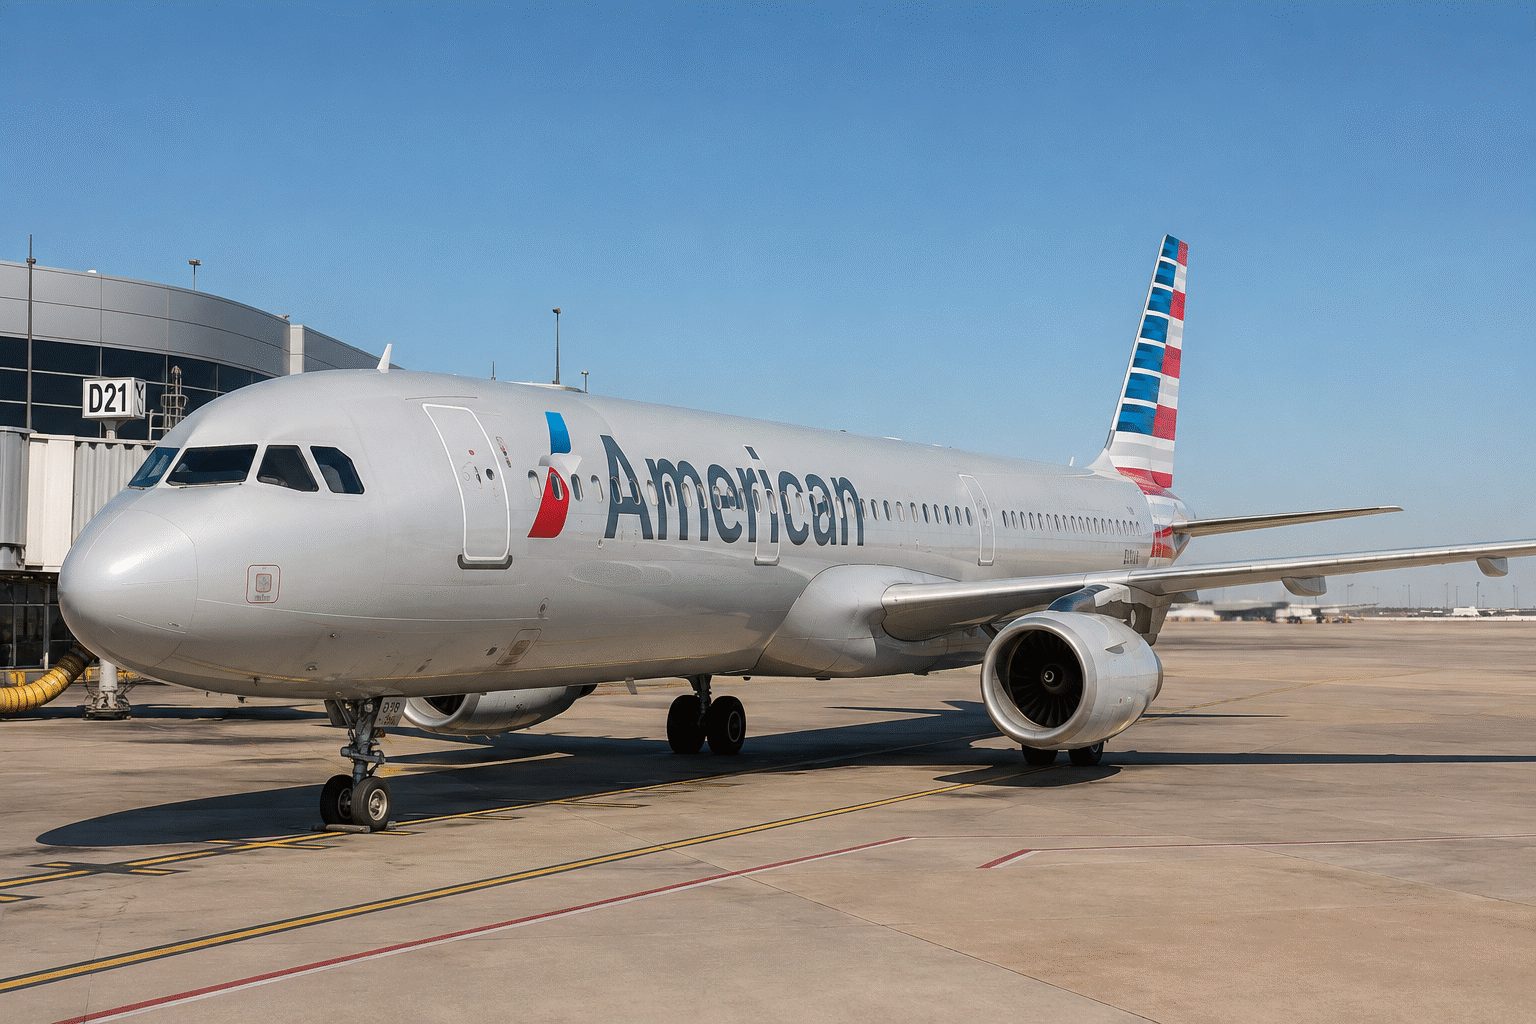
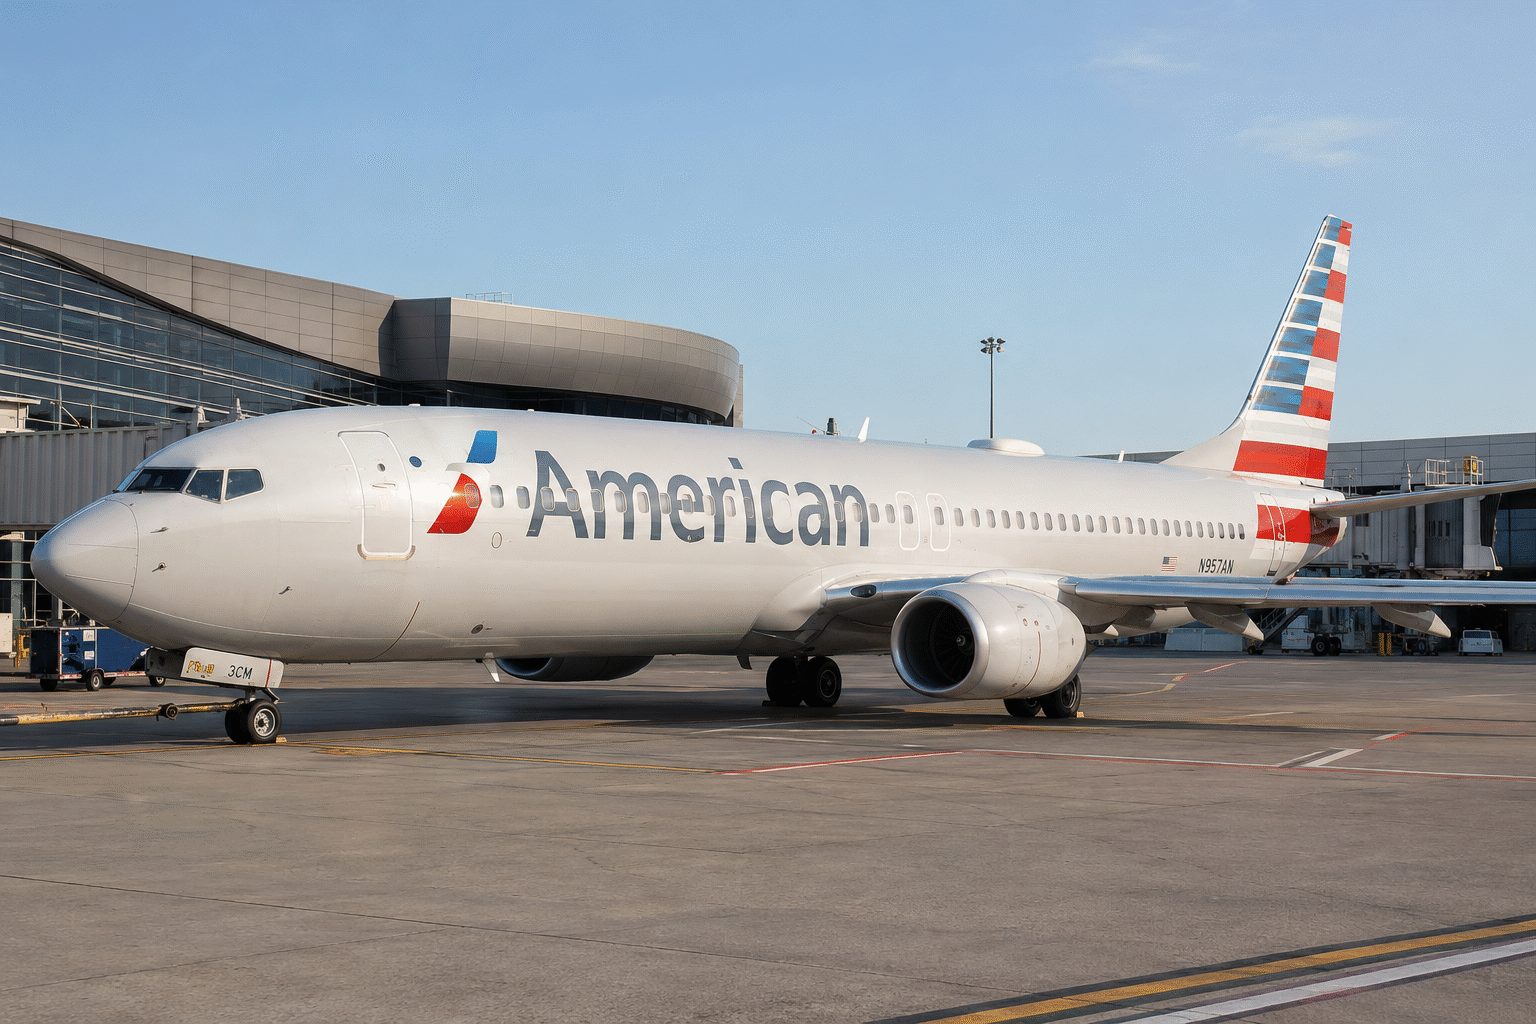
DFW laptop-fire scrutiny meets a tougher margin and fuel-cost setup.
The incident became broadly reported after the close. Monday is the first clean market test.
AAL outperformed the peer set during the week before the fire report, arguing against an incident-driven decline.
The average target implies 37.0% upside. The $10–$25 range shows unusually wide disagreement.
| Measure | Q2 / guide | Read-through |
|---|---|---|
| Revenue | $16.7B | +16.3% YoY |
| GAAP net income | $71M | ~0.4% margin |
| Available liquidity | $11.3B | Operating buffer |
| FY adjusted EPS | −$0.65 to $0.65 | Around break-even |
| Q2 fuel expense | +$2.2B YoY | Core earnings drag |
Flight 2398 landed safely. The pilot's estimate of four to five possible burns remains preliminary; no DFW-wide disruption was reported.
No added injuries or aircraft limits. Investor focus returns to premium revenue and Monday's sector tape.
FAA and American provide routine follow-up. Margins, fuel and the 11.9× valuation remain the bigger variables.
A higher injury count, procedure gaps or claims could add legal cost and prolong safety scrutiny.
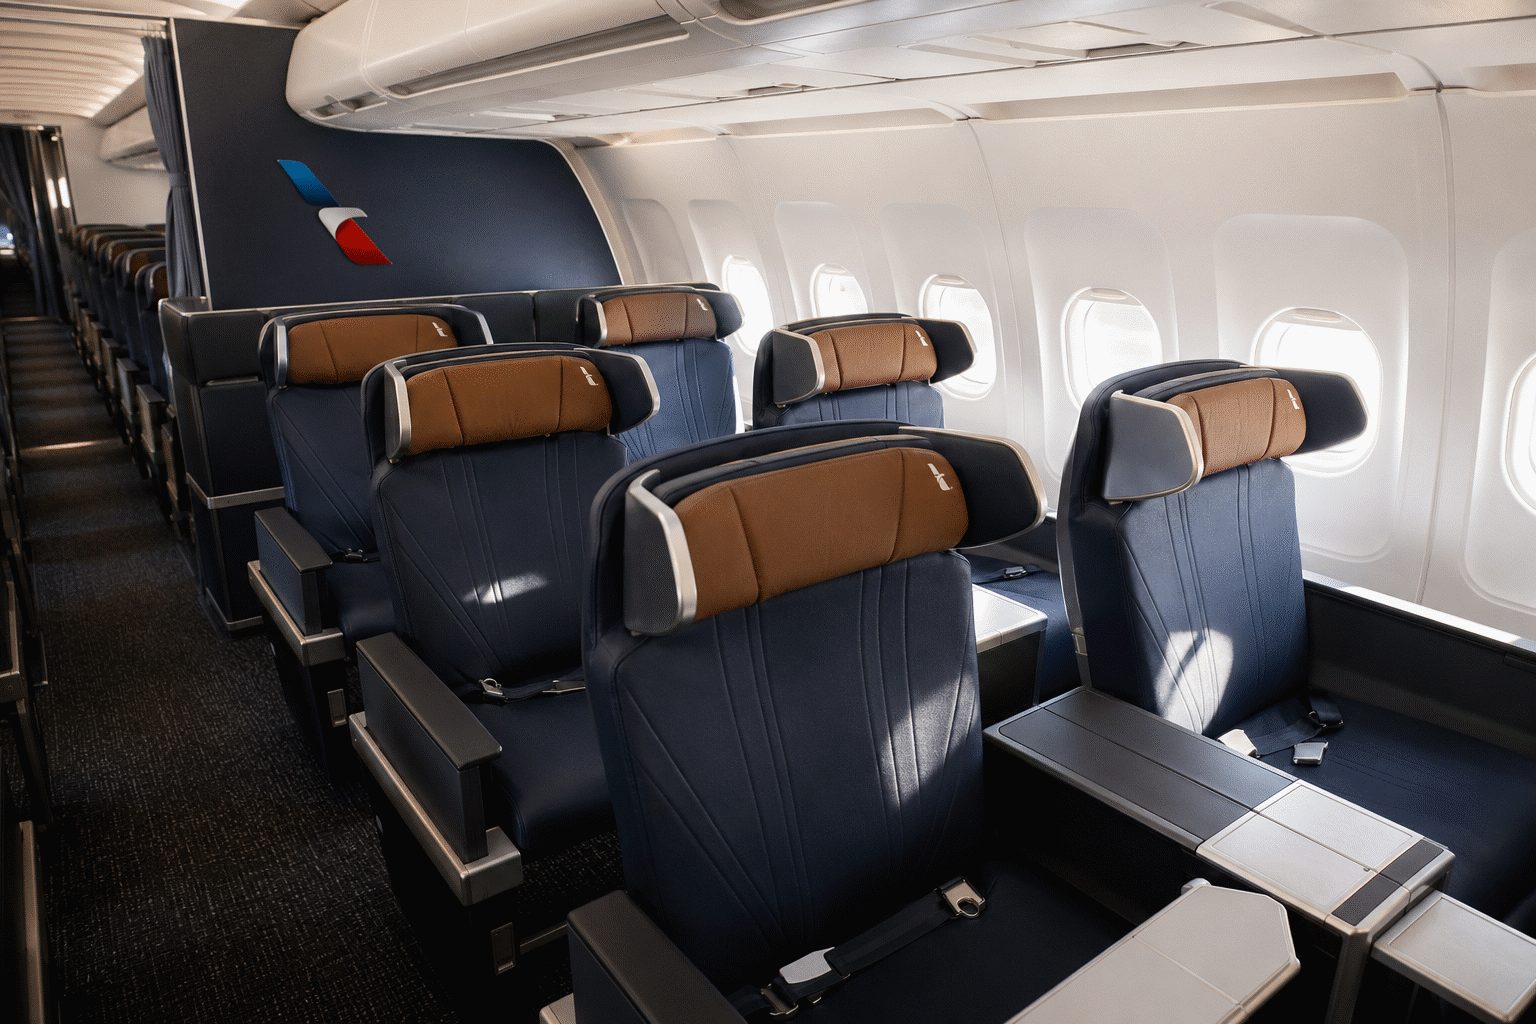
Premium demand is already outgrowing Main Cabin. But fuel expense rose 83% in Q2, and full-year adjusted EPS guidance spans a loss to a profit. The strategy is credible; the earnings bridge is the issue.
AAL trades 12.8% below its 50-day average and 26.9% below its 52-week high.
| Measure | Latest | Read-through |
|---|---|---|
| Revenue | $16.7bn | +16.3% YoY |
| Premium unit revenue | +13.4% | Main Cabin +8.8% |
| Corporate revenue | +26% | 5th double-digit quarter |
| Adjusted net income | $99m | $0.15/share |
| Fuel expense | +$2.2bn | +83% YoY |
| Liquidity | $11.3bn | Investment cushion |
| Bull case | Base case | Bear case |
|---|---|---|
| Premium unit revenue stays above Main Cabin; fuel falls; retrofit cost proves manageable. | Revenue holds, but benefits arrive gradually while EPS remains fuel-sensitive. | Fuel stays elevated, retrofit spending rises and premium demand weakens. |
| Security | Close | Daily move |
|---|---|---|
| American · AAL | $13.52 | -2.45% |
| Delta · DAL | $81.06 | -2.68% |
| United · UAL | $111.71 | -3.52% |
| Southwest · LUV | $39.89 | -3.69% |
| S&P 500 | — | -0.87% |
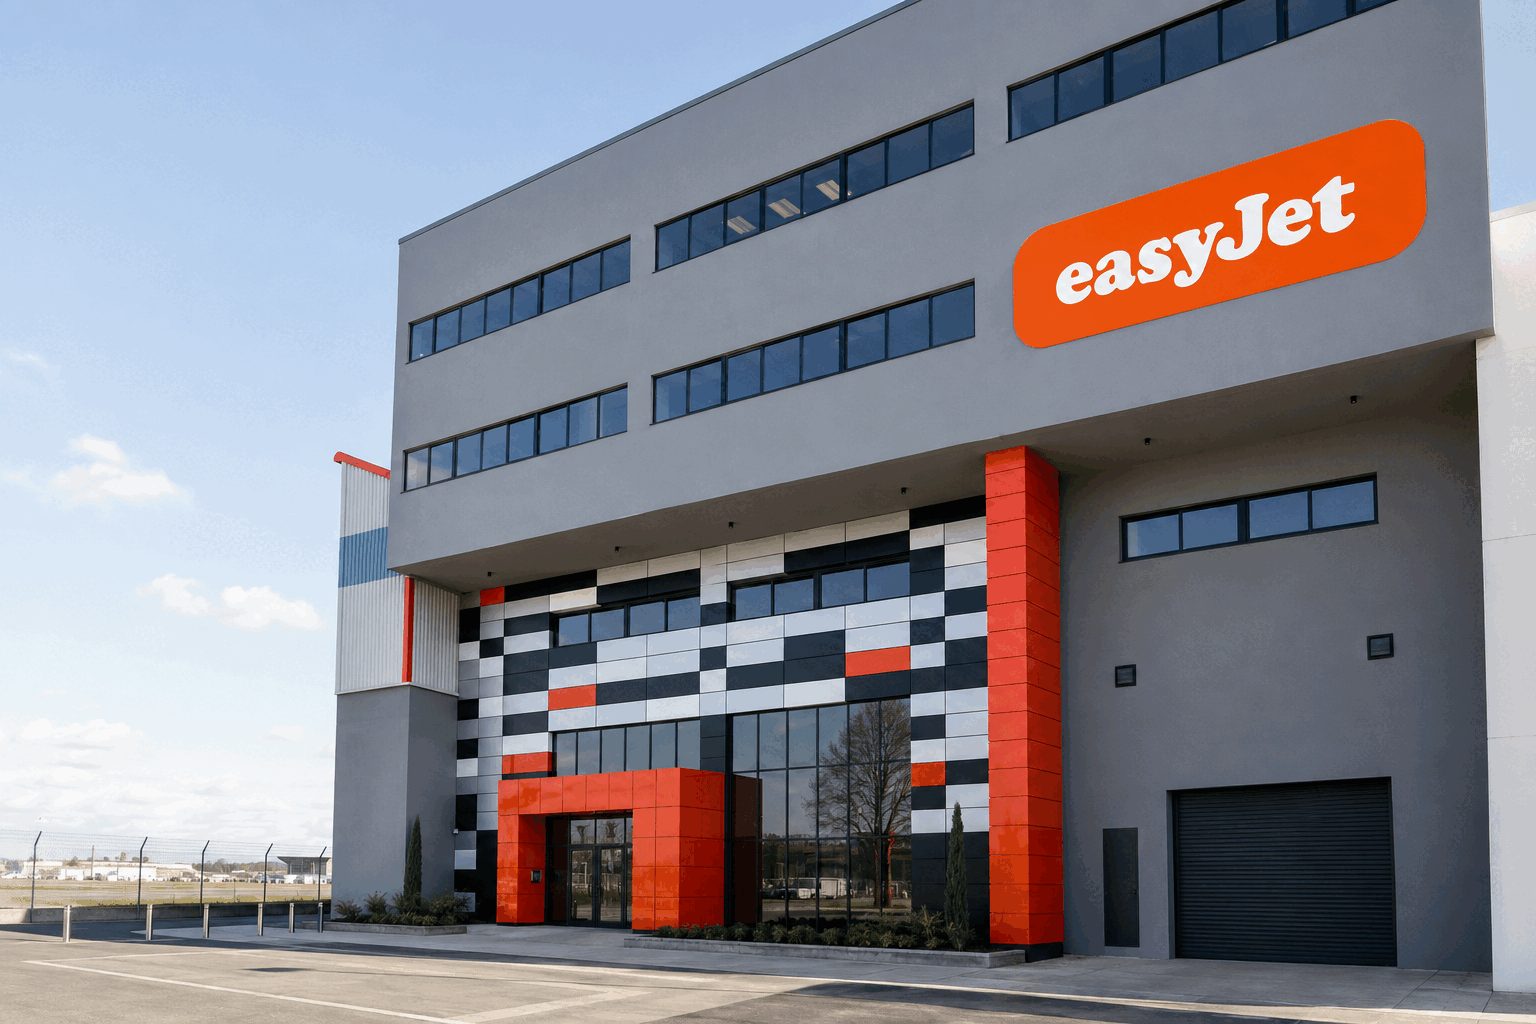
easyJet plc · LON:EZJ · investor snapshot
| Broker | Date | View | Target |
|---|---|---|---|
| JPMorgan | Aug. 7, 2026 | Hold | 715p |
| Morgan Stanley | July 28, 2026 | Hold | 715p |
| UBS | July 27, 2026 | Hold | 635p |
| Citigroup | July 13, 2026 | Hold | 715p |
| Barclays | July 8, 2026 | Buy | 690p |
The route exit is not the main downside. If the Apollo scheme fails, the 81% offer premium can unwind while fuel, load-factor and unit-revenue pressure returns to the centre of the valuation. Watch regulatory approvals, the shareholder vote, late-summer bookings and any wider network pruning.
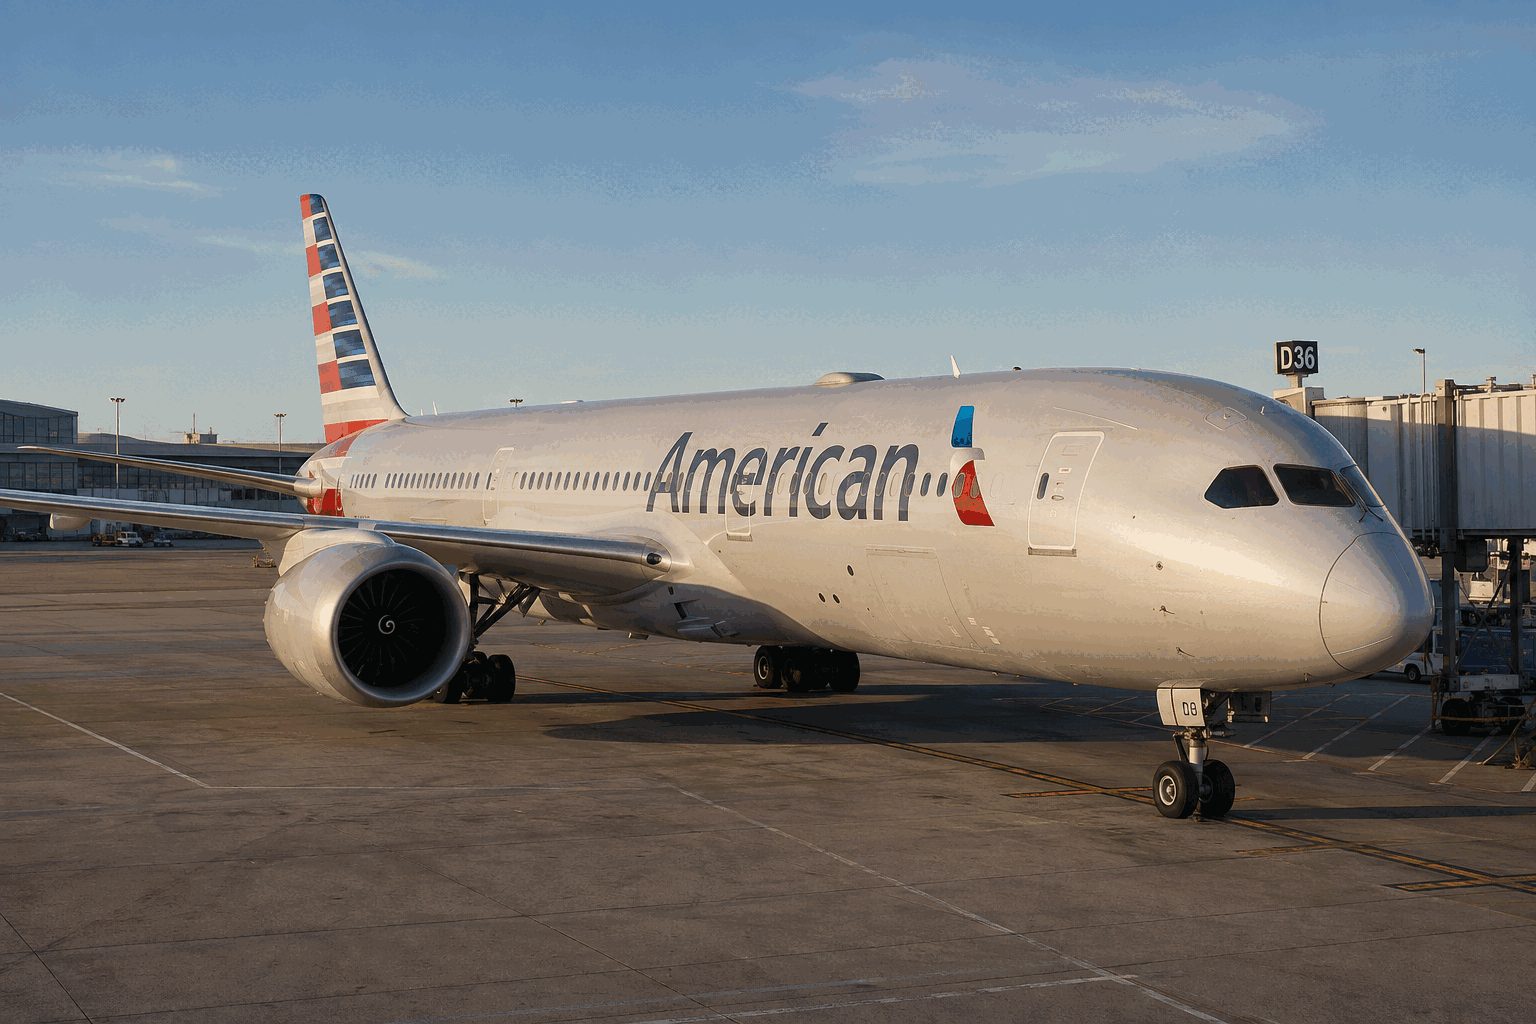
American lost less than its three large U.S. peers, even as volume accelerated.
The upside case is simple: jet fuel stays lower while fares hold. American's unhedged exposure then turns a modest price move into a large pre-tax benefit. The weak point is just as clear. A fare war, fuel reversal or operating disruption can consume that benefit before it reaches earnings.
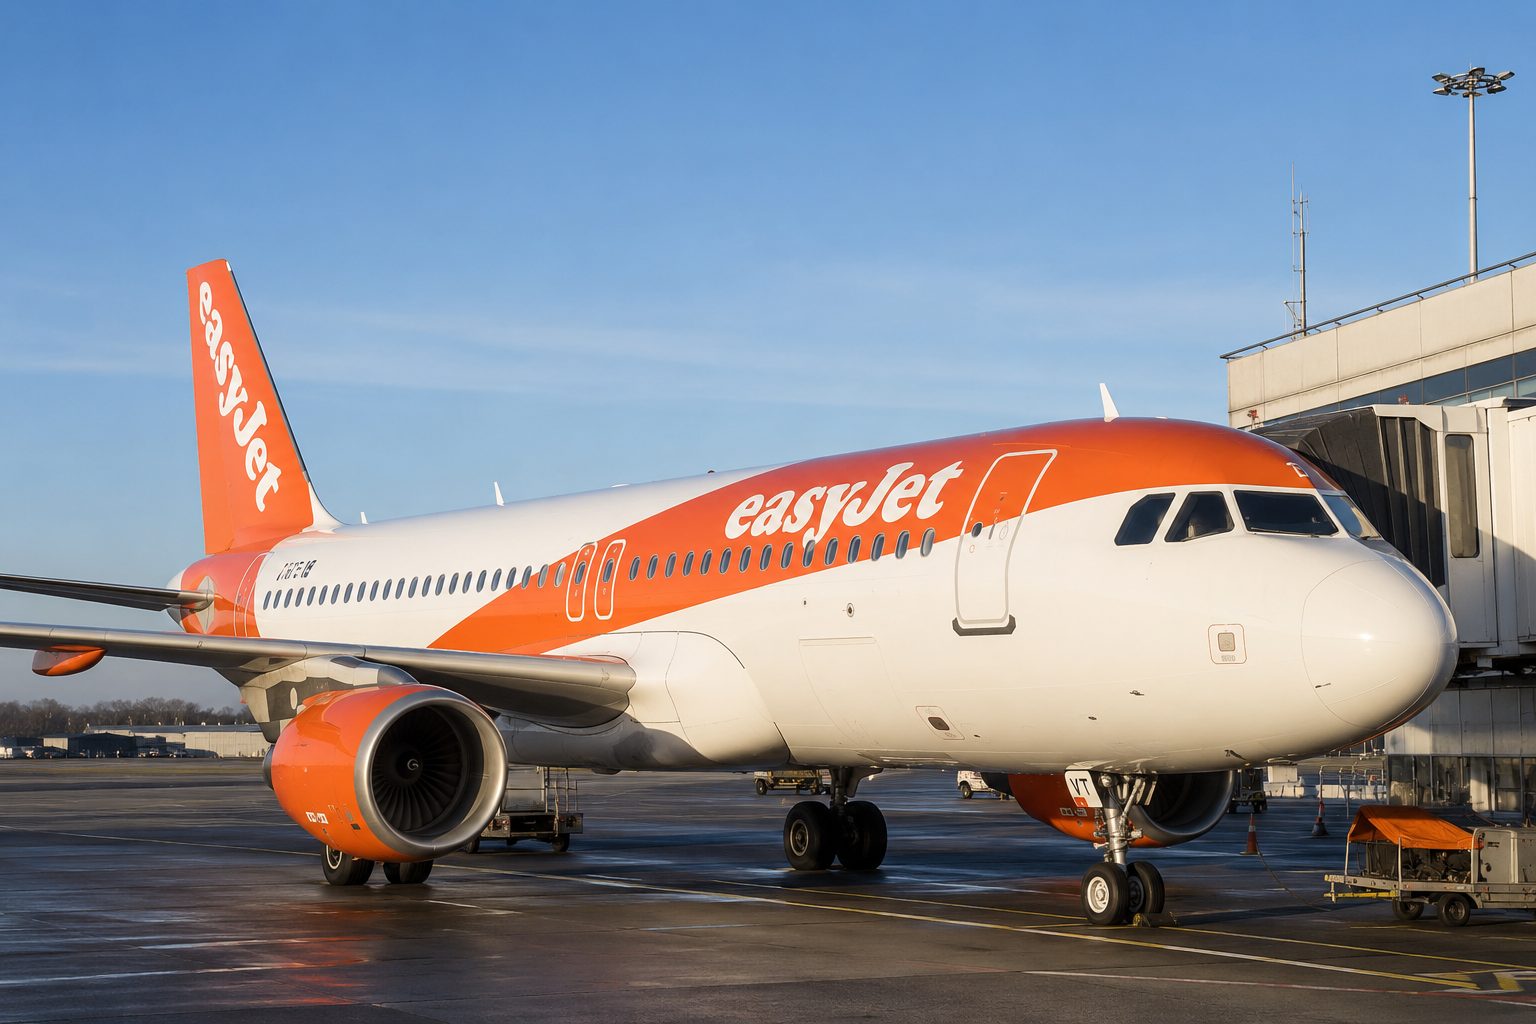
The route news is visible. The valuation question is whether Apollo closes on the stated terms by the end of Q1 2027.
BarcelonaPalmaMalagaParisGenevaBelfast
Investor read: this is network pruning. Reallocated aircraft matter more than the lost local schedule.
| Metric | Q2 2026 | YoY |
|---|---|---|
| Total revenue | $4.1B | +10% |
| RASM | 16.72¢ | +8.6% |
| Non-fuel unit cost | 11.40¢ | +6.5% |
| Fuel / gallon | $4.43 | +85.4% |
| Adjusted net result | −$102M | Loss |
| View | Count | Range / marker |
|---|---|---|
| Buy | 8 | High target $25 |
| Hold | 6 | BofA $17 · Aug. 17 |
| Sell | 1 | Low target $13 |
| Average | 15 analysts | $19.36 |