

NEW YORK, August 1, 2026, 16:01 EDT
Shares of American Airlines Group Inc. NASDAQ:AAL rose 5.5% over the past week. However, the airline generated just 10% of Delta Air Lines Inc.’s NYSE:DAL adjusted net income, despite achieving 95% of Delta’s revenue.
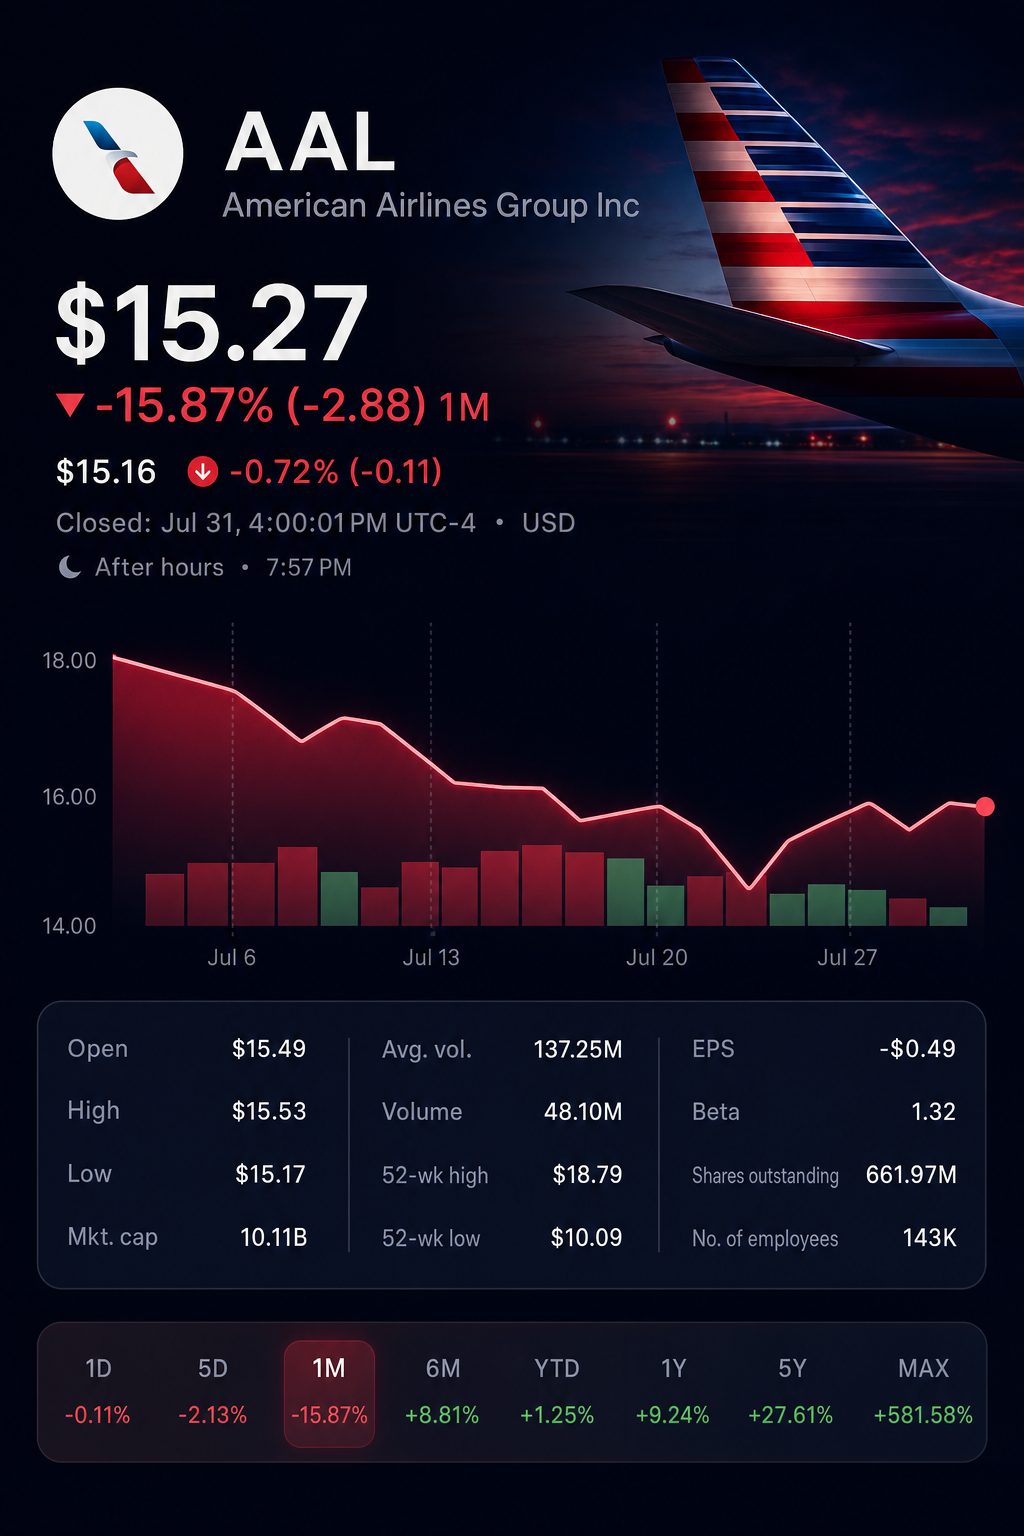
The difference is significant. American projects a third-quarter loss, whereas United Airlines Holdings Inc. NASDAQ:UAL and Delta expect to report profits.
| Company | July 31 close | Friday move | Weekly move |
|---|---|---|---|
| American Airlines NASDAQ:AAL | $15.27 | down 1.0% | up 5.5% |
| Delta Air Lines NYSE:DAL | $87.44 | down 1.3% | up 2.8% |
| United Airlines NASDAQ:UAL | $121.33 | down 1.8% | up 2.6% |
Change in closing price between July 24 and July 31.
Friday saw a decline for American, which slipped 1.0%, even as the S&P 500 advanced 0.7%. Despite this, the main index ended the week up roughly 1%. U.S. markets did not open Saturday.
Profit conversion reveals pressure. American kept around 59 cents of adjusted net income for every $100 in revenue. Delta held onto $5.81, while United kept $3.67.
| Second-quarter adjusted results | American | Delta | United |
|---|---|---|---|
| Revenue | $16.74 billion | $17.67 billion | $17.67 billion |
| Pretax income | $144 million | $1.36 billion | $843 million |
| Pretax margin | 0.9% | 7.7% | 4.8% |
| Net income | $99 million | $1.03 billion | $649 million |
| Net income per $100 revenue | $0.59 | $5.81 | $3.67 |
Numbers do not include special items, if disclosed by the carriers.
CEO Robert Isom said, “American delivered year-over-year revenue growth of more than 16%,” as the company reported results. Managed corporate revenue increased by 26%, while premium passenger unit revenue was up 13.4%. American Airlines Newsroom
Most of the gains were offset by fuel expenses. Costs climbed by $2.2 billion, up 83%. That rise was close to 22 times the adjusted net profit. “Obviously not 100%” recovered, finance chief Devon May told Reuters as fuel estimates increased once more. American Airlines Newsroom
American continues to project third-quarter revenue to rise between 16% and 19%. Its initial adjusted earnings outlook remains at a loss in the range of 70 cents to 10 cents per share. Rival outlooks are optimistic.
| Preliminary company guidance | American | Delta | United |
|---|---|---|---|
| Third-quarter adjusted EPS | -$0.70 to -$0.10 | $2.00 to $2.50 | $2.50 to $3.50 |
| Full-year adjusted EPS | -$0.65 to $0.65 | $6.50 to $7.50 | $9.00 to $11.00 |
| Third-quarter fuel assumption | Roughly $3.75 | Approximately $3.15 | Nearly $3.69 |
Guidance is provided on a non-GAAP basis where indicated. Projections reflect the fuel curve and operational assumptions unique to each carrier.
The rise over the week may indicate expectations for future fare improvement. However, this does not resolve the present earnings shortfall. American’s midpoint projection signals adjusted earnings around break-even for the full year.
Operational risk emerged again last week. A nationwide ground stop on Tuesday continued for 48 minutes. According to FlightAware, roughly 1,100 flights were delayed and 221 were cancelled that day. Shares still ended higher for the week.
On Friday evening, corporate controller Angela Owens disclosed the sale of 40,077 American shares at a weighted average price of $15.2612. Following the transaction, Owens held 178,799 shares, a regulatory filing showed.
Focus turns to economic releases next week. July’s manufacturing data will be published on Monday, with petroleum stockpile numbers following on Wednesday and employment statistics due Friday. The oil inventories update will provide the clearest immediate insight for airline fuel expenses.
Risks: Another surge in fuel costs, weaker bookings or a system outage could rapidly increase losses. American’s slim margin offers less buffer for mistakes compared to larger network rivals.
Demand is not the pressing issue. Investors are seeking proof that record revenues will translate to profits.
Related articles: NASDAQ:AAL














![Australia Stock Market Today 08.22.2026 [UPDATE: 08.22.2026 08:37 AEST] [Weekly Recap and Week Ahead: Healthcare Leads, CPI Looms]](https://ts2.tech/wp-content/uploads/2026/08/AU-market-dashboard-2026-08-22-0837-480x384.jpg "Australia Stock Market Today 08.22.2026 [UPDATE: 08.22.2026 08:37 AEST] [Weekly Recap and Week Ahead: Healthcare Leads, CPI Looms]")