
NEW YORK, August 6, 2026, 14:10 EDT — U.S. markets are now open.
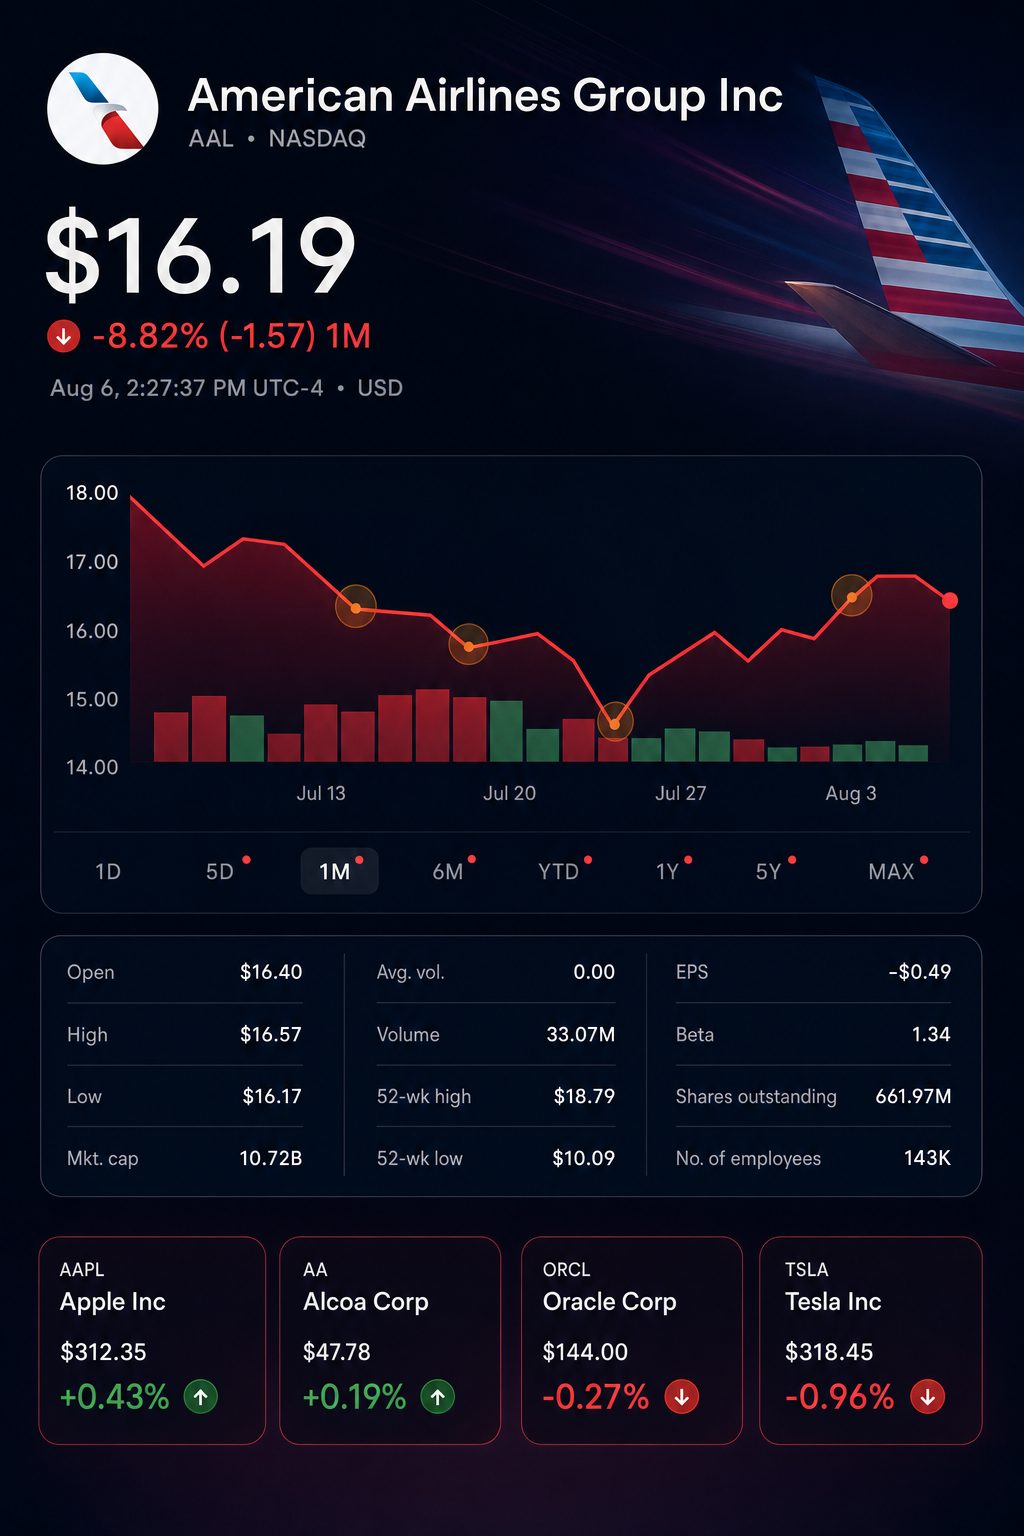
- American shares were last at $16.24, slipping 2.1%. Figures for the session are not final.
- A repeated $17 price target suggested a potential upside of just 4.7%.
- The rise in fuel costs for Q2 accounted for 94.7% of the increase in revenue.
American Airlines Group NASDAQ:AAL dropped 2.1% to $16.24 on Thursday. Wells Fargo NYSE:WFC maintained its $17 price target, suggesting a 4.7% potential gain. The share price was provisional and reflected intra-session trading.
The small range in targets is significant as fuel costs accounted for nearly all additional revenue. In Q2, fuel expenses climbed by $2.218 billion from a year earlier, compared to a $2.343 billion uptick in revenue. That means the rise in fuel accounted for 94.7% of the total revenue increase.
Despite reaching record sales, earnings protection remained limited. Net income declined by 88.2% to $71 million. Adjusted pretax margin decreased significantly to approximately 0.9%, compared to 6.0%.
| American’s Q2 fuel calculation | Q2 2026 | Q2 2025 | Change |
|---|---|---|---|
| Operating revenue | $16.735 bln | $14.392 bln | +16.3% |
| Fuel costs | $4.881 bln | $2.663 bln | +83.3% |
| Fuel cost as portion of revenue | 29.2% | 18.5% | +10.7 pts |
| Adjusted margin before taxes | 0.9% | 6.0% | -5.1 pts |
| Net profit | $71 mln | $599 mln | -88.2% |
Figures calculated by reporters using unaudited data from the company.
The wider airline sector was also under pressure. Delta Air Lines NYSE:DAL outperformed among major peers, while Southwest Airlines NYSE:LUV posted the steepest loss.
| Selected airline comparison | Price | Intraday move |
|---|---|---|
| American Airlines Group NASDAQ:AAL | $16.24 | -2.1% |
| Delta Air Lines NYSE:DAL | $93.00 | -0.2% |
| United Airlines Holdings NASDAQ:UAL | $130.85 | -1.4% |
| Southwest Airlines NYSE:LUV | $47.38 | -2.9% |
| U.S. Global Jets ETF NYSEARCA:JETS | $32.89 | -1.9% |
Most recent quotes were taken at approximately 13:55 EDT. Figures are early estimates and have been rounded.
Energy markets provided investors with new grounds for caution. Brent climbed $3.09, reaching $82.54 by 12:37 p.m. EDT. U.S. crude added $2.49 to trade at $77.71. An Iranian committee was considering proposals on Hormuz shipping limits.
The most recent Gulf Coast jet-fuel spot price was $3.506 per gallon on August 3, 6.5% under American’s $3.75 planning assumption for Q3. The two numbers are not directly equivalent: one represents a spot market daily benchmark, the other is a quarterly projection by the company.
Christian Wetherbee of Wells Fargo kept a Hold rating on Thursday, setting his price target at $17, which is under the group’s $19.79 average. Out of 14 analysts, eight maintained a Buy on AAL, five opted for Hold, and one gave a Sell recommendation.
| Selected analyst recommendations | Analyst | Rating | Target | Move from $16.24 |
|---|---|---|---|---|
| Wells Fargo NYSE:WFC | Christian Wetherbee | Hold | $17 | +4.7% |
| UBS Group NYSE:UBS | Atul Maheswari | Buy | $18 | +10.8% |
| Goldman Sachs Group NYSE:GS | Catherine O’Brien | Sell | $13 | -20.0% |
| Jefferies Financial Group NYSE:JEF | Sheila Kahyaoglu | Hold | $15 | -7.6% |
| Morgan Stanley NYSE:MS | Ravi Shanker | Buy | $24 | +47.8% |
Calculations by reporter. Recommendations span from July 24 to August 6.
American relied on about 662 million diluted shares in the second quarter. The $17 price objective thus translates to an implied equity value increase of around $503 million. American notes that every one-cent rise in fuel costs results in an additional $46 million in yearly expenses. An 11-cent shift produces a similar effect in dollar terms. This analysis reflects sensitivity, not a valuation methodology.
The outlook for earnings is still uncertain. American projects full-year adjusted EPS between a 65-cent loss and a 65-cent gain, revised from its earlier guidance of a 40-cent loss up to $1.10 profit. For the third quarter, the airline expects to report another adjusted loss.
| Earnings and fuel estimates | Current company view | Prior or external reference |
|---|---|---|
| Full-year adjusted EPS | $(0.65) to $0.65 | Prior: $(0.40) to $1.10 |
| Full-year midpoint | $0.00 | Prior: $0.35 |
| Q3 adjusted EPS | $(0.70) to $(0.10) | Analyst consensus: $0.28 |
| Q3 revenue growth | 16%–19% | — |
| Q3 average fuel price | Approximately $3.75/gallon | August 3 spot: $3.506/gallon |
Company guidance and analyst consensus refer to projected figures, not actual results. The spot benchmark is different from a company’s quarterly average fuel cost.
Devon May, Chief Financial Officer, informed Reuters that the fuel recovery rate was “obviously not 100%.” The airline’s projections for fuel expenses for the remainder of 2026 have climbed by almost $1.6 billion since early July. Reuters
Corporate updates on Thursday introduced a sustainable fuel alternative. Infinium reported that American assigned eSAF to power a passenger flight from Corpus Christi to Dallas/Fort Worth. The mixed fuel complied with Jet A standards. According to Infinium, this marked the initial U.S. commercial-airport supply of SAF produced without biobased feedstocks.
Project Roadrunner is projected to generate over 5 million gallons each year starting from 2027. American has secured an offtake agreement, though the specifics regarding quantity and pricing have not been revealed. The mentioned output accounts for roughly 0.005% of the approximately 100 billion gallons consumed worldwide each year.
Chief Executive Robert Isom stated, “Scaling SAF production at lower prices is essential.” Investors are still missing two crucial details: the contracted volume and price for American. PR Newswire
Risks: A broader disruption in Hormuz could drive jet fuel prices higher ahead of fare increases. Weaker demand may hinder American’s ability to offset costs. The economics of eSAF are still unclear before volume and pricing details emerge.
For now, the immediate challenge is more straightforward. American is required to convert 16%–19% revenue growth in the third quarter into higher margins. A minor shift in fuel prices could quickly diminish the stock’s perceived gains.
Related articles: NASDAQ:AAL