
NEW YORK, August 3, 2026, 15:08 EDT — U.S. equities kick off trading.
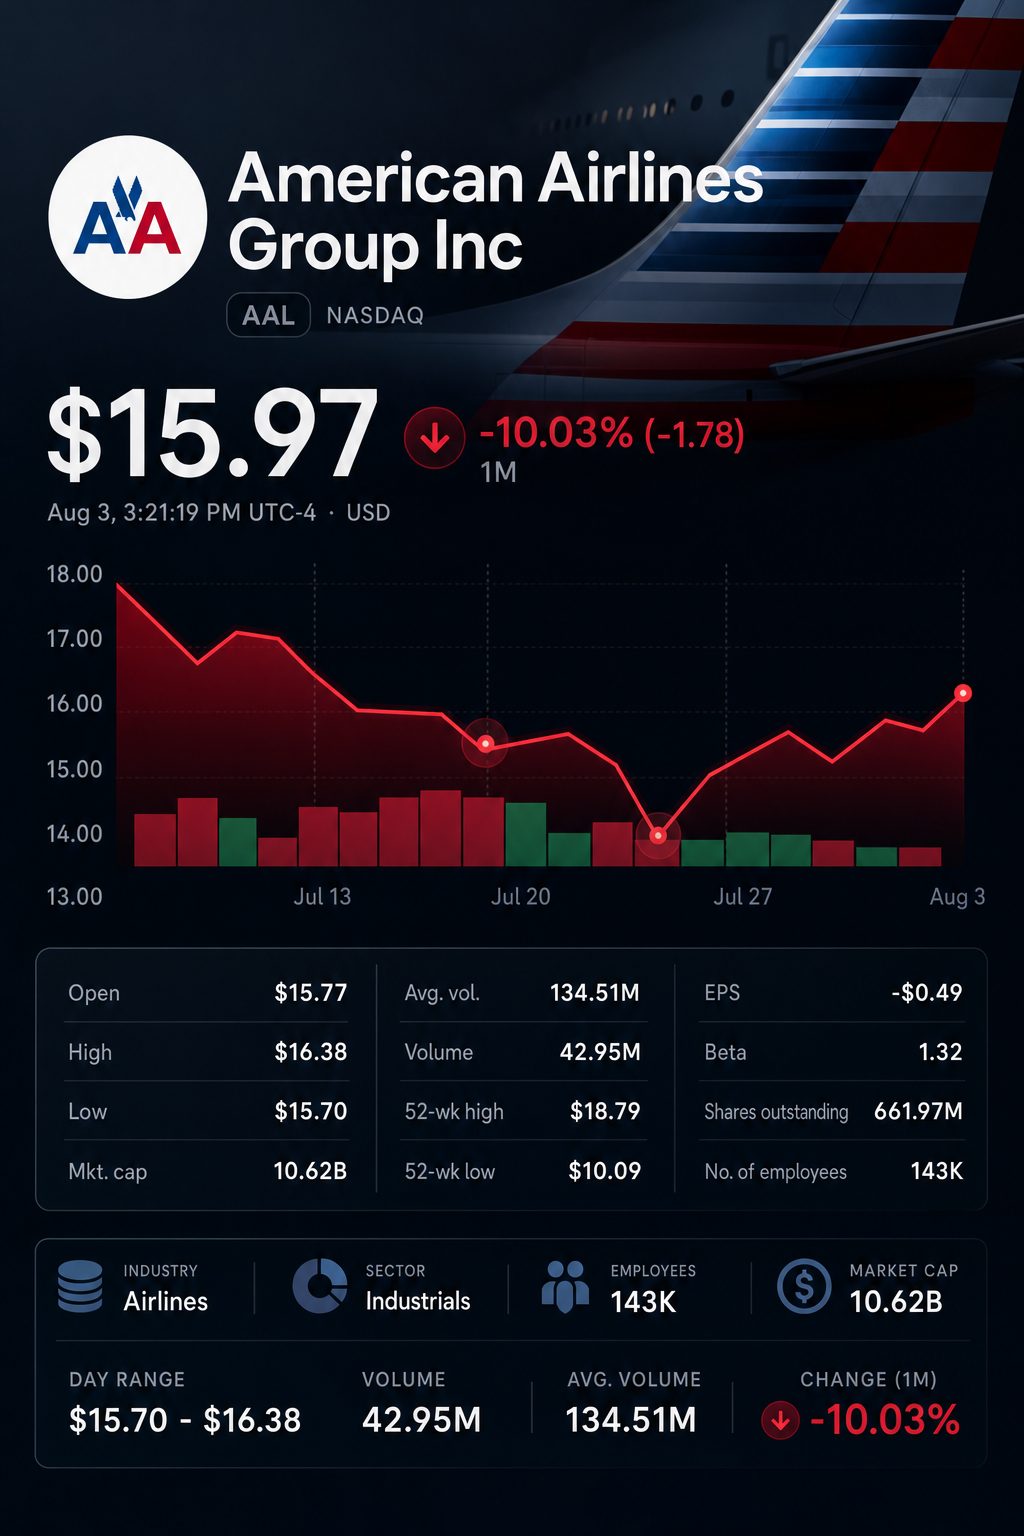
- American shares climbed 4.7% to $15.99 in after-hours trading. Brent crude declined 4.8%.
- An initial estimate shows Monday’s equity value increased by roughly $477 million.
- American posted an adjusted margin of 2.7% for the second quarter, still trailing key rivals.
Shares in America increased by 4.7% to $15.99 in late Monday trading. The surge came after crude prices dropped significantly. Brent was at $83.74 as of 12:40 p.m. ET. Washington canceled a scheduled strike on Iran.
This is significant as American has the narrowest profit margin among its peers. A decrease in fuel costs can swiftly boost its earnings prospects. However, the margin difference remains.
Intraday delayed prices indicated gains across the entire airline group.
| Carrier | Price | Day change | Intraday high | Market value |
|---|---|---|---|---|
| American Airlines Group Inc. NASDAQ:AAL | $15.99 | up 4.7% | $16.38 | $10.6 billion |
| Delta Air Lines Inc. NYSE:DAL | $91.29 | up 4.4% | $91.92 | $60.0 billion |
| United Airlines Holdings Inc. NASDAQ:UAL | $128.07 | up 5.6% | $130.13 | $41.6 billion |
| Southwest Airlines Co. NYSE:LUV | $46.70 | up 3.8% | $47.32 | $23.0 billion |
Using June shares as a basis, American’s increase in equity value is estimated at nearly $477 million in an initial calculation. The company notes that a one-cent rise in fuel costs leads to an added $46 million in yearly expenses. Monday’s gain amounts to about 10.4 cents of that fuel impact for comparison. This is not a prediction of fuel prices.
The stock’s exposure to oil is evident in the arithmetic from the second quarter. Revenue climbed $2.343 billion year-on-year, while fuel costs also rose, by $2.218 billion. Despite the higher revenue, operating income dropped 61%.
| American’s Q2 earnings | 2026 | 2025 | Difference |
|---|---|---|---|
| Operating revenue | $16.735 billion | $14.392 billion | +16.3% |
| Fuel expense | $4.881 billion | $2.663 billion | +83.3% |
| Operating income | $446 million | $1.135 billion | -60.7% |
| Adjusted operating margin | 2.7% | 8.2% | -5.5 points |
American’s adjusted margin came in under a third of Delta’s, and it lagged behind United and Southwest as well, even with record quarterly revenue.
| Q2 comparison | Adjusted operating margin | Adjusted EPS | Disclosed fuel price |
|---|---|---|---|
| American | 2.7% | $0.15 | $4.05 per gallon |
| Delta | 8.8% | $1.56 | $3.93 per gallon |
| United | 5.4% | $1.99 | $4.19 per gallon |
| Southwest | 6.7% | $0.94 | $3.92 per gallon |
Definitions of fuel prices may vary by airline.
Devon May, Chief Financial Officer, stated the limitation clearly. “The current fuel curve has dampened our near-term expectations,” he said. He continues to anticipate margin growth when fuel prices return to typical levels.
Commercial trends continue to hold steady. Managed corporate revenue climbed 26%. Premium passenger unit revenue advanced 13.4%. AAdvantage enrollments expanded by over 30%, and card spending went up 8%.
The gap widens in corporate outlooks. American stands alone in projecting an adjusted loss for the third quarter. Its full-year guidance suggests a midpoint at break-even.
| Company guidance | Q3 adjusted EPS | FY 2026 adjusted EPS | Q3 fuel assumption |
|---|---|---|---|
| American | Negative $0.70 to negative $0.10 | EPS between negative $0.65 and positive $0.65 | Near $3.75 |
| Delta | $2.00 to $2.50 | $6.50 to $7.50 | Near $3.15 |
| United | $2.50 to $3.50 | $9.00 to $11.00 | Approximately $3.69 |
| Southwest | $0.50 to $0.75 | $3.25 to $4.25 | $3.70 to $3.75 |
The fuel assumptions are based on previous forward curves and do not reflect the complete drop in oil prices seen on Monday.
American maintains its forecast for third-quarter revenue, anticipating growth of 16% to 19%. Capacity is projected to increase between 3% and 5%. The midpoint figure is two percentage points under the initial forecast due to higher fuel expenses.
The airline reported available liquidity of $11.3 billion at the end of June. Management, at its guidance midpoint, anticipates positive free cash flow, along with a reduced net debt by year-end.
Risks: Oil prices may recover should tensions rise once more in the Middle East. Increasing fares might reduce demand. Additional cuts to capacity may push unit costs up, while significant debt restricts financial flexibility.
Monday’s surge reflects more affordable input costs, rather than restored margins. For a sustained rerating, American will likely need to translate revenue gains into profits comparable with its peers.
Related articles: NASDAQ:AAL