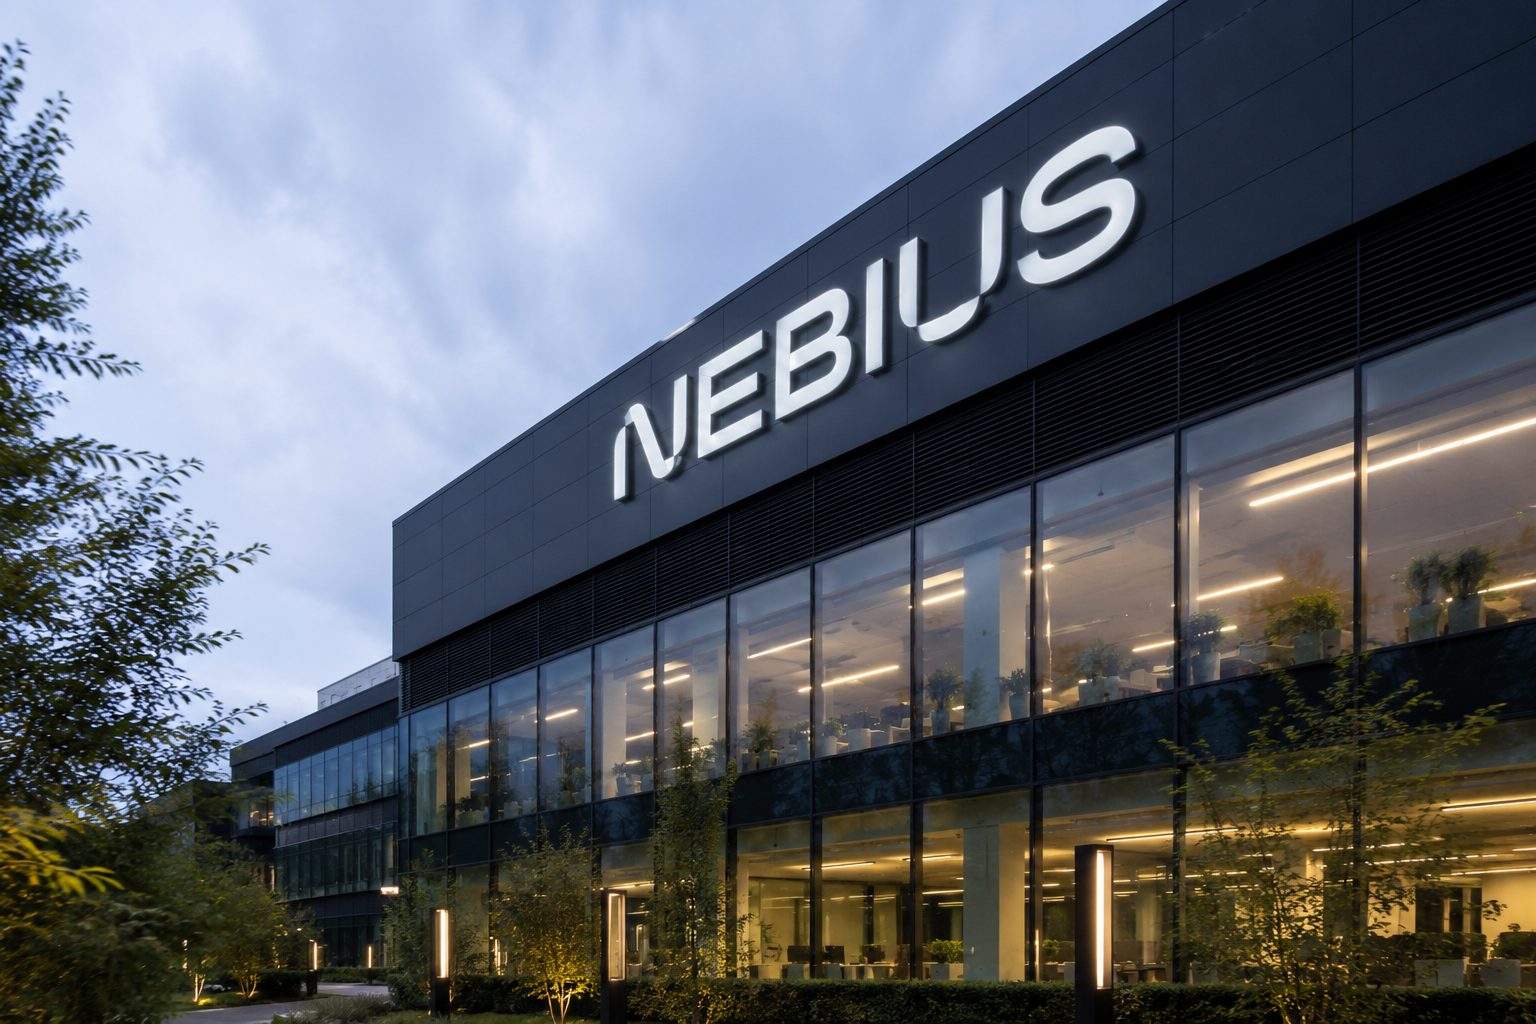

NEW YORK, August 3, 2026, 14:11 EDT
Nebius Group N.V. NASDAQ:NBIS rose 15.9% to $220.71 at last report in Monday afternoon dealings. The increase boosted its basic market value by roughly $7.7 billion, based on the March 31 share total.
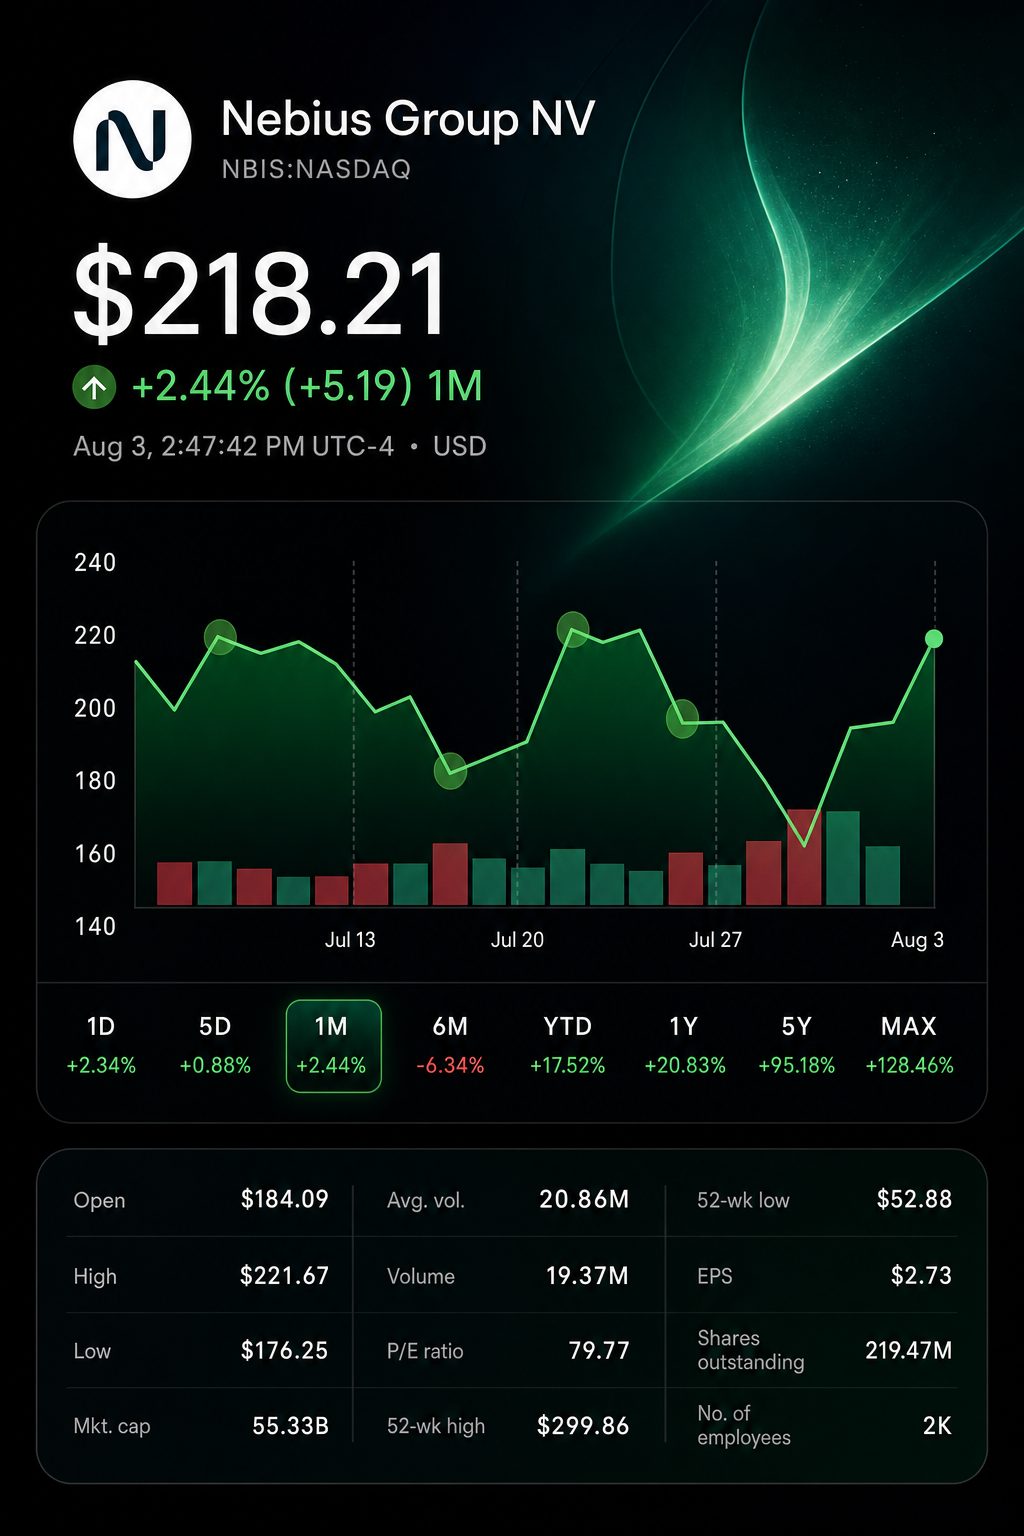
The rally was not driven by new operational developments. The most recent newsroom update from Nebius was a sustainability report released on July 30. Shares of comparable AI-infrastructure firms also experienced significant gains, pointing to a recovery across the sector.
Real-time AI Infrastructure Comparison
| Company | Price | Day move | Intraday range | Equity value |
|---|---|---|---|---|
| Nebius Group N.V. NASDAQ:NBIS | $220.71 | up 15.9% | $176.78–$220.85 | $56.0 billion |
| CoreWeave Inc. NASDAQ:CRWV | $83.81 | up 16.8% | $70.00–$84.36 | $44.2 billion |
| IREN Ltd. NASDAQ:IREN | $39.90 | up 8.4% | $35.54–$39.97 | $13.3 billion |
| Core Scientific Inc. NASDAQ:CORZ | $22.83 | up 10.2% | $19.92–$22.83 | $7.4 billion |
Delayed prices reflect data as of 13:56 EDT. Nebius’s initial valuation is based on 253.9 million shares outstanding as of March 31. Peer valuations utilize real-time provider data.
Nebius and CoreWeave were singled out by Reuters as top AI-related performers in the session. Fresh optimism in the cloud sector contributed to gains across the broader technology market.
The main question for investors is not as apparent. Nebius generated $2.26 billion in operating cash flow during the first quarter. Deferred revenue contributed an additional $3.20 billion, mainly from advance payments made by customers. The total from these inflows surpassed the amount of operating cash flow that was reported.
Prepayments are beneficial as they confirm demand and assist in funding costly GPU deployments. They also make the timing of contracts crucial for converting cash.
Operational performance strengthened rapidly. Revenue surged 684%, and adjusted EBITDA moved into positive territory. Cost of revenue dropped to 26% of sales.
Operating performance in the first quarter
| Metric | Q1 2025 | Q1 2026 | Change |
|---|---|---|---|
| Revenue | $50.9 million | $399.0 million | up 684% |
| Adjusted EBITDA | $(53.7) million | $129.5 million | increase of $183.2 million |
| Cost of revenue as share of sales | 49% | 26% | down 23 percentage points |
| Operating loss | $(120.3) million | $(128.0) million | $7.7 million larger loss |
| Property, equipment and intangible purchases | $543.9 million | $2.47 billion | up 355% |
Adjusted EBITDA represents a non-GAAP metric.
The buildout continued to be capital-intensive. Capital expenditures in the first quarter were 6.2 times higher than revenue for the period. The operating loss increased modestly to $128 million.
Cash flow outlook shifted due to customer advances
| Q1 cash-flow item | 2025 | 2026 |
|---|---|---|
| Operating cash flow, as reported | $(184.1) million | $2.26 billion |
| Inflow from deferred revenue | $2.4 million | $3.20 billion |
| Operational cash flow minus that inflow | $(186.5) million | $(940.0) million |
| Spending on property, equipment, and intangibles | $(543.9) million | $(2.47) billion |
| Operating cash flow reported minus capital spend | $(728.0) million | $(214.9) million |
| Post-capex result excluding inflow | $(730.4) million | $(3.41) billion |
The mechanical calculations are initial estimates and not metrics reported by the company. They deduct solely the deferred-revenue line in cash flow.
The change is intentionally straightforward, eliminating solely the deferred-revenue cash-flow item. Based on this, the post-capex shortfall amounted to approximately $3.41 billion.
Nebius expanded its funding sources, securing $775 million in senior secured debt in July at SOFR plus 2.50%. The facility is supported by GPUs and contracted cash flows. According to Nebius, this structure provided coverage exceeding 100% of the associated deployment’s capital cost.
In March, the company maintained strong balance-sheet liquidity, holding $9.30 billion in cash compared to total debt—both current and long-term—of $8.45 billion. Deferred revenue was reported at $4.78 billion.
Management has not indicated demand as an issue. “We typically see several customers competing for every GPU we bring online,” CEO Arkady Volozh said in May. Reuters
As of March, remaining performance obligations totaled $33.6 billion. Of that amount, just 29% was anticipated to be fulfilled in the next 24 months. The timing of delivery is significant.
Challenges in valuation and execution
| Measure | Preliminary value |
|---|---|
| Delayed share price | $220.71 |
| Basic equity value | $56.0 billion |
| Midpoint of 2026 revenue outlook | $3.20 billion |
| Basic equity value to revenue midpoint | 17.5 times |
| Q2–Q4 average revenue required | $934 million |
| Required quarterly average compared to Q1 | 2.34 times |
| Midpoint of year-end ARR target | $8.0 billion |
| Basic equity value to ARR midpoint | 7.0 times |
Figures reflect basic share calculations rather than enterprise-value multiples. ARR refers to Nebius’s own definition of annualized run-rate.
Nebius requires an average quarterly revenue of $934 million from the second to the fourth quarter to reach the midpoint of its guidance. This figure is 2.34 times higher than its revenue in the first quarter. Monday’s rally increased the challenge for meeting those targets.
Risks: Nebius faces challenges in obtaining power, hardware and funding, in addition to managing both debt and potential dilution. Certain deferred sums might be eligible for refunds. Delays in capacity could impact margins and strain cash flow.
Second-quarter earnings are due before markets open on August 12. The company will hold its conference call at 08:00 EDT.
Related articles: NASDAQ:NBIS

![Asia Stock Market Today 24/08/2026 [UPDATE: 08:08 SGT] [Chip Buybacks Brace Seoul as Oil Tests Asia’s Open]](https://ts2.tech/wp-content/uploads/2026/08/Asia-market-dashboard-2026-08-24-0808-480x384.jpg "Asia Stock Market Today 24/08/2026 [UPDATE: 08:08 SGT] [Chip Buybacks Brace Seoul as Oil Tests Asia’s Open]")