Investor Dashboard

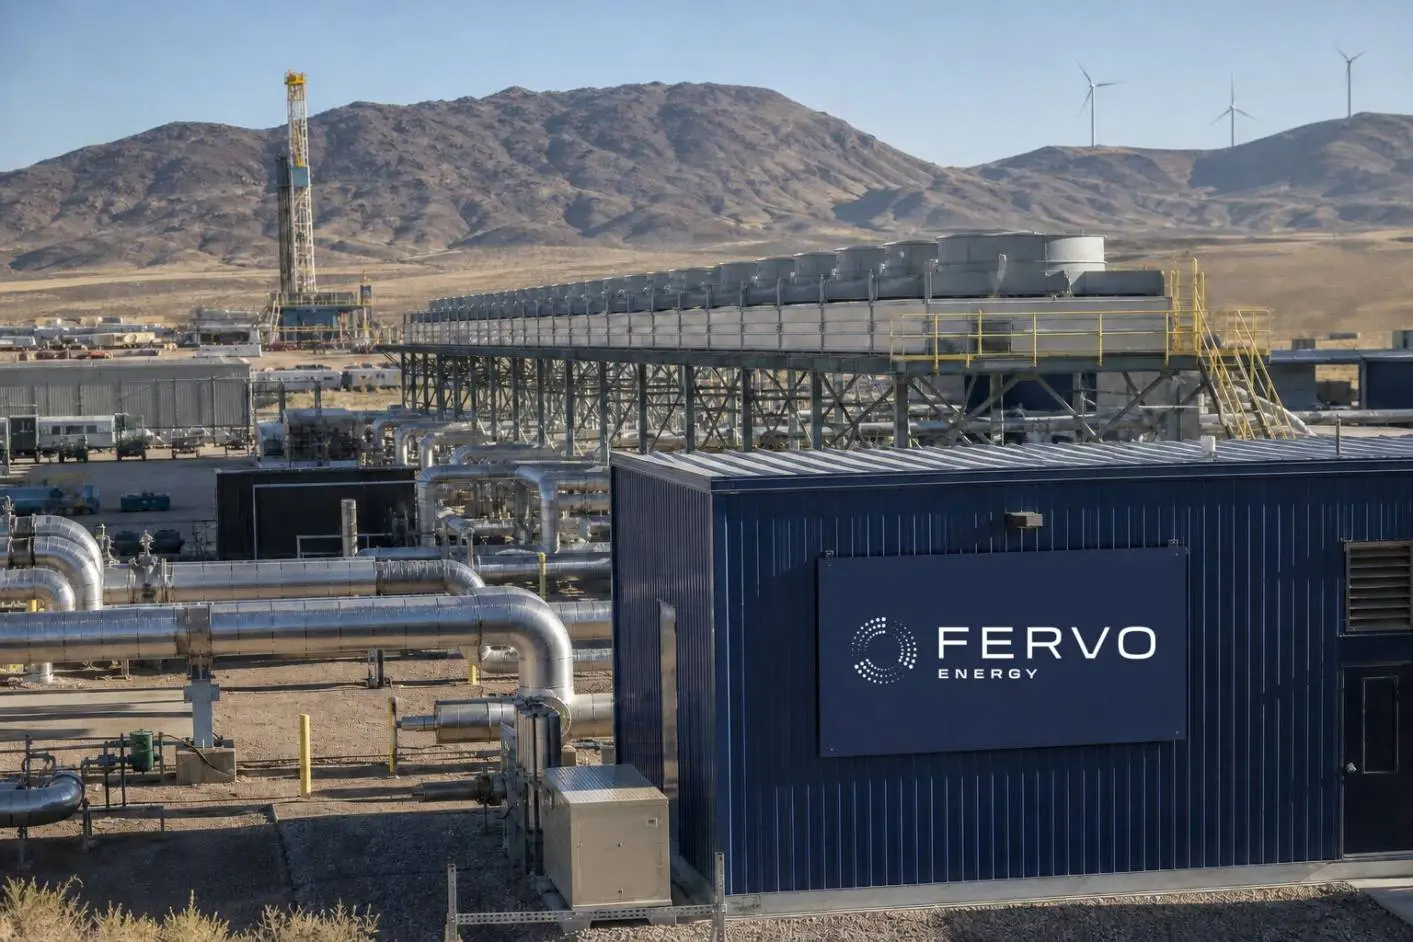
Shares of Fervo Energy Company jumped 28.41% on Tuesday, following the announcement of a 396-megawatt geothermal power agreement with Alphabet Inc.'s Google. The stock finished the session at $19.75, with a trading volume of 35.1 million shares. At 06:52:43 EDT Wednesday, Fervo Energy was trading at $19.56, marking a 0.96% decline from the previous close.
Category hubEnergy
Follow the latest TechStock² reporting, investor analysis and material developments for Energy in one continuously updated topic hub.
FRVO price, U.S. dollars
Megawatts under binding PPAs, plus the conditional Google option
Reported or expected capital amounts, U.S. dollars
Front-month futures, U.S. dollars per barrel; vertical scale is compressed.
Million barrels per day; national figure is July 2026, Chevron figure is a 2026 estimate.
Basis points from the 03:00 EDT reading; delayed data through .
Source: Yahoo Finance E-mini S&P 500 and E-mini Nasdaq-100, 5-minute delayed CME data. Unit: basis points.
Latest delayed readings at 03:54:56 EDT, except gold at 03:54:57 EDT, versus prior settlement.
Source: Yahoo Finance delayed futures feeds for Dow, Russell 2000, WTI crude and gold. Percent changes are calculated from displayed prior settlements.
Selected SPDR sector fund returns at the September 1 cash close. Unit: percent.
Source: Yahoo Finance September 1 closes for XLE, XLU, XLV, XLI, XLK and XLY.
Change from the September 1 cash close at . Early prints can be thin.
Source: Yahoo Finance first extended-hours prints for DELL, MDB and PANW. Unit: percent from the prior cash close.
ADR price in U.S. dollars; regular close marked at 16:00 ET.
As of . Thirty-minute observations; selected regular-session points and the scheduled aftermarket reading. Source: Yahoo Finance.September 1 regular-session change; scale tops at 5.5%.
2Q26 result and year-on-year change.
September 1 regular-session change
Backlog supports visibility; debt absorbs part of the cash benefit
Composite index level from the opening bell through .
Source: Nasdaq Composite minute chart. Levels shown at 09:30, each full hour and 16:00 EDT.
Session return versus 15:00–16:00 EDT return. Index closes are preliminary at 16:00 EDT.
Sources: Google Finance S&P 500, Nasdaq and Google Finance Dow. Last-hour changes use 15:00 and 16:00 EDT levels.
Advancing versus declining issues reported at 14:36 EDT.
Source: Reuters market breadth. Green denotes advancers; red denotes decliners.
Regular session, percent change. As of .
Source: Yahoo Finance five-minute index feeds. Changes use the August 31 close.
Price change through 14:00 EDT. The session column uses Monday’s close.
Source: Yahoo Finance five-minute index feeds; values rounded to two decimals.
Selected S&P 500 sector ETF proxies, session change at 14:00 EDT.
Spread: Energy led technology by 2.67 percentage points.
Source: Yahoo Finance; XLE, XLV, XLP, XLI, XLK and XLY.
Source: Yahoo Finance, consolidated U.S. exchange data. Prices are snapshots, not live.
Bar scale: 1,000 MW. The expansion is an option, not binding capacity.
Source: Fervo's September 1 SEC exhibit. Option capacity depends on later conditions.
June 30 balance sheet; H2 capex shown at the $875 million guidance midpoint.
Source: Fervo June 30 Form 10-Q and August 12 guidance. Cash also funds operating and development costs.
Extended-hours change from Monday’s close, percent
Futures change, with each panel using its own scale
Sector-fund breadth by 08:00 EDT
2 up / 9 down
Contracts traded, 04:00–07:51 EDT
NYSE price, U.S. dollars
Shares sold or issued; first-half company issuance versus August 3 insider filing
June 30 balance-sheet and first-half cash-flow figures
Consensus distribution and selected August 10 targets
Change from each contract's 04:00 EDT level. Source: Yahoo Finance delayed CME data; author calculations. EDT times.
Session: 04:00–06:53 EDT. Latest 60 minutes: 05:53–06:53 EDT.
Source: Yahoo Finance delayed CME data; author calculations.
Change from prior settlement or close at 06:53 EDT.
Source: Yahoo Finance delayed futures data; author calculations. A lower Treasury-note future is consistent with a higher yield.
Latest available ETF trades through 06:53 EDT. Bar length shows absolute move; the badge covers all 11 Select Sector SPDRs. Source: Yahoo Finance delayed data.
Change from the 04:00 EDT premarket opening, percent
Source: Yahoo Finance delayed futures dataAs of
Delayed futures quotes versus prior settlement, percent
Source: Yahoo Finance. Quotes at 05:54 EDT.
Premarket ETF change from Monday's close
Source: Yahoo Finance sector ETF quotes. Latest verified prints between 05:36 and 06:00 EDT.
Premarket change from Monday's close; GoPro shown on a separate scale
Source: Yahoo Finance extended-hours quotes. As of 06:00 EDT.
Change from 03:00 ET, percent
Source: Yahoo Finance delayed CME futures data. Last available trades before the cutoff; figures rounded.
Futures versus previous settlement; Treasury move is Monday versus Friday
Sources: Yahoo Finance futures and AP. Prices are the latest available at 04:00 ET.
Selected S&P 500 sector ETF proxies, close-to-close
Source: Yahoo Finance. SPDR sector ETF adjusted closes, August 31, 2026.
Scheduled release times, Eastern Time
Sources: Federal Reserve Bank of New York and BLS.
Regular returns use the 16:00 close versus the prior close. Last-hour values use the latest quote at or before each endpoint. Sources: SPY, QQQ, DIA and IWM; calculations by TS2.
Liquid sector-ETF returns at the regular-session close
Sources: Yahoo Finance closing data for XLE, XLK, XLY and XLU; returns calculated from prior close.
Regular-session market internals, August 31
Preliminary close data. Source: Reuters. NYSE ratio is normalized to 100 advancing issues for comparison.
Snapshot: August 31, 2026 · 16:00 EDT
Prior interval: 15:00–16:00 EDT
| Index proxy | 15–16 EDT | Day |
|---|---|---|
| SPY | +0.14% | −0.30% |
| QQQ | +0.29% | +0.05% |
| DIA | −0.06% | −0.65% |
| IWM | +0.23% | −0.62% |
| ETF proxy | Day | Last hour |
|---|---|---|
| Energy · XLE | +2.04% | +0.61% |
| Technology · XLK | +0.44% | +0.31% |
| Health care · XLV | −0.36% | +0.01% |
| Industrials · XLI | −1.14% | −0.11% |
| Utilities · XLU | −1.17% | +0.02% |
| Communication · XLC | −1.35% | −0.20% |
| Security | Move | Catalyst |
|---|---|---|
| TSLA | +5.5% | megacap bid |
| XOM | +2.7% | oil |
| CVX | +2.1% | oil |
| AON | −8.6% | $17bn deal |
| PCG | −20.1% | wildfire law |
| EIX | −23.1% | liability |
| Firm | New view | Prior view | Target | Was |
|---|---|---|---|---|
| Wells Fargo | Equal Weight | Overweight | $24 | $25 |
| BMO Capital | Market Perform | Outperform | $21 | $28 |
| Mizuho | Neutral | Outperform | $16 | $21 |
Sources: Associated Press · Reuters via Euronext · Yahoo Finance · MarketsFN. All market figures are stamped 16:00 EDT unless marked settlement.
Session snapshot and preceding 60 minutes · August 31, 2026 · 15:00 EDT
| Proxy | Session | Last hour |
|---|---|---|
| SPY | -0.44% | -0.04% |
| QQQ | -0.24% | -0.03% |
| DIA | -0.59% | -0.01% |
| IWM | -0.84% | Flat |
| Indicator | Reading |
|---|---|
| WTI crude | $85.51 · +2.5% |
| Brent crude | $90.34 · +2.5% |
| S&P breadth | 158 up / 345 down |
| Main catalyst | U.S. strike near Hormuz |
TSLA +4.96% · XOM +2.04% · CVX +1.53%
EIX -23.22% · PCG -18.83% · AMZN -2.88%
A persistent oil shock raises inflation and margin pressure, potentially reducing the Fed’s flexibility. Energy benefits, but broader equity multiples face a discount-rate headwind.
Watch: Hormuz headlines · SPY near $766 · energy relative strength · late breadth · August labor data.
| Shares sold | 3,264 |
| Execution price | $39.77 |
| Sale value | $129,811 |
| Direct shares retained | 7,822 |
| Joint-account shares | 5,000 |
| Plan adopted | Apr. 2, 2026 |
| Metric | Latest | Signal |
|---|---|---|
| Q2 revenue | $1.21M | First revenue |
| Q2 operating loss | -$73.19M | 60× revenue |
| H1 operating cash use | -$65.46M | 2.1× prior year |
| 2026 operating cash guide | $120M-$150M | Funded |
| 2026 capex guide | $400M-$500M | Build phase |
| Low | $51.00 | +26% |
| Average | $74.75 | +85% |
| High | $100.00 | +147% |
| Ratings | 7 Buy · 7 Hold · 0 Sell | |
| Instrument | 05:00 | 06:00 | Hour |
|---|---|---|---|
| S&P 500 | −0.16% | −0.17% | −1.25 pts |
| Dow | −0.15% | −0.18% | −14 pts |
| Nasdaq-100 | +0.07% | −0.13% | −57.50 pts |
| Contract | Price | Vs. Oct. |
|---|---|---|
| Oct. 2026 | $86.56 | — |
| Nov. 2026 | $84.68 | −$1.88 |
| Dec. 2026 | $82.55 | −$4.01 |
| Jan. 2027 | $80.62 | −$5.94 |
| Jun. 2027 | $74.47 | −$12.09 |
| Signal | Read | Transmission |
|---|---|---|
| Brent | Above $91 | Inflation premium |
| Equity futures | Broadly lower | Risk appetite |
| WTI curve | $12.09 backwardation | Prompt supply risk |
| Cash open | 09:30 EDT | Breadth test |
Watch: tanker flows, Treasury yields and whether energy strength broadens after the opening bell.
August 31, 2026 · Available interval: 09:30–10:00 ET
Opening move: -0.18%.
Weakest major index.
Semis cushioned software losses.
+3.6% on Hormuz risk.
| Index | At open | At 10:00 | 09:30–10:00 |
|---|---|---|---|
| Dow | -0.18% | -0.5% | -0.5% |
| S&P 500 | -0.18% | -0.3% | -0.3% |
| Nasdaq | -0.17% | -0.1% | -0.1% |
The session was 30 minutes old, so the available interval replaces a full preceding hour.
| Brent | >$90 | +2.5% |
| WTI | $86.40 | +3.6% |
| 10-year Treasury | ~4.75% | Higher |
| VIX | ~15.3 | +6% |
| Energy Select SPDR | $64.15 | +2.35% |
Decliners led by 1.22 to 1.
| PG&E | -19% | Wildfire liability |
| Aon | -5% | USI deal report |
| BioMarin | +5% | Royalty agreement |
| IREN | +2.7% | Post-results rebound |
| Intel | +1% | Semiconductor rebound |
The opening decline broadened as oil crossed $86 and the 10-year yield approached 4.75%. Energy gained 2.35%, but decliners still outnumbered advancers. The market is treating renewed Hormuz conflict as an inflation event, not only a geopolitical headline.
Watch tanker-flow headlines, WTI, the 10-year yield and PG&E contagion across utilities. Lower oil or yields would help technology; another spike would favor energy and deepen pressure on consumers.
| Indicator | Latest estimate | Signal |
|---|---|---|
| July production shut-ins | 5.5M b/d | Tight |
| 2Q26 inventory change | -4.2M b/d | Tight |
| 3Q26 inventory forecast | -3.8M b/d | Tight |
| OPEC+ September increase | +188K b/d | Partial offset |
| China July imports | -24.3% YoY | Demand drag |
| Escalation | Tanker or terminal disruption; prompt contracts rise fastest. |
| Base case | Restricted flows persist; Brent holds around the high $80s. |
| Normalization | Shipping agreement and restored output pull Brent toward EIA's $78 fourth-quarter view. |
| Demand shock | Further Chinese weakness compresses the curve despite supply risk. |