
Oil Surge Pulls Stocks Lower as Energy Defies Broad Selloff
NEW YORK, August 31, 2026, 15:00 EDT — U.S. equities traded lower late on Monday as oil prices climbed following a U.S. strike on Iranian rocket launchers near the Strait of Hormuz, renewing inflation worries. Energy stocks advanced in contrast to wider market weakness, with main indices steady during the prior hour.
- The S&P 500 benchmark declined 0.44% during the session, edging down just 0.04% between 14:00 and 15:00 EDT.
- Among the 503 S&P 500 components, 345 stocks fell while 158 rose, resulting in a negative ratio of 2.18 to 1.
- Energy rose 1.43%, as utilities, communications, and industrials each dropped at least 1%.
Market update in late afternoon
| Index proxy | 15:00 price | Session | 14:00–15:00 | Approx. volume |
|---|---|---|---|---|
| SPY / S&P 500 | $765.96 | down 0.44% | off 0.04% | 18.5M |
| QQQ / Nasdaq-100 | $714.71 | down 0.24% | off 0.03% | 21.8M |
| DIA / Dow | $531.90 | down 0.59% | off 0.01% | 1.1M |
| IWM / Russell 2000 | $293.26 | down 0.84% | unchanged | 14.4M |
The previous hour saw consolidation rather than a new decline. All four index proxies held steady since 14:00, indicating the market had digested the geopolitical news but maintained a defensive stance in the last hour.
Oil Surge Pulls Stocks Lower as Energy Defies Broad Selloff
Session snapshot and preceding 60 minutes · August 31, 2026 · 15:00 EDT
Index tape
| Proxy | Session | Last hour |
|---|---|---|
| SPY | -0.44% | -0.04% |
| QQQ | -0.24% | -0.03% |
| DIA | -0.59% | -0.01% |
| IWM | -0.84% | Flat |
Cross-asset catalyst
| Indicator | Reading |
|---|---|
| WTI crude | $85.51 · +2.5% |
| Brent crude | $90.34 · +2.5% |
| S&P breadth | 158 up / 345 down |
| Main catalyst | U.S. strike near Hormuz |
Leaders
TSLA +4.96% · XOM +2.04% · CVX +1.53%
Laggards
EIX -23.22% · PCG -18.83% · AMZN -2.88%
Investor bridge
A persistent oil shock raises inflation and margin pressure, potentially reducing the Fed’s flexibility. Energy benefits, but broader equity multiples face a discount-rate headwind.
Watch: Hormuz headlines · SPY near $766 · energy relative strength · late breadth · August labor data.
Small caps underperformed throughout the session, reflecting stress from increased energy costs and sensitivity to interest rates. The Nasdaq-100 was the most resilient, buoyed by a rise in Tesla shares, while declines in Alphabet and Amazon contributed to a mixed performance among megacaps.
Energy remains isolated
| Sector proxy | Session | 14:00–15:00 | Signal |
|---|---|---|---|
| Energy (XLE) | +1.43% | -0.13% | Benefits from oil surge |
| Technology (XLK) | +0.12% | -0.07% | Only sector in green apart from energy |
| Health care (XLV) | -0.37% | -0.04% | Shows defensive strength |
| Financials (XLF) | -0.56% | -0.06% | Experiences moderate headwinds |
| Industrials (XLI) | -1.02% | -0.02% | Displays cyclical softness |
| Communication services (XLC) | -1.15% | +0.14% | Ranks among weakest, but bounces late hour |
| Utilities (XLU) | -1.19% | -0.11% | Lags on rate sensitivity |
West Texas Intermediate hovered close to $85.51 per barrel, gaining approximately 2.5%, while Brent crude was at about $90.34, rising by a similar margin, Reuters market data showed. Prices climbed after a U.S. strike near a key waterway that handles a significant portion of the world’s oil shipments.
This translated directly into equity outperformance. Exxon Mobil advanced roughly 2.0% and Chevron increased 1.5%, making energy the session’s standout sector. However, XLE slipped 0.13% in the last tracked hour, indicating the earlier oil-driven move had lost momentum.
Movers reflect contrasting risk narratives
| Company | Price | Move | Primary driver |
|---|---|---|---|
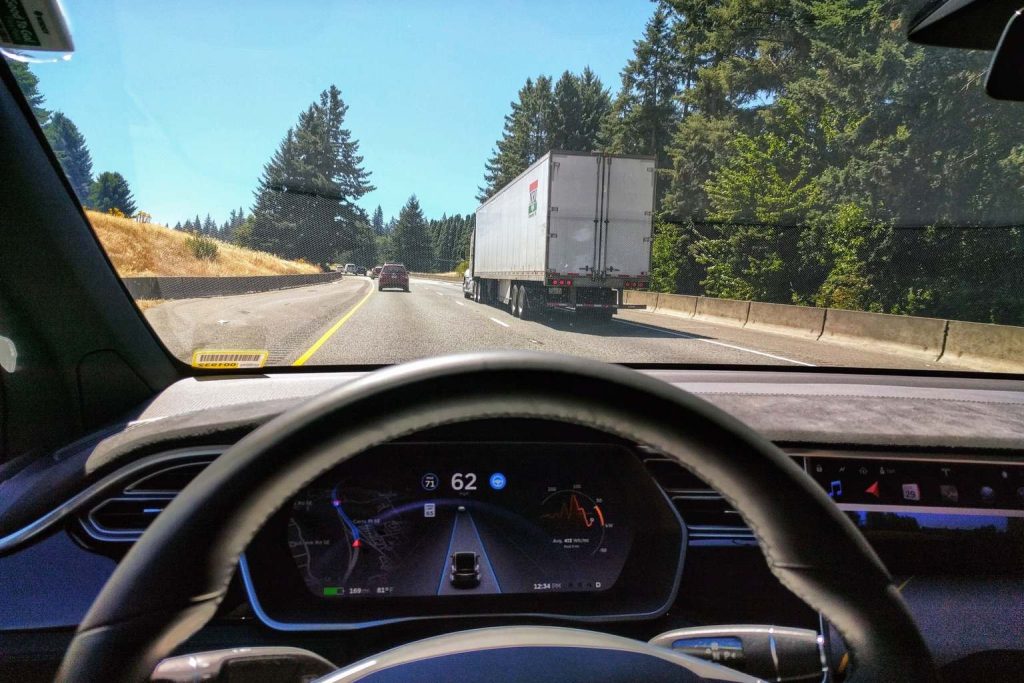
| Tesla | $366.05 | +4.96% | Market focus on autonomy and AI boosted shares despite safety concerns |
| Exxon Mobil | $159.91 | +2.04% | Crude price gains supported the stock |
| Chevron | $204.95 | +1.53% | Crude oil strength lifted shares |
| Amazon | $258.75 | -2.88% | Downward pressure on megacap growth |
| Alphabet | $338.82 | -2.24% | Weakness in communication services sector |
| Edison International | $53.88 | -23.22% | Concerns about California wildfire-liability legislation weighed |
| PG&E | $13.48 | -18.83% | California wildfire-liability legislation worries pressured shares |
California utilities experienced the steepest company-focused decline of the session. Shares of Edison International and PG&E fell after news emerged that suggested new state wildfire legislation might allow insurers to more readily seek reimbursement from utilities, reviving a tail risk that investors had largely viewed as under control.
Breadth, drivers and upcoming signals to monitor
| Indicator | Reading | Why it matters |
|---|---|---|
| S&P 500 breadth | 158 up / 345 down | 68.6% of stocks finished lower |
| WTI crude | About $85.51, +2.5% | Signals inflation and adds to consumer costs |
| Brent crude | About $90.34, +2.5% | Measures global supply risk |
| Last-hour index action | -0.04% to flat | Late-day drop paused by the close |
| Near-term macro watch | August labor data | Potential to alter rate outlook |
| Next inflation test | September 11 CPI | Focus on energy-related effects |
Inflation and discount rates form the investor bridge. A prolonged surge in oil prices has the potential to pressure both consumer spending and company profits, limiting the Federal Reserve’s ability to cut rates. While energy companies could gain, sustained shocks of this kind might lead to lower overall market valuations.
Risks: Tensions rising near the Strait of Hormuz may trigger a sharp shift in oil prices and extend the decline in equities. Any reduction in tensions could swiftly unwind energy positions. Utility stocks might face steeper losses if related legislation progresses, while a weaker labor report could bolster bonds and rate-sensitive stocks even amid oil-driven turmoil.
Towards the end of the session, key signals included SPY’s ability to remain around $766, energy maintaining its outperformance, and any shift in the 2.18-to-1 negative breadth ratio. These indicators would help separate a controlled geopolitical adjustment from a wider decline in risk appetite.
Sources: Associated Press; Reuters market report via MarketScreener; Nasdaq SPY intraday data; StockAnalysis S&P 500 constituents. Figures and movements are recorded for 15:00–15:11 EDT; ETF trading volume is estimated and might be revised.
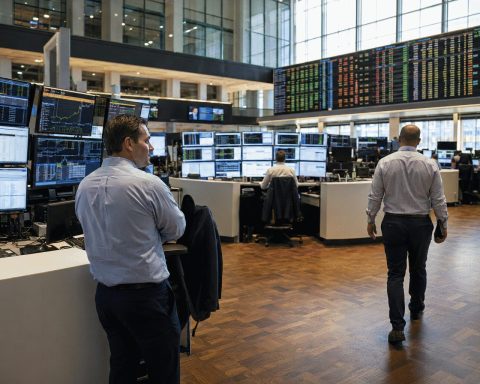
Image: Trading floor at the New York Stock Exchange, credited to UKinUSA/Maria Wurtz via Wikimedia Commons, CC BY-SA 2.0; image has been cropped and resized.
Related articles: NASDAQ:AMZN