
NEW YORK, August 31, 2026, 07:44 ET
- Front-month WTI increased by 3.79% to $86.56 as of 06:14 ET.
- Brent rose 3.69% to $91.35 after renewed U.S.-Iran clashes heightened worries over the Strait of Hormuz.
- October WTI was $12.09 higher than June 2027, showing a 16.2% premium for the near term.
- The EIA forecasts Brent crude will average $78 in the fourth quarter, provided disrupted supplies are restored.
Oil futures surged close to 4% on Monday, lifted by fresh U.S.-Iran clashes that put Gulf shipping routes at risk. Front-month West Texas Intermediate traded at $86.56 per barrel at 06:14 ET.
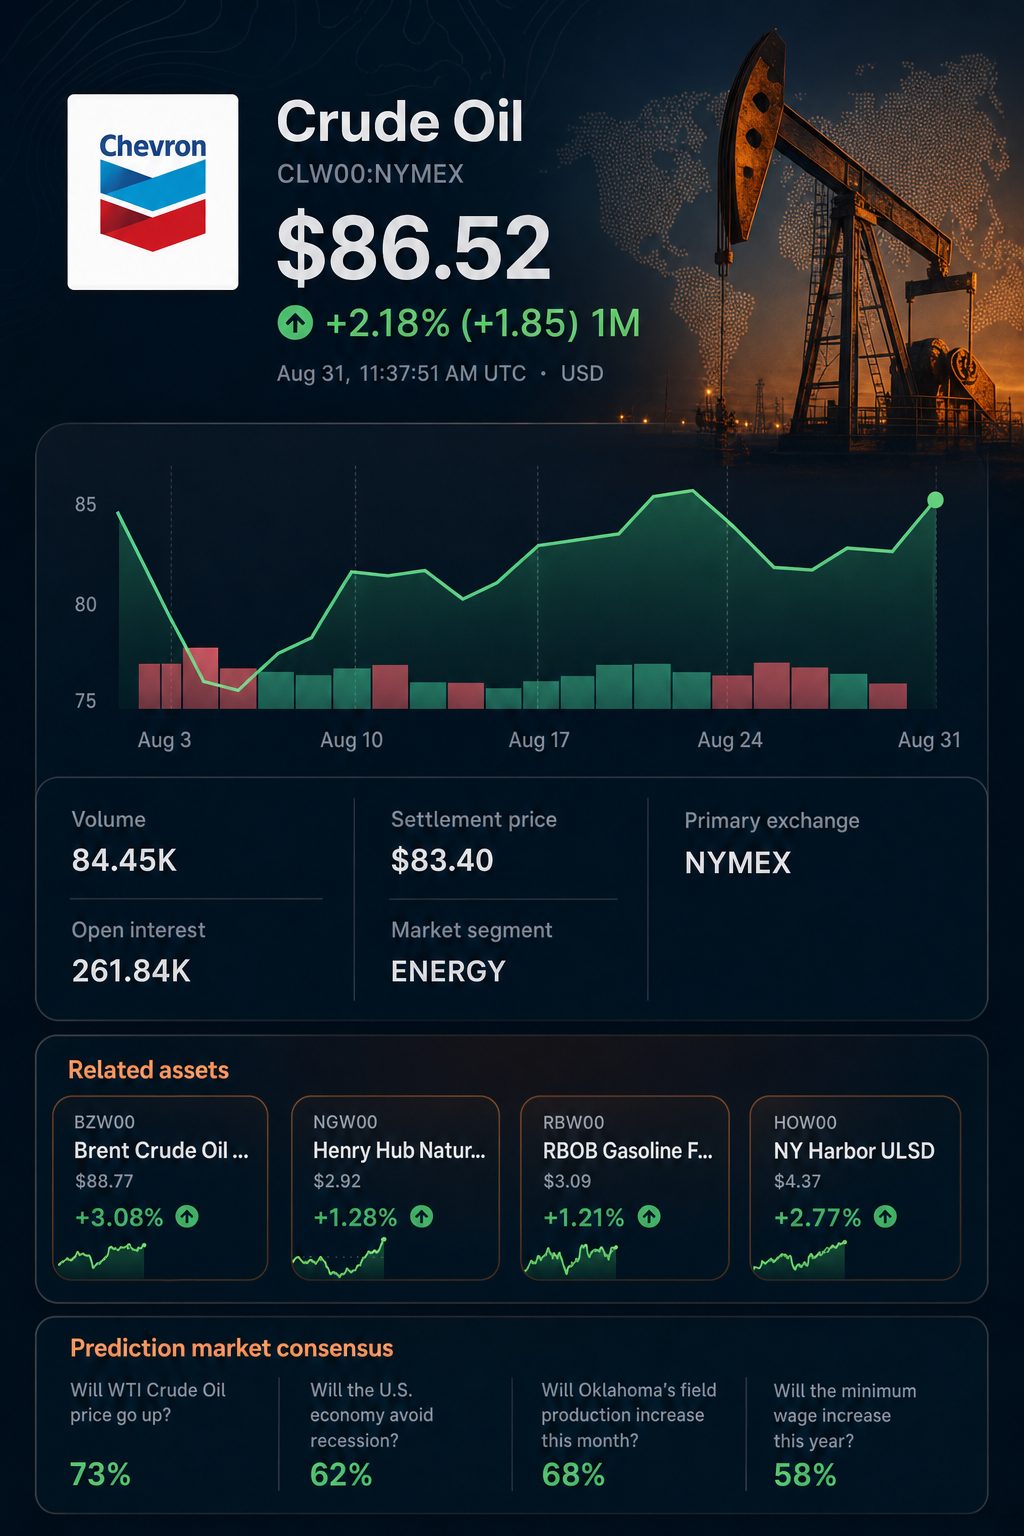
Brent climbed to $91.35, regaining a supply premium that had diminished in the previous week. Both figures reflect delayed public quotes MarketWatch futures data.
The more significant action is seen along the curve. October WTI was priced $12.09 higher than June 2027, representing a 16.2% premium.
Backwardation gives higher value to prompt barrels over future supply. This indicates traders are concerned about delivery risks right now, rather than a lasting shortfall.
| WTI contract | Price at 06:14 ET | Discount to October |
|---|---|---|
| October 2026 | $86.56 | — |
| November 2026 | $84.68 | $1.88 |
| December 2026 | $82.55 | $4.01 |
| January 2027 | $80.62 | $5.94 |
| June 2027 | $74.47 | $12.09 |
On Sunday, U.S. forces targeted missile launchers located on Iran’s Larak Island. Following this, Iranian media reported that Iran launched attacks on two U.S. air bases in Jordan, with the information referenced by Reuters.
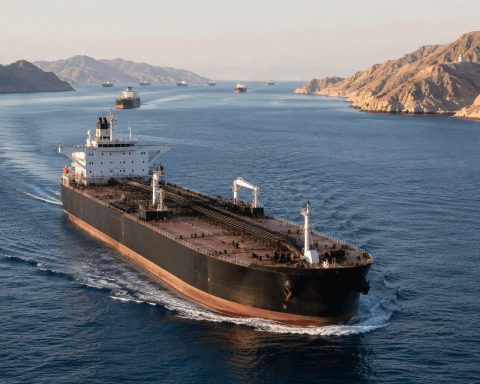
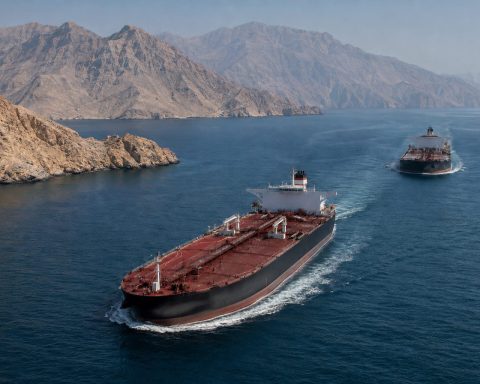
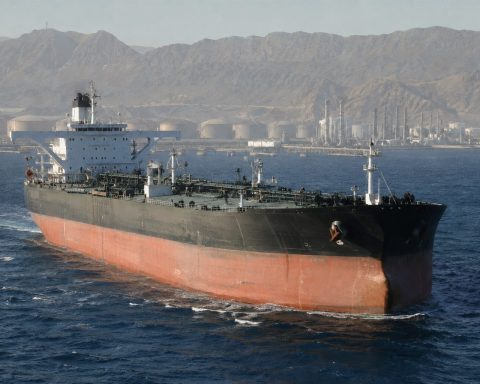
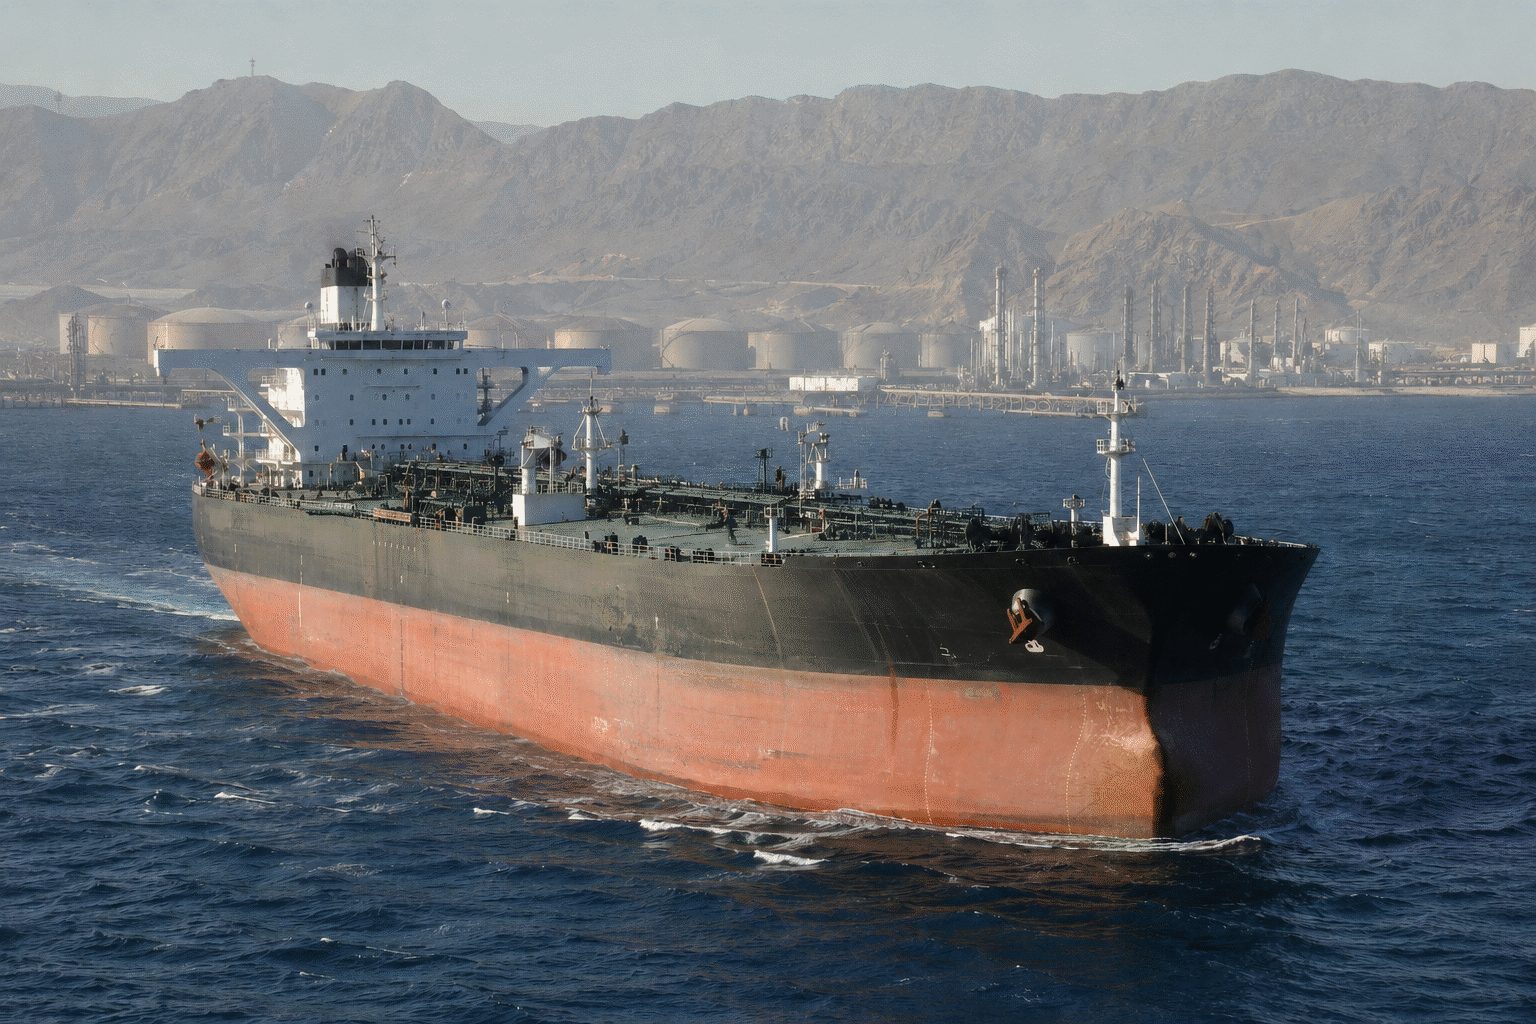
The key indicator is tanker movement. An ongoing blockage, a damaged loading terminal or an attack on a tanker would constrain immediate supply. Uninterrupted shipping could swiftly eliminate the geopolitical premium The Wall Street Journal.
The U.S. Energy Information Administration reports that average production shut-ins in July reached 5.5 million barrels per day. The agency also states global stockpiles declined by 4.2 million barrels daily over the second quarter.
EIA forecasts a further daily inventory drop of 3.8 million barrels for the third quarter. The agency’s baseline scenario sees Brent crude averaging close to $85 during this period, before falling to $78 in the fourth quarter as supply rebounds EIA outlook.
Upside potential is capped by demand. According to a Reuters survey of 31 analysts, Brent is projected to reach $85.08 in 2026, while WTI is seen at $80.20. Forecasts for global demand indicate a contraction ranging from one million to 1.6 million barrels per day.
China remains the main downside risk. Crude imports in July dropped 24.3% from a year ago. OPEC+ is set to add 188,000 barrels per day in September.
Risks: An intensification of military conflict may lift prompt contract prices and increase backwardation. Conversely, a shipping deal, steady tanker movements, or reduced demand from China could swiftly undo these gains.
The key indicator to monitor is the October-June spread. A broader differential would indicate a tightening in prompt supply, while a smaller spread would suggest that physical flows are returning to normal.
Related articles: Commodities