
NEW YORK, August 29, 2026, 08:05 (EDT).
- WTI lost 4.2% this week to settle Friday at $83.40 a barrel.
- October Brent fell 5.4% for the week, closing at $89.31.
- Persian Gulf exports recovered to an estimated 15–16 million barrels daily.
- Iran still says restrictions through the Strait of Hormuz remain in force.
Oil prices recorded their steepest weekly retreat since early August, even as Iran claimed full control of the Strait of Hormuz. Traders focused instead on the barrels reaching buyers.
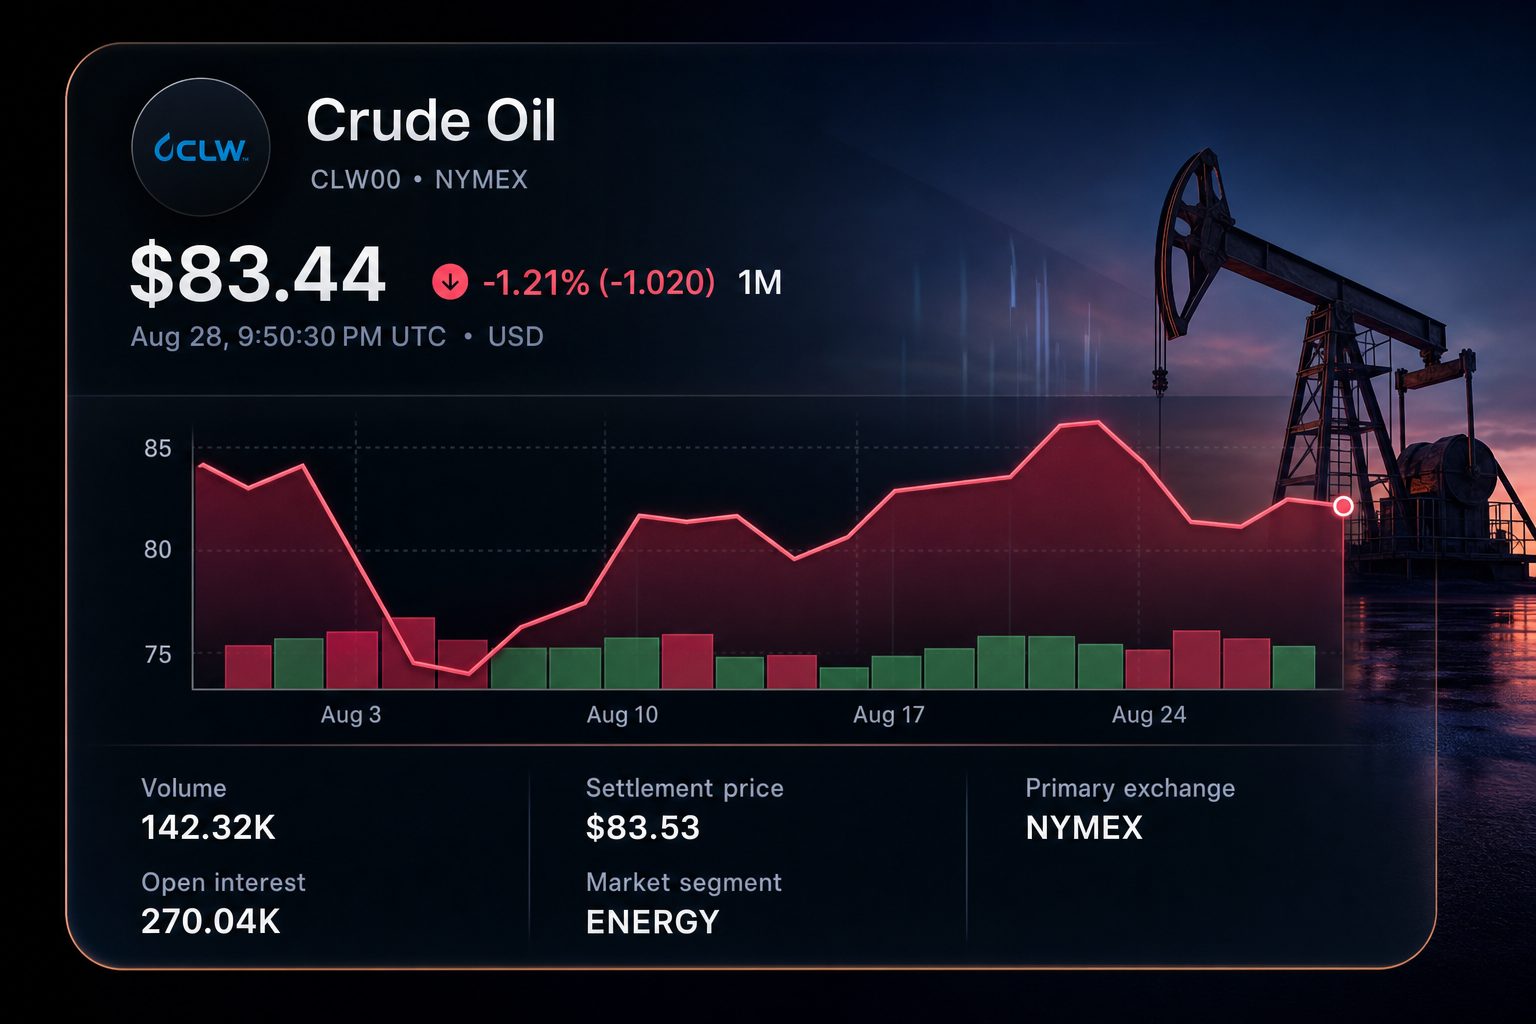
West Texas Intermediate settled Friday at $83.40 a barrel, down 4.2% for the week. October Brent closed at $89.31, a weekly decline of 5.4%. Both contracts slipped again Friday.
The move shows how physical supply can outrank political rhetoric. Iran’s Revolutionary Guards Navy rejected U.S. claims that the strait was open. It said restrictions would remain until American military actions end.
Yet Persian Gulf crude exports have climbed toward 15–16 million barrels daily, according to estimates cited by market reports. That remains below the pre-conflict range of 22–24 million. It is roughly triple March’s 5–6 million trough.
| Oil-market measure | Latest | Change or comparison |
|---|---|---|
| WTI futures | $83.40/bbl | -4.2% this week |
| October Brent futures | $89.31/bbl | -5.4% this week |
| Brent-WTI premium | $5.91/bbl | Global supply risk remains priced |
| Persian Gulf exports | 15–16 mb/d | About 67%–73% of pre-conflict flow |
| OPEC 2026 demand growth forecast | +0.6 mb/d | Revised slightly lower |
| Non-DoC 2026 supply growth | +0.6 mb/d | Matches projected demand growth |
Alternative routes also softened the premium. Saudi loadings strengthened, while Iraq offered transfers outside the Persian Gulf. Iran and Oman discussed a corridor, though no normal reopening was confirmed.
The Brent-WTI spread ended near $5.91 a barrel. That premium still signals greater disruption risk for seaborne crude. The weekly decline says the market reduced that risk, not removed it.
Fundamentals leave little room for a simple bearish call. OPEC expects global demand to grow 0.6 million barrels daily in 2026. It projects equal growth from producers outside the OPEC+ cooperation framework.
OPEC also cut required crude from participating producers to 42.1 million barrels daily. That is 200,000 barrels below 2025. The revision suggests a looser market if disrupted Gulf supply continues returning.
Inventories remain the counterweight. OECD commercial stocks stood 66.5 million barrels below their five-year average in June. Crude stocks alone were 54.2 million barrels below that benchmark.
Refined products are tighter than crude. OPEC said U.S. Gulf Coast refining margins reached their highest level since October 2022 in July. Distillate shortages and refinery outages drove that move.
That split matters for households and transport companies. Cheaper crude can reduce future fuel costs. Strong gasoline and diesel cracks may delay the relief.
Energy investors face a different transmission. A sustained Brent price below $90 would pressure producer cash flow and buybacks. Refiners can still benefit if product margins stay elevated.
The next signals are physical. Tanker loadings, freight rates and weekly inventory changes matter more than official statements alone. Any verified drop in Gulf exports would quickly rebuild the risk premium.
Risks: Shipping data can be incomplete when tankers disable tracking. A military escalation could close alternative routes. Conversely, a durable corridor agreement could push prices lower faster than current forecasts.
Related articles: Commodities