
NEW YORK, August 28, 2026, 14:50 EDT – Gold mining stocks slid 4.6% after a surprise move on interest rates by Warsh pressured the sector, threatening to counteract the group’s 23.8% rally seen in August.
- By 14:33 EDT, VanEck Gold Miners ETF dropped 4.60% to $98.92.
- Junior miners dropped 5.14%, and SPDR Gold Shares fell 3.36%.
- Prior to Friday’s rate shock, GDX had risen by 23.75% in August.
- Newmont’s second-quarter margin of $2,793 per ounce offers support amid the decline in gold prices.
Gold-mining stocks declined more steeply than bullion on Friday, as hawkish comments from the Federal Reserve pushed up rate forecasts. The drop highlighted the same operating leverage that had driven the sector’s rally in August.
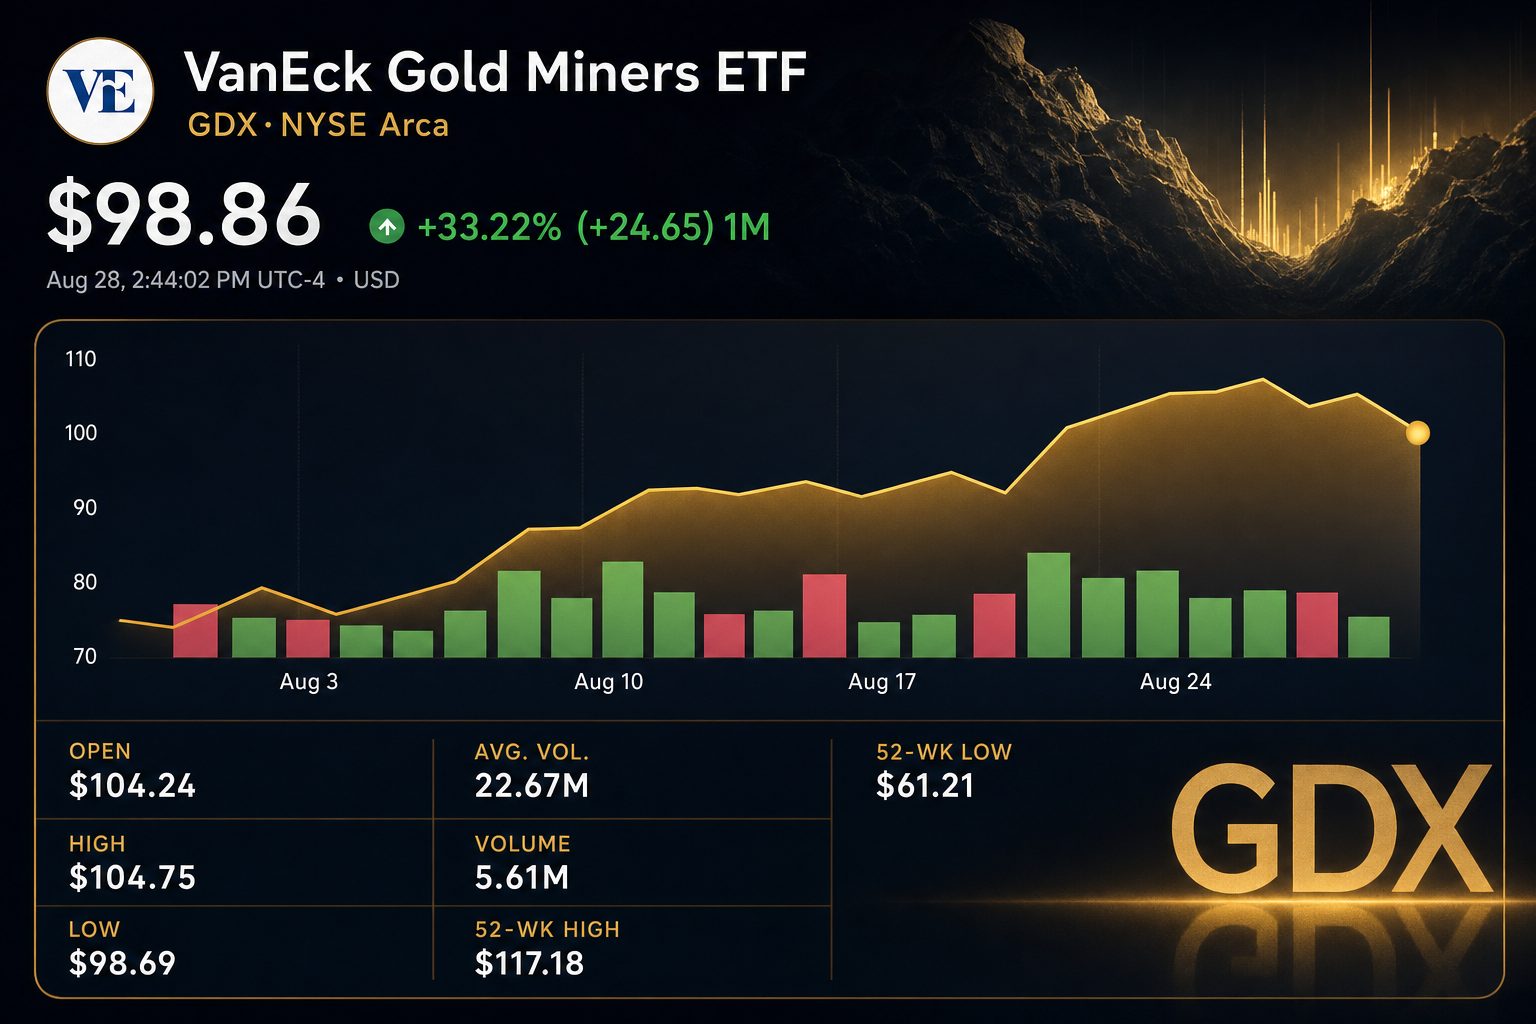
The VanEck Gold Miners ETF was down 4.60% at $98.92 as of 14:33 EDT. The VanEck Junior Gold Miners ETF slipped 5.14% to $127.86. Both ETFs lagged behind the SPDR Gold Shares ETF, which declined 3.36%.
Spot gold declined 2.9% to $4,567.23 an ounce as of 13:44 EDT. The probability of a September rate increase climbed to 58% from 36% after Federal Reserve Chair Kevin Warsh said policymakers had more to address regarding inflation Reuters.
The dollar climbed to its highest level in a week. Increased yields make holding non-yielding gold less attractive due to greater opportunity costs. Investing in miners introduces both operating and equity risks on top of exposure to the commodity.
| Exposure | Price at 14:33 EDT | Friday move | Investor signal |
|---|---|---|---|
| GDX | $98.92 | -4.60% | Major gold mining firms |
| GDXJ | $127.86 | -5.14% | More volatile junior miners |
| GLD | $408.39 | -3.36% | Backing by physical bullion |
| Newmont | $127.46 | -3.65% | Top publicly traded producer |
The pullback comes after a notably strong month. In August, GDX surged 23.75%, marking its strongest monthly performance since April 2020. It also advanced 21.09% during a single five-session rally sector analysis.
Newmont stock climbed over 40% in August, while gold advanced roughly 14% in that span. The difference stems from stable mining costs and a reduced number of shares, rather than just investor optimism Investor’s Business Daily.
Newmont’s second-quarter results highlight its leverage, with gold ounces fetching $4,414 and by-product all-in sustaining costs at $1,621. The $2,793 margin comes before accounting for corporate overhead and tax expenses.
The company reported $2.2 billion in free cash flow and $2.9 billion in operating cash flow. At the close of June, the firm held $3.4 billion in net cash and $13 billion in liquidity Newmont results.
Newmont has cut its share count by over 100 million since February 2024. This 9% decrease increases the portion of mine cash flows tied to each outstanding share. At the end of the quarter, $4.3 billion was still available under its repurchase authorization.
Friday’s decline has not removed the margin cushion. Spot gold remained roughly $153 higher than Newmont’s realized price in the second quarter. However, the reaction in the stock indicates that valuation can shrink even before mining economics deteriorate.
Junior miners declined the most, as they typically face higher financing, construction and reserve risks. Their cash flows tend to be less diversified. As a result, GDXJ more strongly reflects both positive and negative movements in bullion.
Risks continue to come from both directions. An uptick in yields may simultaneously weigh on bullion and valuation multiples. Cost increases, declining ore quality, or project setbacks could reduce margins even if gold prices stay close to their present range.
Investors are advised to focus on the September Fed meeting, the dollar, and realized prices for the third quarter. The main question is if Friday signals a rate repricing or a shift in gold’s overall trajectory.
Related articles: NYSE:NEM