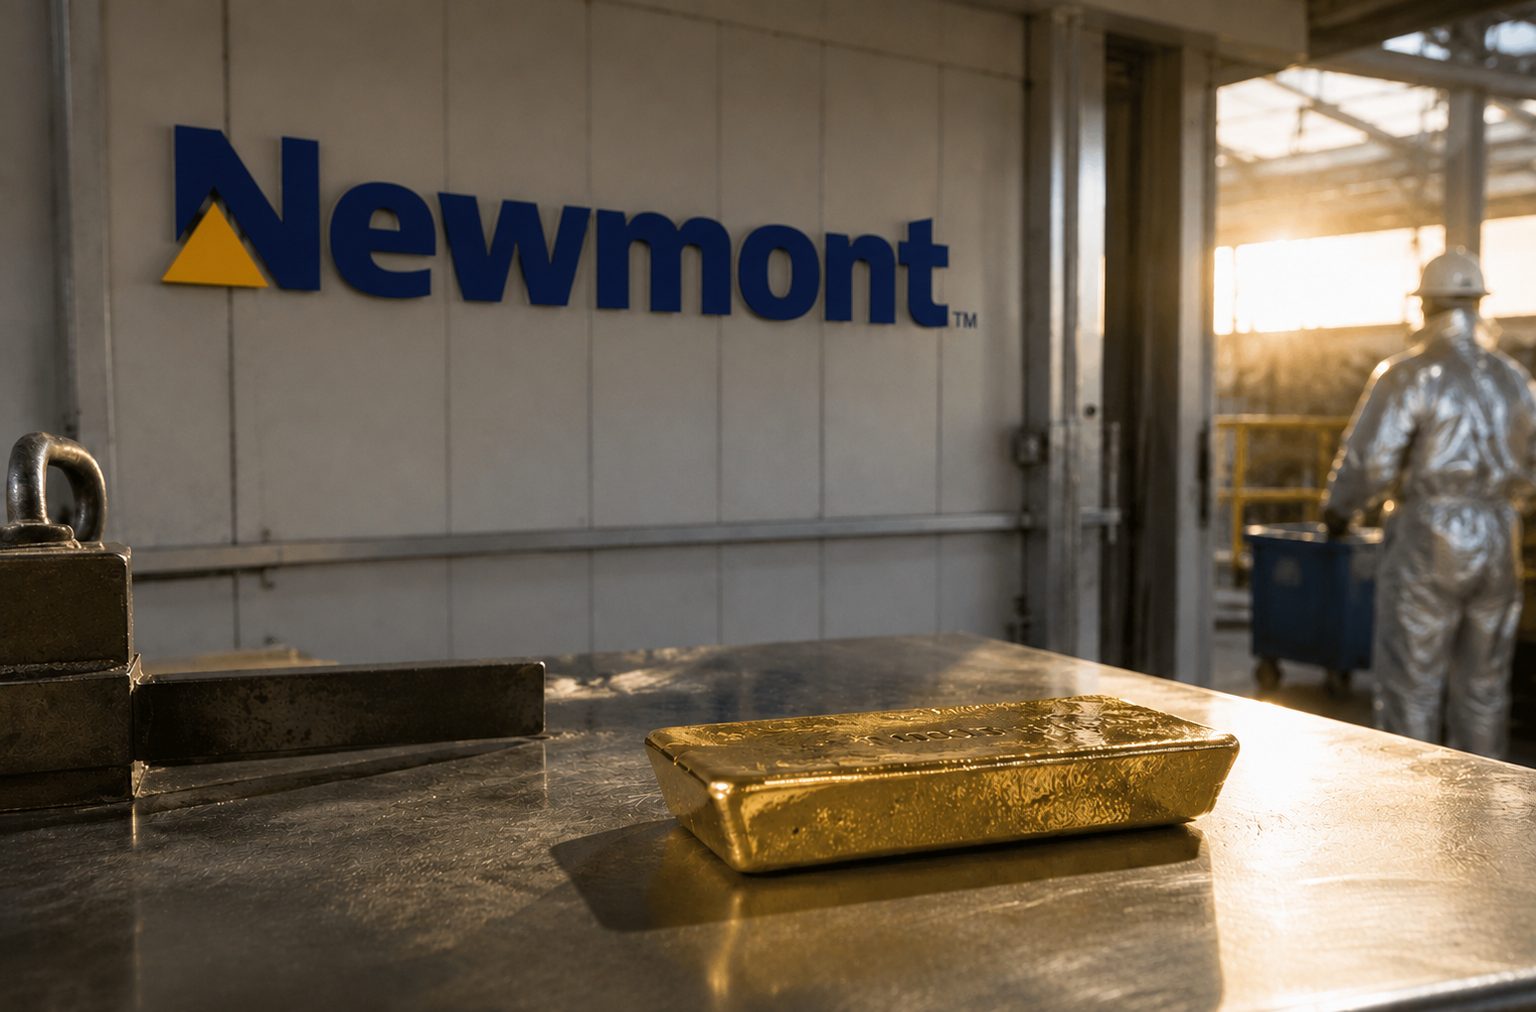

NEW YORK, August 19, 2026, 11:28 EDT — U.S. cash markets are trading.
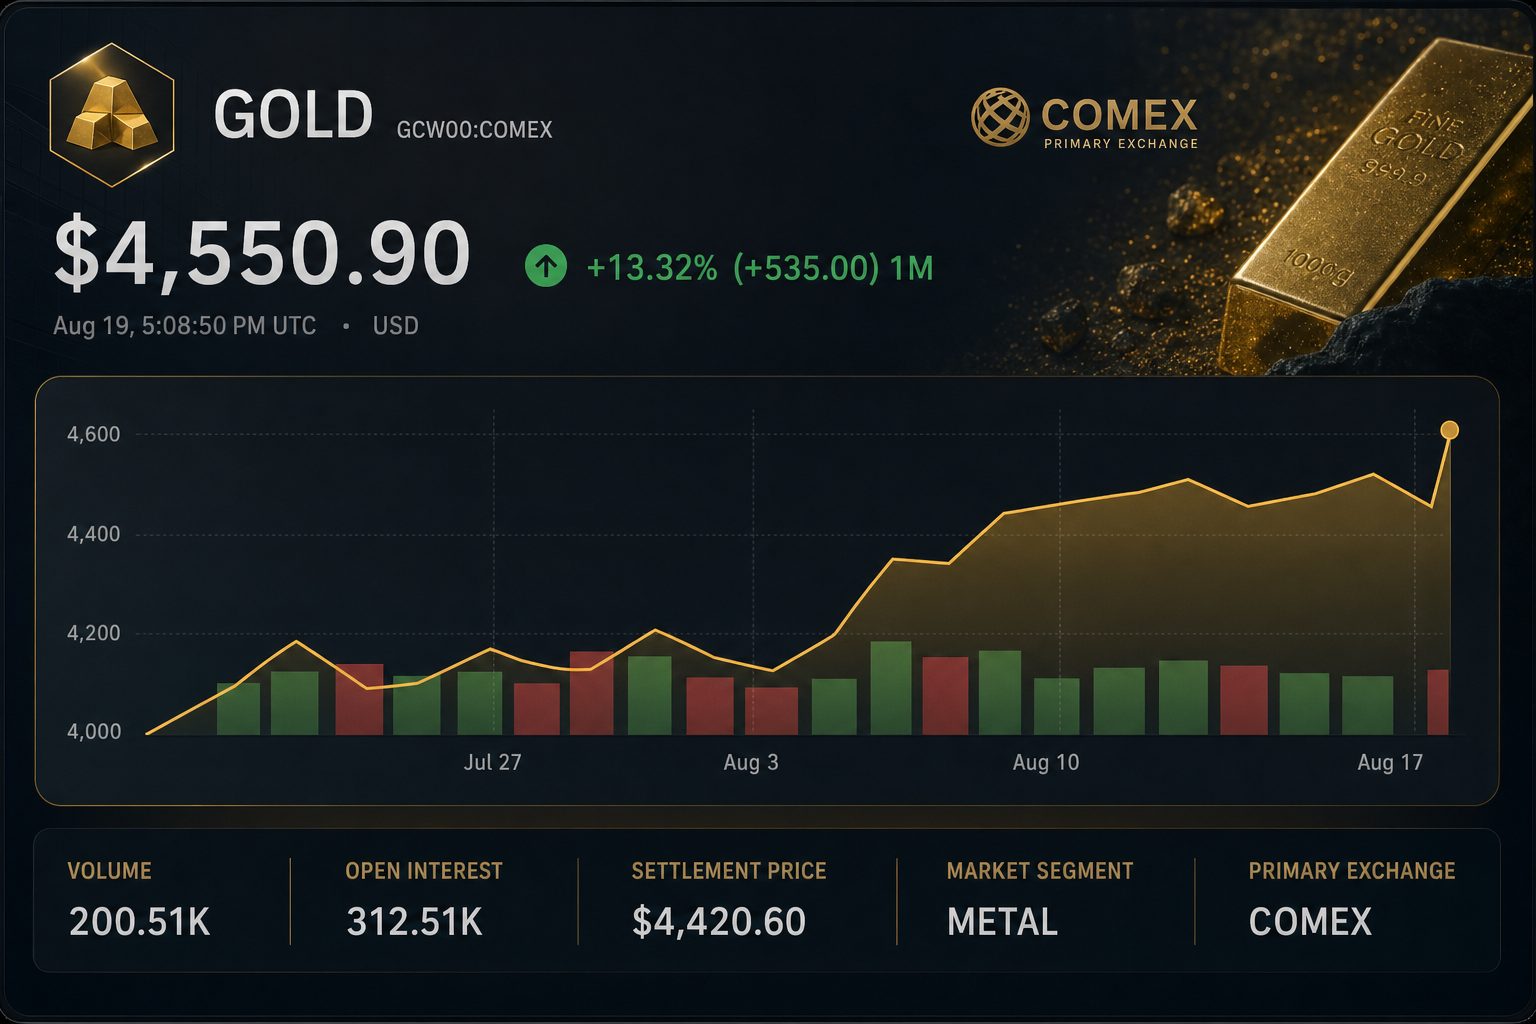
- Spot gold gained 3.5% to $4,486.88, reaching its peak since June 4.
- The VanEck Gold Miners ETF rose 9.09%, close to triple the gain seen in GLD.
- Present bullion prices are $2,621–$3,028 higher than the most recent quarterly AISC reported by three leading miners.
Gold rose to its highest level in 10 weeks on Wednesday, following a Treasury-market intervention that sent long-term yields and the dollar lower. Spot gold increased by 3.5% to $4,486.88 per ounce at 10:35 EDT, after reaching an earlier high of $4,491.16, its strongest since June 4.
Equities delivered the more significant signal. VanEck Gold Miners ETF NYSEARCA:GDX was up 9.09% as of 11:28 EDT. Meanwhile, SPDR Gold Shares NYSEARCA:GLD advanced 3.18% during the same period. The 2.86-to-one ratio indicates investors sought exposure to mining equities as leveraged bets on gold, rather than simply following price movements in bullion.
| Market exposure | Price | Session move | Move ÷ GLD |
|---|---|---|---|
| Spot gold | $4,486.88/oz | up 3.50% | 1.10× |
| U.S. gold futures | $4,546.10/oz | up 2.80% | 0.88× |
| SPDR Gold Shares NYSEARCA:GLD | $411.21 | up 3.18% | 1.00× |
| VanEck Gold Miners ETF NYSEARCA:GDX | $97.04 | up 9.09% | 2.86× |
| Agnico Eagle Mines NYSE:AEM | $205.20 | up 9.77% | 3.07× |
| Newmont Corporation NYSE:NEM | $125.79 | up 8.45% | 2.66× |
| Barrick Mining Corporation NYSE:B | $45.17 | up 7.32% | 2.30× |
The trigger was out of the ordinary. The U.S. Treasury announced it would increase some liquidity-support buybacks for longer-maturity bonds twofold. The dollar index dropped 0.8%, and the 30-year Treasury yield pulled back steeply from a 19-year peak. Declining yields lower the cost of holding non-interest-bearing gold.
“This was totally unexpected,” said Robert Gottlieb, who previously led precious metals at Koch Supply and Trading. He described the action as bullish, noting that a drop in long-term yields might put pressure on the dollar. According to TD Securities, the policy shift delivered a “jolt of life” to metals. Reuters
The greater reaction from miners is attributed to operating leverage. AISC tracks production and sustaining costs, but definitions may vary by company. At the spot price on Wednesday, three major producers reported preliminary price-minus-AISC margins exceeding $2,600 per ounce.
| Producer | Latest quarterly AISC | Spot less AISC | Implied buffer |
|---|---|---|---|
| Agnico Eagle Mines | $1,459/oz | $3,028/oz | 67.5% |
| Newmont | $1,621/oz | $2,866/oz | 63.9% |
| Barrick Mining | $1,866/oz | $2,621/oz | 58.4% |
Agnico delivered second-quarter output of 855,816 ounces and reported free cash flow of $1.34 billion. Newmont’s production reached nearly 1.3 million ounces, with free cash flow totaling $2.2 billion. Barrick’s output stood at 796,000 ounces, and its AISC increased by 11% compared to the previous year.
The order of costs is important. Every $100 fluctuation in gold equates to about 2.2% of spot prices now. For Agnico, this is equivalent to 3.3% of its provisional buffer, compared with 3.8% for Barrick. Producers with lower costs are therefore better shielded if Wednesday’s price shift is undone.
| Producer | Q2 gold output | Q2 free cash flow | 2026 production outlook |
|---|---|---|---|
| Agnico Eagle | 855,816 oz | $1.34B | Guidance points to low end of 3.3–3.5M oz range |
| Newmont | 1.29M oz | $2.20B | Estimated at roughly 5.26M oz |
| Barrick Mining | 796,000 oz | $515M | Expected at 2.9–3.25M oz |
Exposure also depends on the strength of balance sheets. At the end of June, Agnico had $3.27 billion in net cash. Newmont posted $3.4 billion in net cash along with $13 billion in available liquidity. Barrick’s cash holdings stood at $5.93 billion, offset by $4.68 billion in debt.
While analysts mostly hold a positive outlook, Wednesday’s surge absorbed a significant portion of the stated upside for Newmont and Agnico. Barrick continues to show the largest difference compared with consensus. Providers differ in their methodologies and the timing of their updates.
| Producer | Buy | Hold | Sell | Average target | Upside at 11:28 EDT |
|---|---|---|---|---|---|
| Newmont | 20 | 2 | 1 | $129.27 | 2.8% |
| Agnico Eagle | 18 | 3 | 1 | $214.98 | 4.8% |
| Barrick Mining | 18 | 4 | 0 | $52.46 | 16.1% |
The surge extended to other precious metals. Silver advanced 3.69%, platinum rose almost 4%, and palladium climbed 2.8%. That widespread movement points to a real-rates driver instead of a catalyst tied to individual mining companies.
The next key event comes soon. The Federal Reserve will release its minutes at 14:00 EDT. Before the release, futures markets indicated a 65% chance that rates would remain steady in September. A stronger signal on inflation may push yields higher and partially undo gold’s recent breakout.
Risks: Gold prices continue to be influenced by real yields, the strength of the dollar and geopolitical trends. In mining, additional risk factors include fuel, royalties, grades, labor, and country-related issues. Barrick may face pressure from rising costs, Agnico is impacted by changes to the Canadian Malartic mine plan, and Newmont’s capital spending is expected to be more weighted towards the second half, all of which could erode operating leverage.
For investors, the equity multiplier holds more significance than Wednesday’s 10-week high. Bullion made strong gains, while mining stocks jumped to nearly triple that movement. Maintaining this divergence now depends on the metal retaining its yield-related advance and producers safeguarding their substantial cost margins.
Related articles: NYSE:NEM





The miner multiplier is the real signal
Gold broke to a 10-week high. Mining shares moved almost three times as much, turning a rates rally into an operating-leverage trade.
| Miner | Buy | Hold | Sell | Avg target | Upside |
|---|---|---|---|---|---|
| Newmont | 20 | 2 | 1 | $129.27 | 2.8% |
| Agnico Eagle | 18 | 3 | 1 | $214.98 | 4.8% |
| Barrick | 18 | 4 | 0 | $52.46 | 16.1% |