Friday close
$5.80
+1.05%
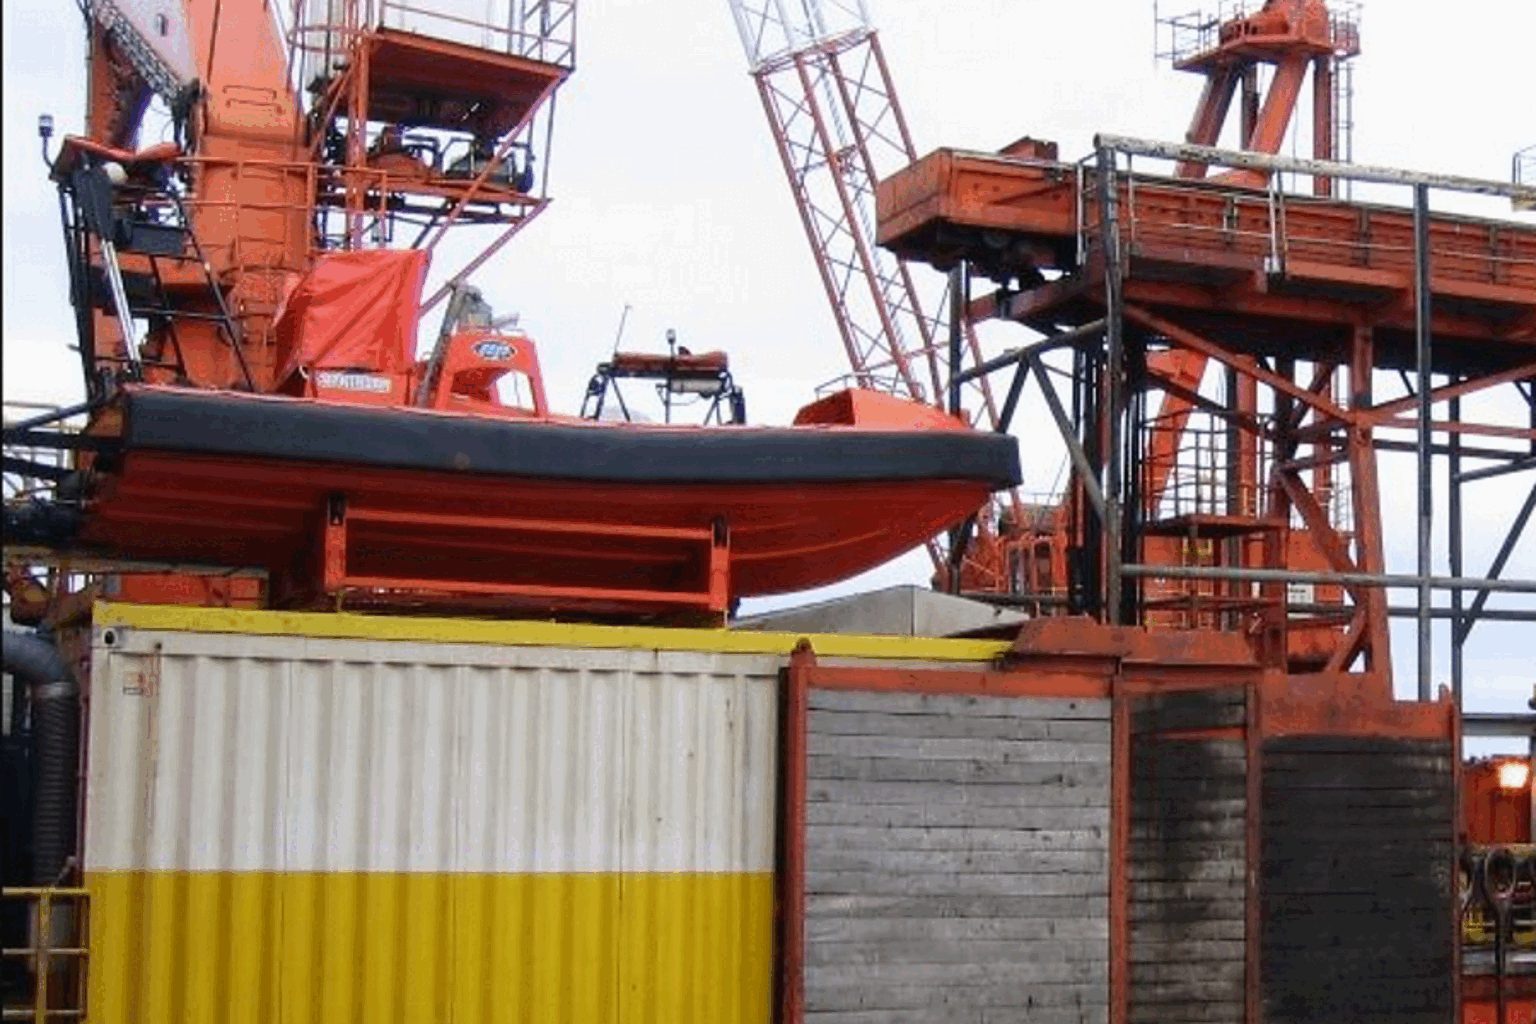
Transocean Ltd. closed up 1.05% at $5.80 on Friday. The advance added to a rally supported by stronger cash flow.
| Measure | Value | Investor read |
|---|---|---|
| Debt principal | $5.11B | 73% of equity value |
| Liquidity | >$1.3B | Operating cushion |
| Backlog | $6.7B | Revenue visibility |
| 2026 interest guide | $475M | Main cash drag |
Free cash flow rose 56% sequentially even as revenue fell 11%. Stronger working capital and lower capital spending outweighed weaker utilization.
| Deal measure | Figure |
|---|---|
| Transaction value | $5.8B, all stock |
| Combined fleet | 73 rigs |
| Targeted synergies | >$200M |
| Expected close | Second half 2026 |
Positive cash generation supports the rally, but one quarter does not settle the leverage case. Watch contract approvals, utilization, merger timing, integration costs and whether debt falls faster than the offshore cycle softens.
| Company | Friday | Market value | Signal |
|---|---|---|---|
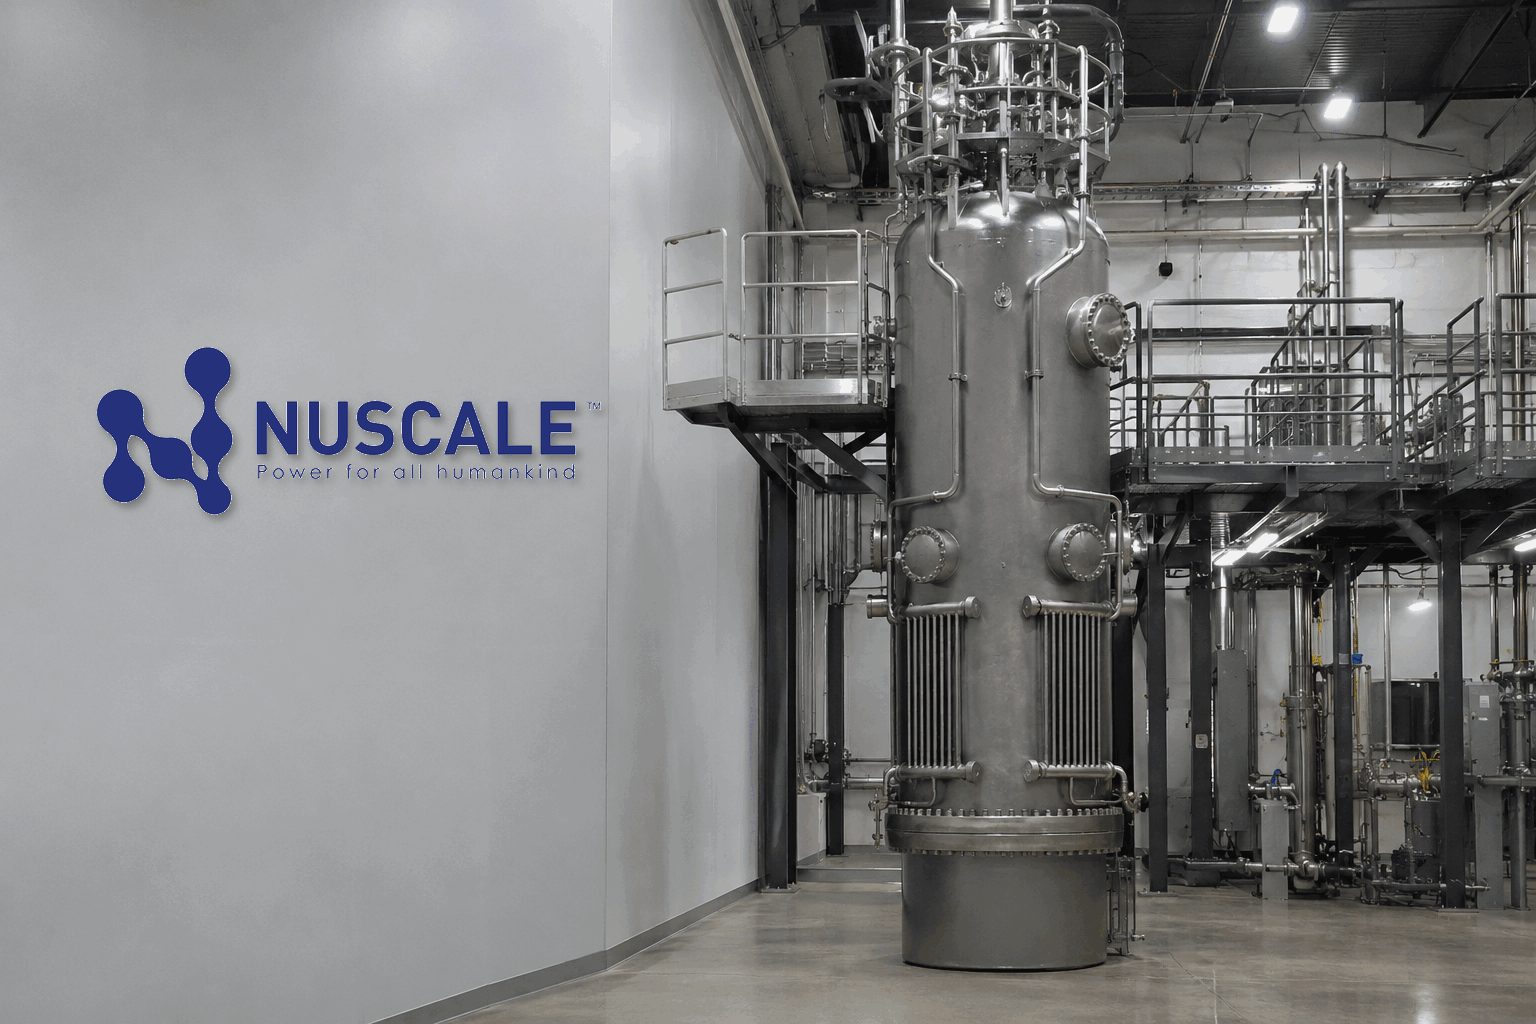
| NuScale | −4.62% | $3.99B | Approved design, pre-commercial |
| Oklo | −5.64% | $7.07B | Advanced-reactor developer |
| Nano Nuclear | −6.60% | $0.94B | Microreactor developer |
| Cameco | −5.94% | $43.47B | Operating fuel supplier |
Sources: NuScale Q2 2026 results; Google Finance and StockAnalysis market data; Barron's analyst data; Reuters macro reporting. Historical figures, not investment advice.

| Measure | Q2 2026 | Change |
|---|---|---|
| Revenue | $30.4M | −50% |
| Adjusted EBITDA | −$23.7M | from +$6.6M |
| Operating loss | −$140.8M | from +$10.8M |
| Unrestricted cash | $698M | Aug. 7 |
| Unencumbered Bitcoin | $121M | 1,861 BTC |
Categories overlap with development stages as disclosed by Keel; signed-tenant economics remain undisclosed.
| Buy / Hold / Sell | 7 / 1 / 0 |
| Average target | $6.71 |
| Implied upside | 108% |
| Target range | $4.50–$10.00 |
Contract economics must become visible. The bull case needs paid work, stronger Latin American growth and Middle East recovery.
Risk watch: sanctions, in-kind payments, damaged PDVSA data and a renewed Middle East disruption.
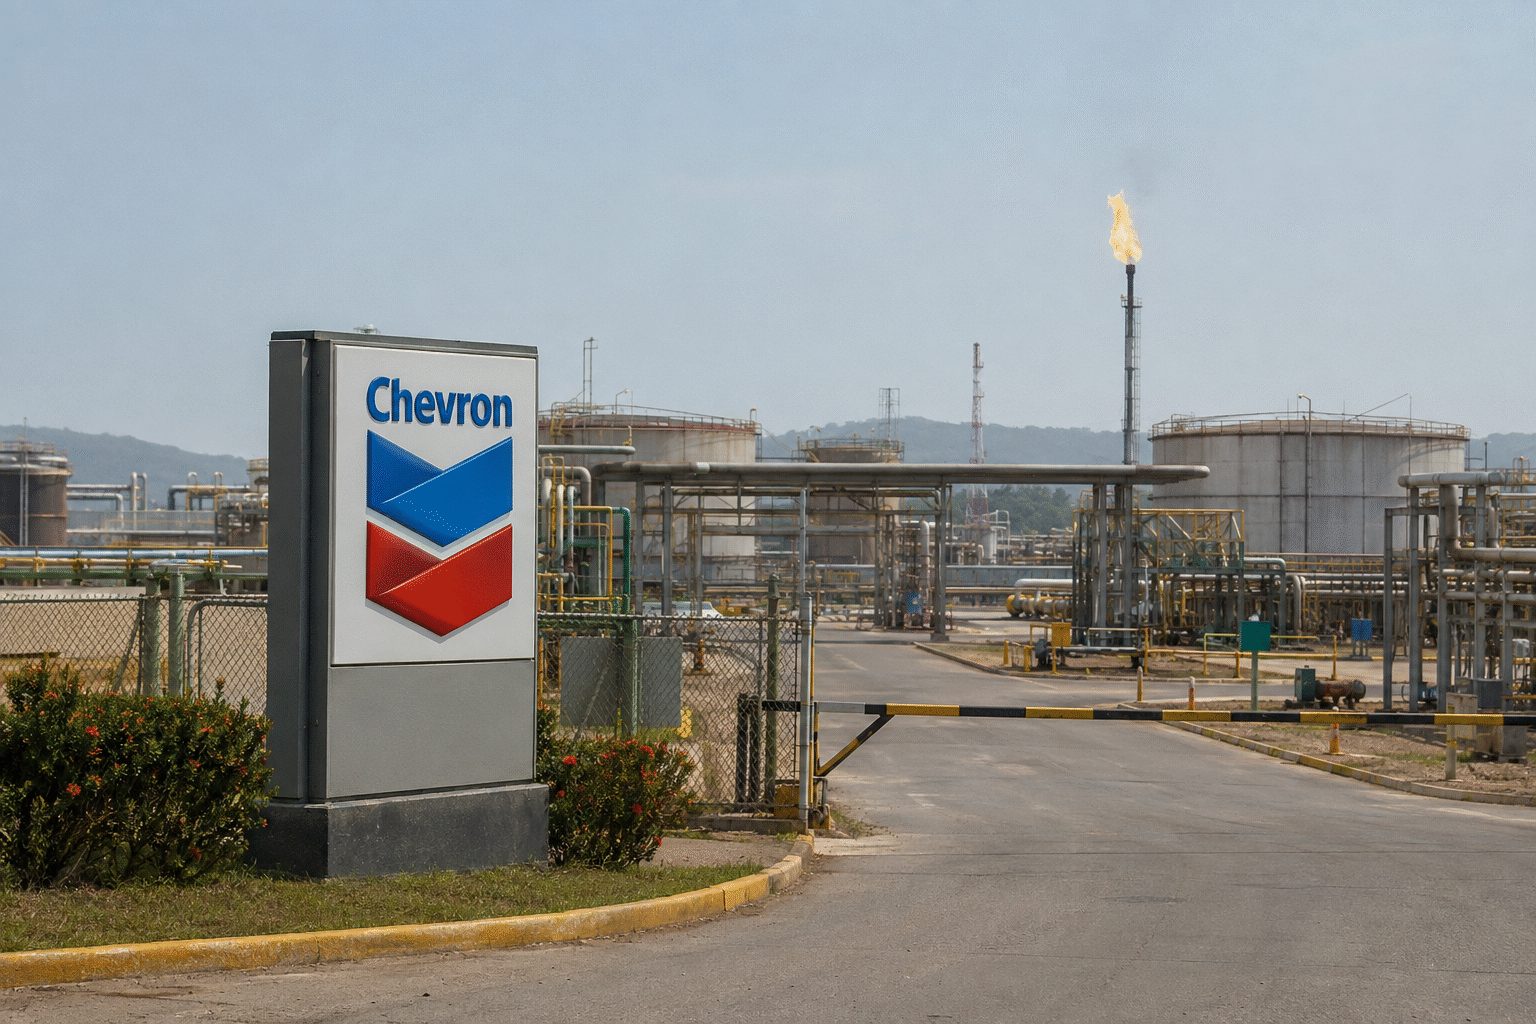
Chevron is nearing a Venezuela venture migration.
Reuters reported greater operating control at Petropiar, expansion into Ayacucho 8 and a second possible Orinoco project. Chevron declined comment.
Next checkpoint: reported signing expected Wednesday, Sept. 2.
| Instrument | Close | Day | Read-through |
|---|---|---|---|
| Chevron | $201.86 | +1.05% | Venezuela optionality |
| Exxon Mobil | $156.71 | +0.17% | Lagged Chevron |
| ConocoPhillips | $130.35 | +0.64% | Positive energy tape |
| S&P 500 | 7,711.76 | −0.25% | Chevron outperformed |
Illustrative weekly path anchored to verified Friday settlements and weekly changes. Brent fell faster, but retained a $5.91 global-supply premium.
22–24 mb/d
5–6 mb/d
Recovery is substantial, not complete. Shipping visibility remains imperfect.
| Instrument | Latest | Day | Week |
|---|---|---|---|
| WTI futures | $83.40 | -0.2% | -4.2% |
| Oct. Brent futures | $89.31 | -0.4% | -5.4% |
| Brent CFD reference | $88.29 | -0.26% | n/a |
| Gasoline reference | $3.47 | +2.55% | n/a |
| Heating-oil reference | $4.35 | +1.55% | n/a |
Equal headline growth implies limited tightening unless disruptions remove supply.
| OPEC June measure | Level | Vs 5-year avg. |
|---|---|---|
| OECD commercial oil | 2,729 mb | -66.5 mb |
| OECD commercial crude | 1,296 mb | -54.2 mb |
| Forward cover | 58.7 days | -1.9 days |
Low stocks increase price sensitivity if tanker flows weaken again.
Producers: sustained Brent below $90 pressures upstream cash generation and distributions.
Refiners: crude weakness can help while diesel and gasoline cracks remain firm.
Transport: lower crude offers cost relief, but product tightness delays pass-through.
Inflation: fuel disinflation depends on wholesale product prices, not crude alone.
Sources: WSJ futures settlements, Aug. 28, 2026; Reuters on Iran's Strait statement, Aug. 28; OPEC August 2026 Monthly Oil Market Report; Trading Economics benchmark references. mb/d = million barrels per day.
Market data: August 28, 2026, 16:55 EDT · Financials: Q2 2026 / trailing twelve months
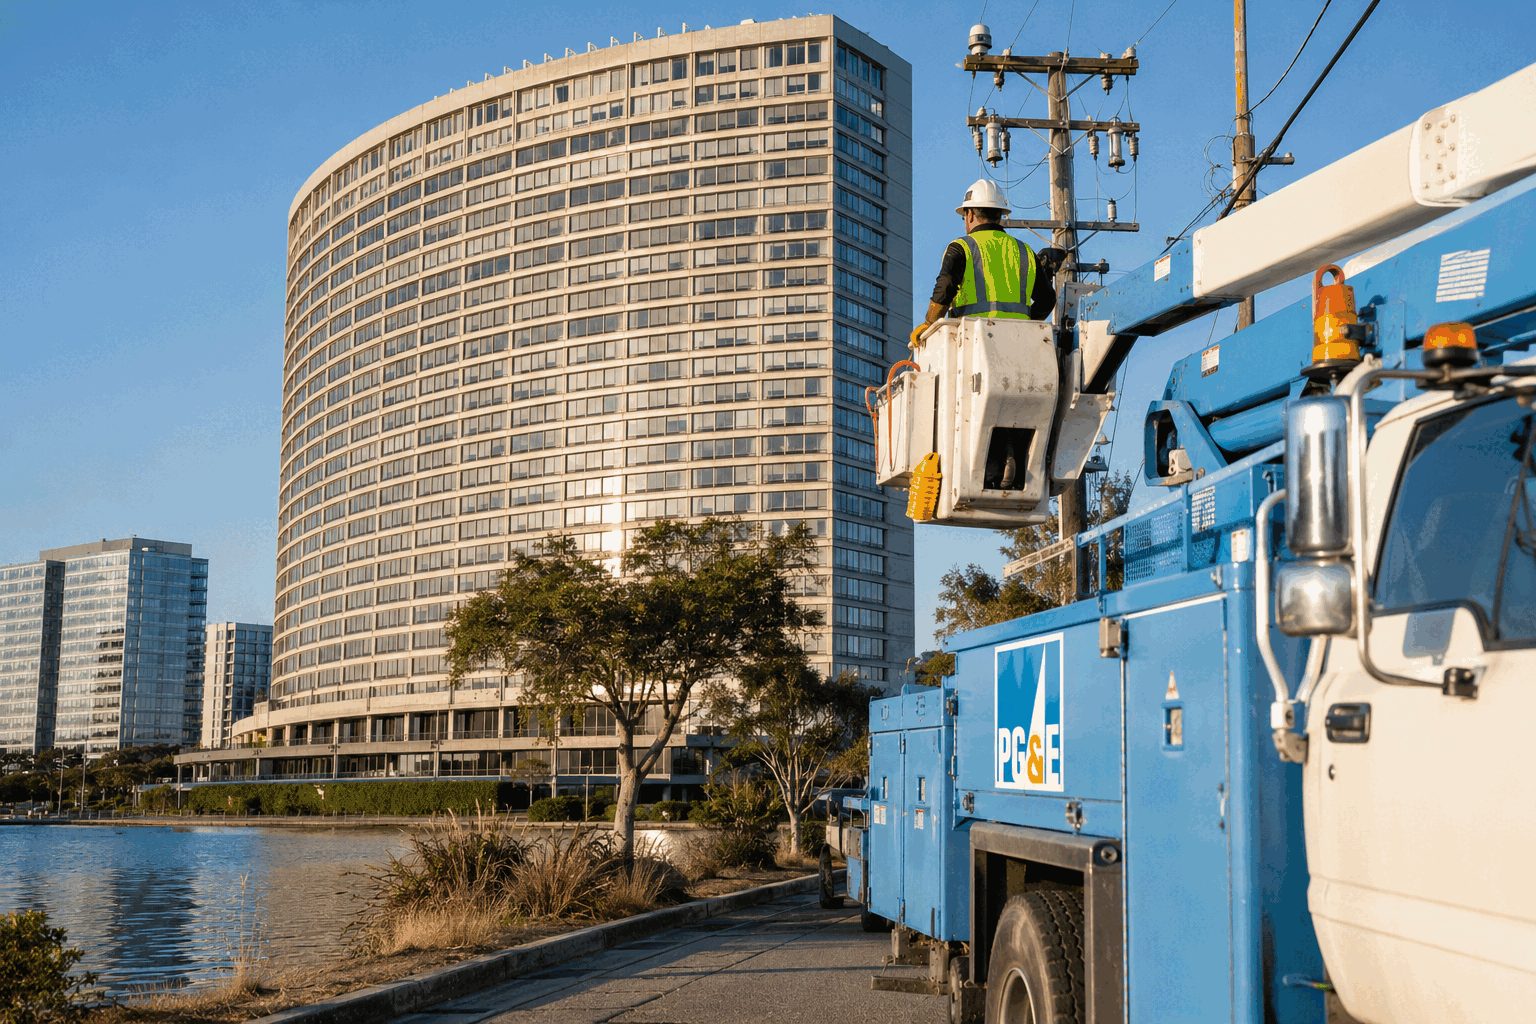
California-focused utilities underperformed as liability protection weakened.
| Metric | Figure | Investor signal |
|---|---|---|
| Q2 revenue | $5.90B | Regulated scale |
| Q2 net income | $733M | 12.42% margin |
| Trailing revenue | $25.84B | +5.3% reported |
| Trailing net income | $3.06B | 11.83% margin |
| Levered free cash flow | −$6.15B | Capital intensity |
| Cash | $972M | Limited versus system needs |
| Proposal | Legislative response | Investor channel |
|---|---|---|
| End insurer subrogation | Opposed | Claim exposure preserved |
| Cap some pain-and-suffering awards | Opposed | Future damages remain broader |
| Limit local-government recovery | Opposed | Infrastructure claims remain |
| Restrict CEO bonuses / raise safety fines | Broad agreement | Governance and cost pressure |
| Wildfire fund | $21B original size | Half shareholder-funded |
Average target implies 36.9% upside from Friday's close. Latest displayed rating: Morgan Stanley Equal-Weight, $22 target, August 21, 2026.
| Legislative session deadline | August 31, 2026 |
| Next estimated earnings date | October 22, 2026 |
| Forward dividend | $0.20 / 1.11% |
| Debt-to-equity | 189.45% |
| One-year stock return | +11.91% |
Prices are discounting better flow, not full normalization.
| Exposure | Price | Day | Read-through |
|---|---|---|---|
| USO | $129.44 | −0.44% | Direct crude exposure |
| XLE | $62.53 | +0.38% | Integrated energy resilient |
| XOP | $185.73 | +0.14% | Producers broadly steady |
| Measure | Reading | Weekly change |
|---|---|---|
| Commercial crude | 428.9M bbl | +0.095M |
| Cushing crude | — | +1.176M |
| Gasoline | 206.8M bbl | −2.536M |
| Distillates | 103.4M bbl | −2.228M |
| Refinery utilization | 97.4% | near flat |
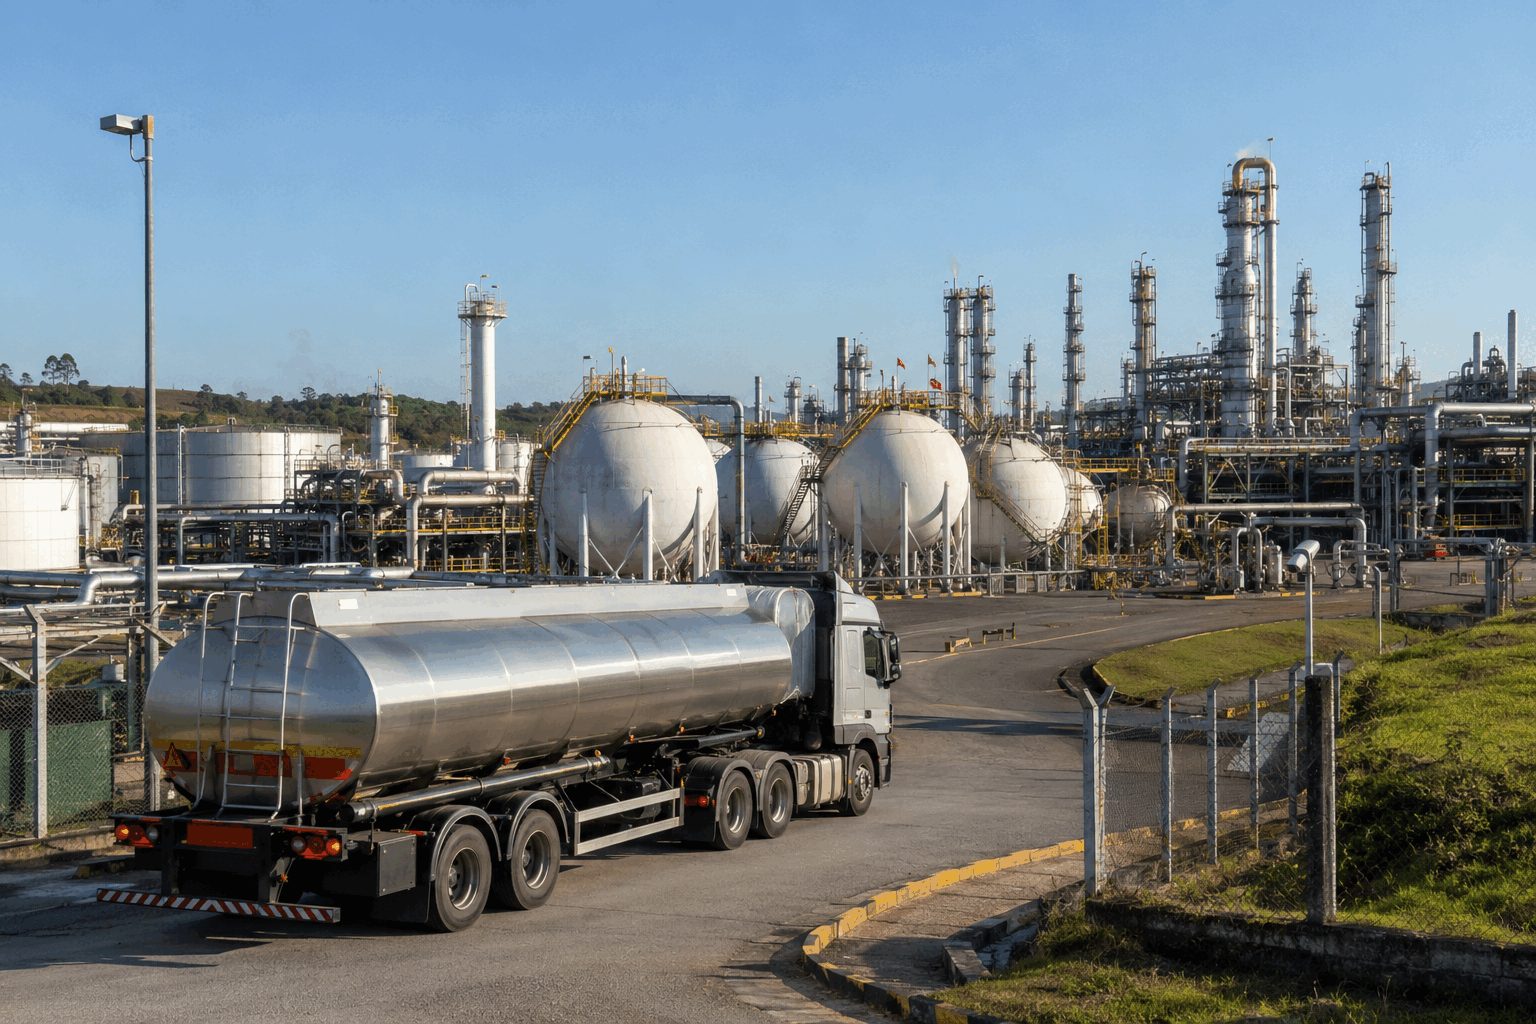
A large supplier-credit headline against a much larger debt problem.
The Petrobras line supports feedstock purchases; it is not a balance-sheet recapitalization.
| Signal | Reading | Investor interpretation |
|---|---|---|
| Market capitalization | ~$283M | Thin equity cushion |
| Enterprise value | ~$12.24B | Debt dominates valuation |
| Trailing net income | −$978M | Equity cannot absorb prolonged losses |
| Operating margin | 0.76% | Little room for feedstock or spread shocks |
| 52-week position | $1.64 vs $1.40–$5.39 | Relief rally near the low |
| Analyst posture | JPM Neutral; Citi Sell; BofA Underperform | Caution predates the new facility |
Petrobras lifted the supplier-credit ceiling by R$2.0 billion and kept 30-day payment terms through December. That improves feedstock continuity during restructuring.
The rally becomes durable only if operating continuity converts into a viable creditor agreement.
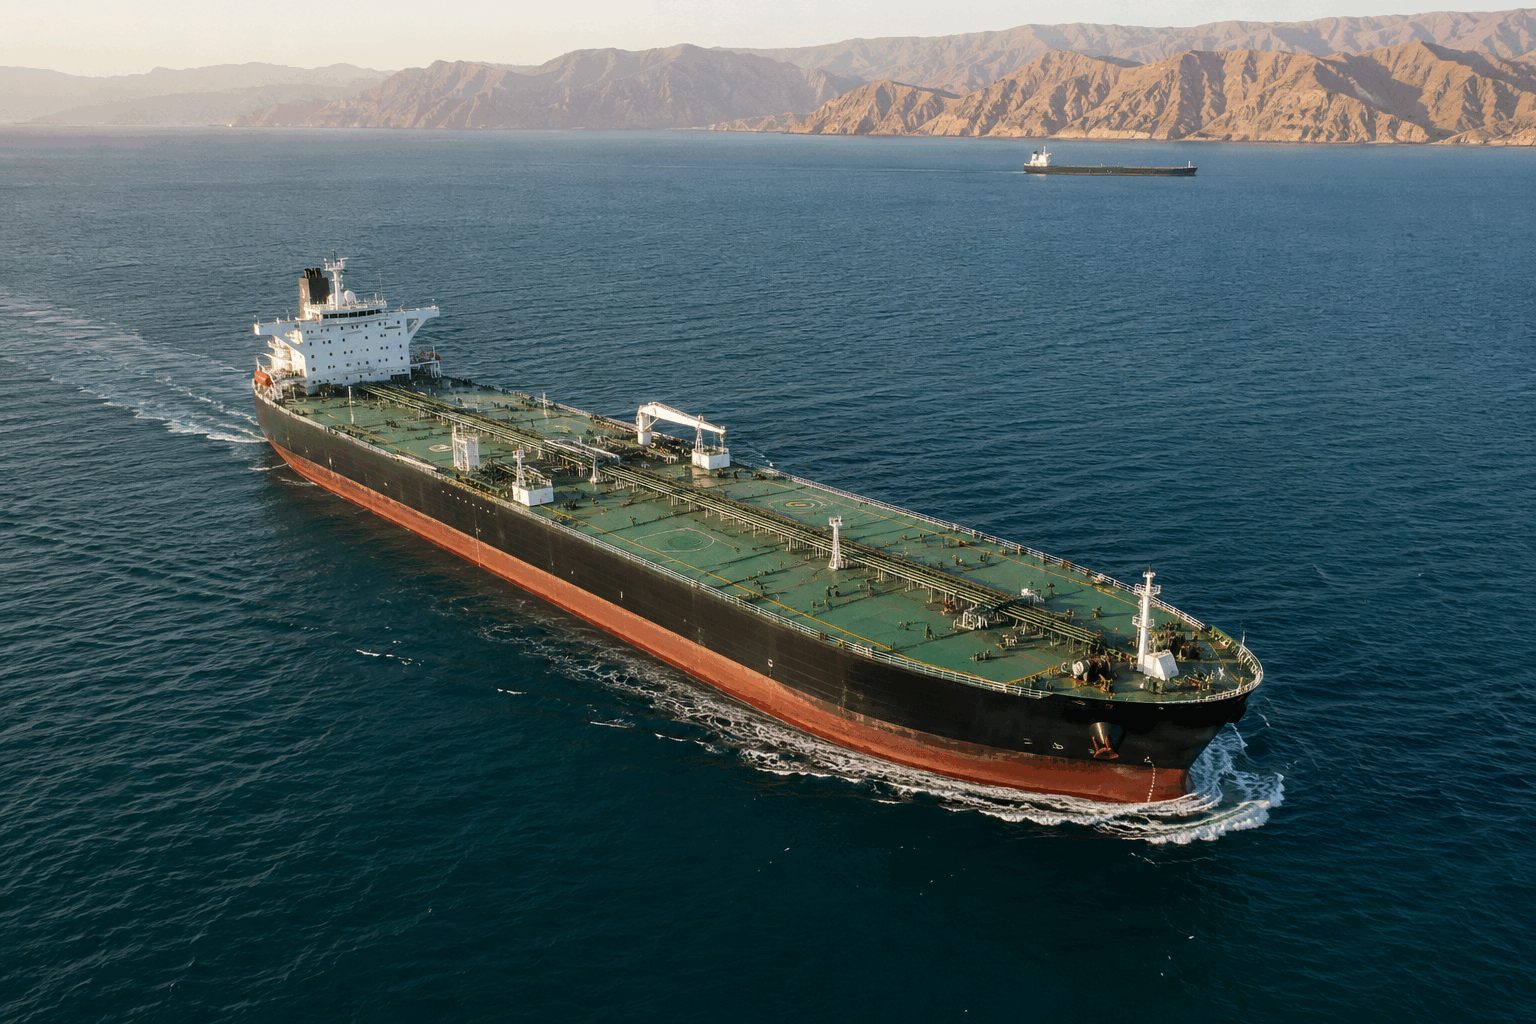
Settlement snapshot for August 27, 2026. Updated at 21:06 EDT / August 28, 03:06 CEST.
Brent settled 5.5% above EIA's third-quarter average and 15.0% above its fourth-quarter forecast.
| Commercial crude stocks | 428.9M bbl 1% above five-year average |
| Weekly crude change | +0.1M bbl |
| Gasoline stocks | −2.5M bbl 6% below five-year average |
| Refinery utilization | 97.4% |
| Refinery inputs | 17.4M b/d |
| Channel | Signal |
|---|---|
| Inflation | Upward Higher crude lifts refined-product and freight costs. |
| Airlines & transport | Margin risk Fuel hedges determine near-term sensitivity. |
| Producers | Cash-flow support WTI above $80 strengthens upstream economics. |
| Refiners | Mixed Feedstock rises while gasoline stocks remain tight. |
| Scenario | Price pressure | Evidence to watch |
|---|---|---|
| Verified Hormuz corridor | Downward | Higher tanker counts, lower freight and insurance rates. |
| Diplomacy remains stalled | Premium persists | Brent–WTI spread holds above $6. |
| Further military escalation | Sharp upside risk | Supply outages, shipping delays and wider refined-product cracks. |
| Demand disappoints | Offsets risk premium | Inventory builds and weaker refinery runs. |
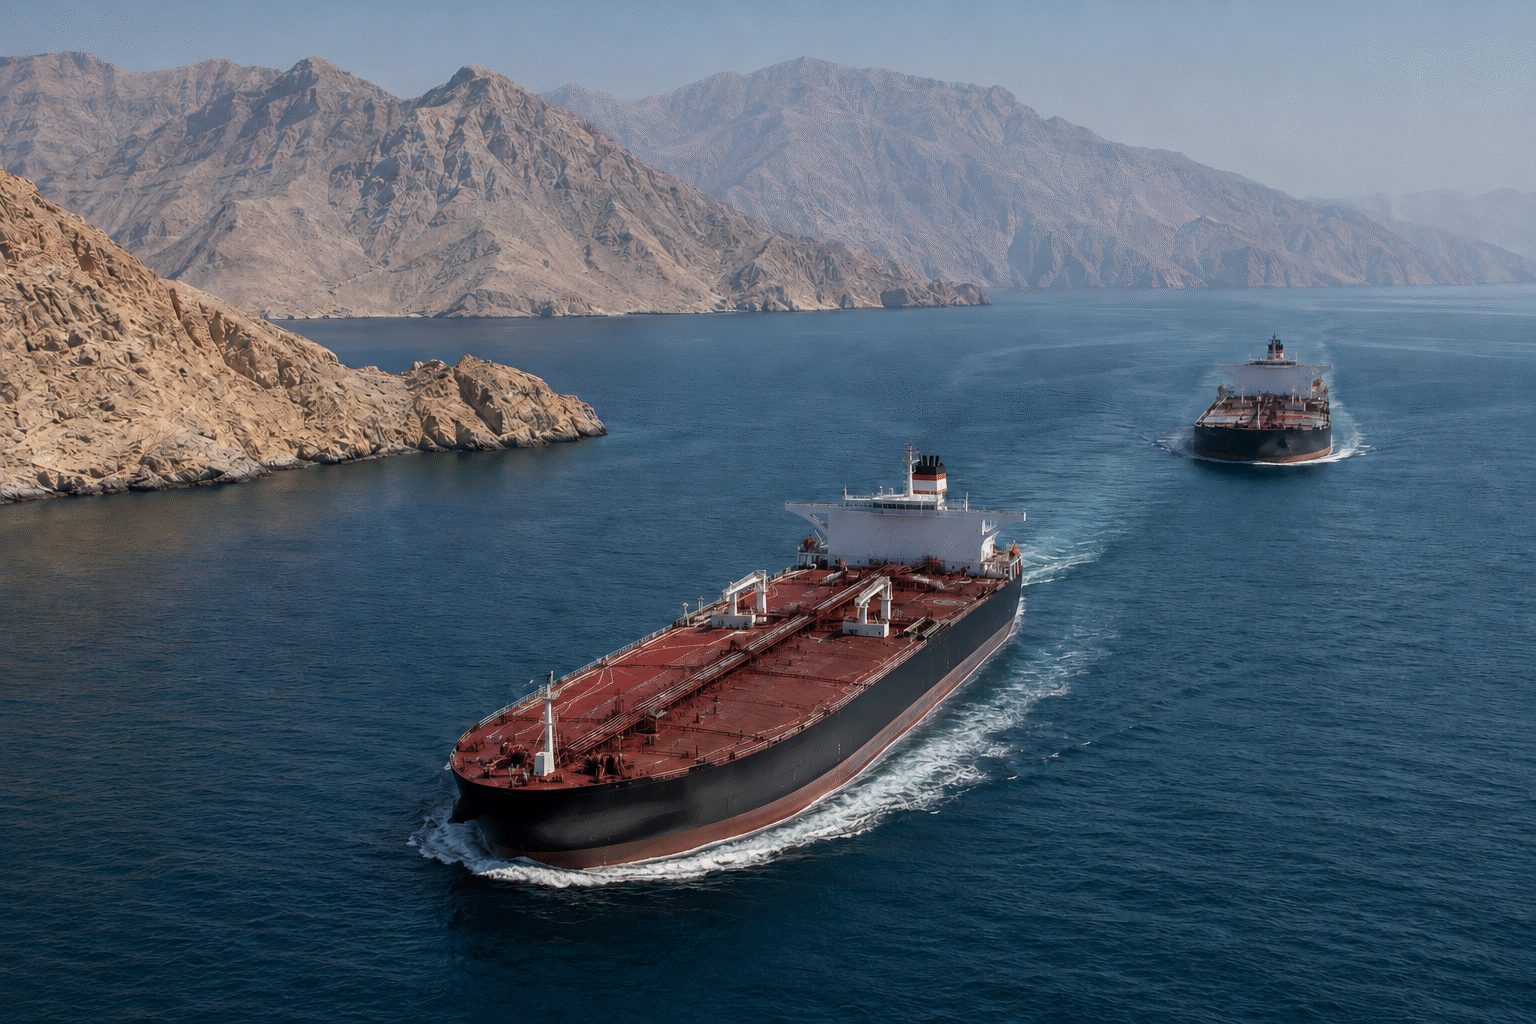
Transit count compares with a recent daily average of 15. Flow figures are million barrels per day.
| Signal | Latest reading | Investor channel | What changes the price |
|---|---|---|---|
| Iran–Oman framework | Details still being finalized | Geopolitical premium | Credible enforcement and sustained traffic |
| Qatar mediation | Tehran visit on Aug. 27 | Near-term volatility | Broader ceasefire or talks failure |
| U.S. crude stocks | 428.9m barrels; +95,000 | WTI balance | Build was 84% smaller than expected |
| Refinery utilization | 97.4% | Crude demand | Seasonal maintenance or margin compression |
| SPR releases | Sales ending soon | Inventory cushion | Lower state supply without Gulf recovery |
| Case | Reference | Brent implication | Direct exposures |
|---|---|---|---|
| Fast reopening | Traffic normalizes quickly | Pressure toward $78 Q4 EIA average | Negative oil beta; positive transport margins |
| Gradual reopening | EIA base path | Near $85 Q3 average | Balanced producer and consumer effects |
| Talks stall | Risk premium returns | Retest of $93.78 Aug. 20 level | Positive USO/XLE; inflation risk rises |
Scenarios frame transmission, not price targets. EIA forecasts Brent at $78 in 4Q26 and $69 in 2027.
Crude exposure: USO tracks near-term WTI futures and can diverge through roll costs.
Energy equities: XLE adds company execution, dividends and refining exposure.
Rates and inflation: Higher oil can lift inflation compensation and pressure duration assets.
Transport: Airlines, trucking and chemicals benefit when the premium falls.
Key risk: Futures are pricing better logistics before ship counts confirm them.
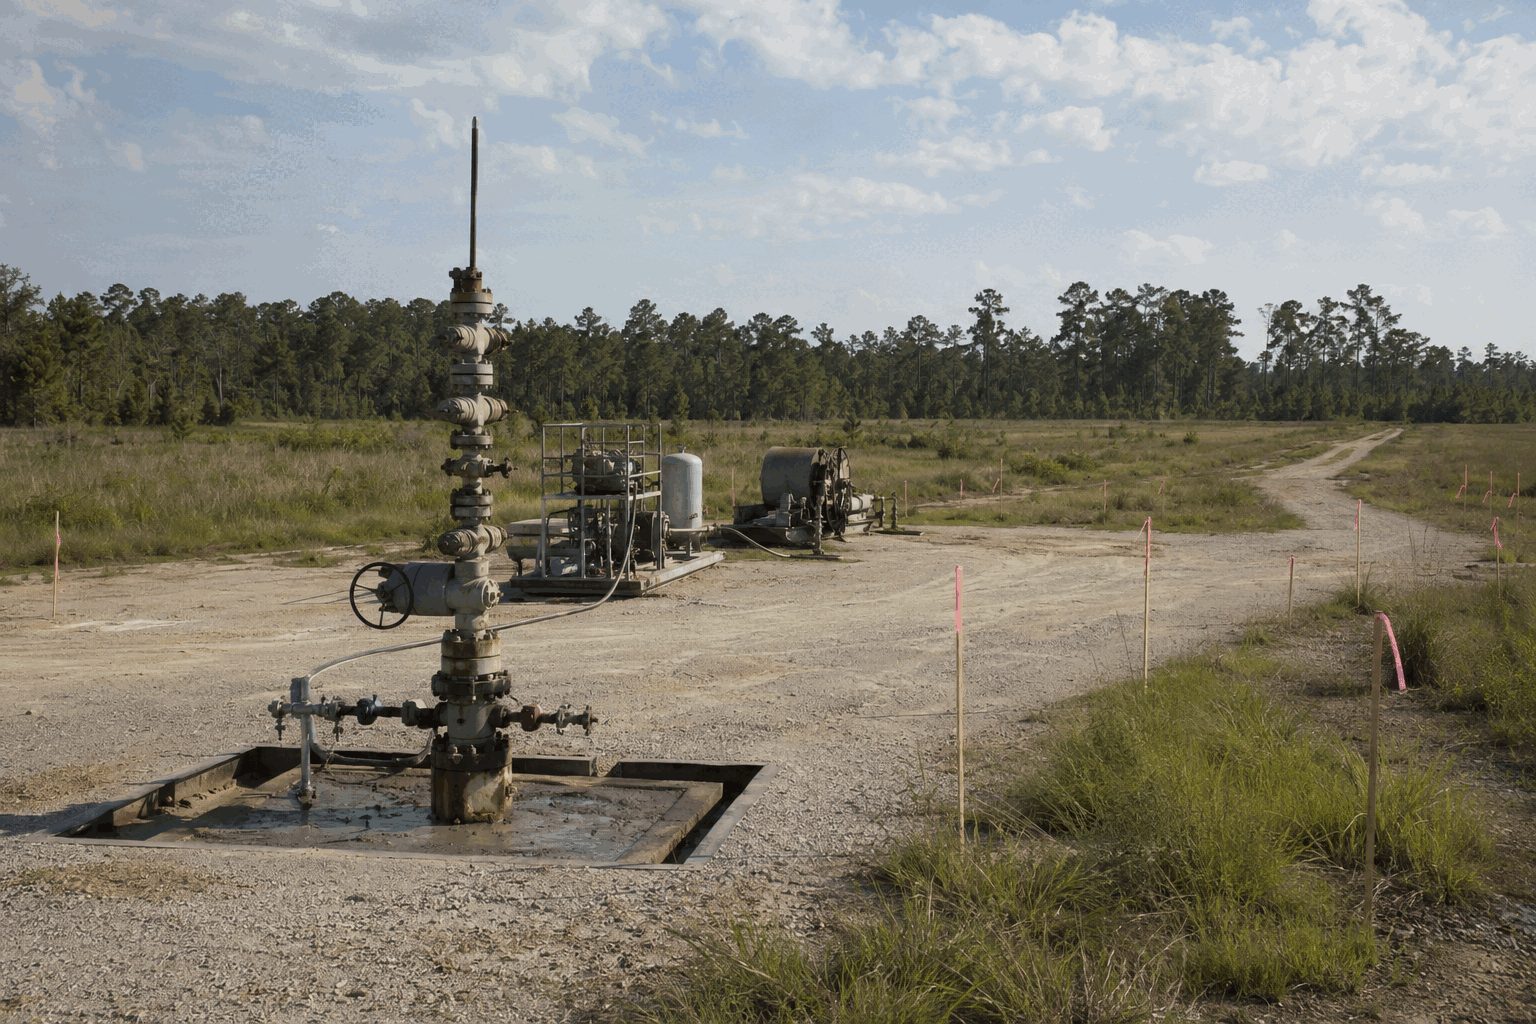
| Layer | Potential shares |
|---|---|
| Current common | 0.962M |
| Series A-1 conversion | 2.117M |
| Five-year warrants | 2.117M |
| Scenario total | 5.196M |

Market close · August 25, 2026 · 16:00 EDT
Ontario named uranium as possible trade leverage. Oklo rallied, though no cutoff or new Oklo contract was announced.
The session's added value equaled 6.7× Oklo's $126.9M first-half capital spending. That is a sentiment move, not realized cash flow.
| Metric | Amount |
|---|---|
| Cash + marketable securities | $3.01B |
| H1 ATM equity proceeds | $1.85B |
| H1 operating cash use | $65.5M |
| H1 capital spending | $126.9M |
| 2026 operating cash-use guide | $120–150M |
| 2026 PP&E guide | $400–500M |
Balance-sheet figures through June 30, 2026. Source: Oklo Form 10-Q and Q2 call.
| Measure | Target / view |
|---|---|
| Consensus | Buy · 15/9/1 |
| Average target | $79.88 · +80% |
| Median target | $81.50 · +84% |
| Truist | Hold · $51 |
| H.C. Wainwright | Buy · $90 |
| Canaccord | Buy · $100 |
Latest compiled targets available August 25; recent firm calls dated August 10.
Policy riskHALEU accessGroves executionAurora scheduleEquity dilution
Oklo has enough liquidity to fund near-term work, but its $8.23B value still depends on regulatory progress and future commercial deployment. The uranium threat supports the strategic case for domestic fuel. It does not itself create revenue. A reversal in trade rhetoric could therefore unwind part of Tuesday's gain.
Sources: Yahoo Finance close and volume; Oklo Q2 2026 Form 10-Q; Oklo Groves first-criticality release; Reuters and AP trade reporting; S&P Global analyst compilation. All market figures as of August 25, 2026, 16:00 EDT.
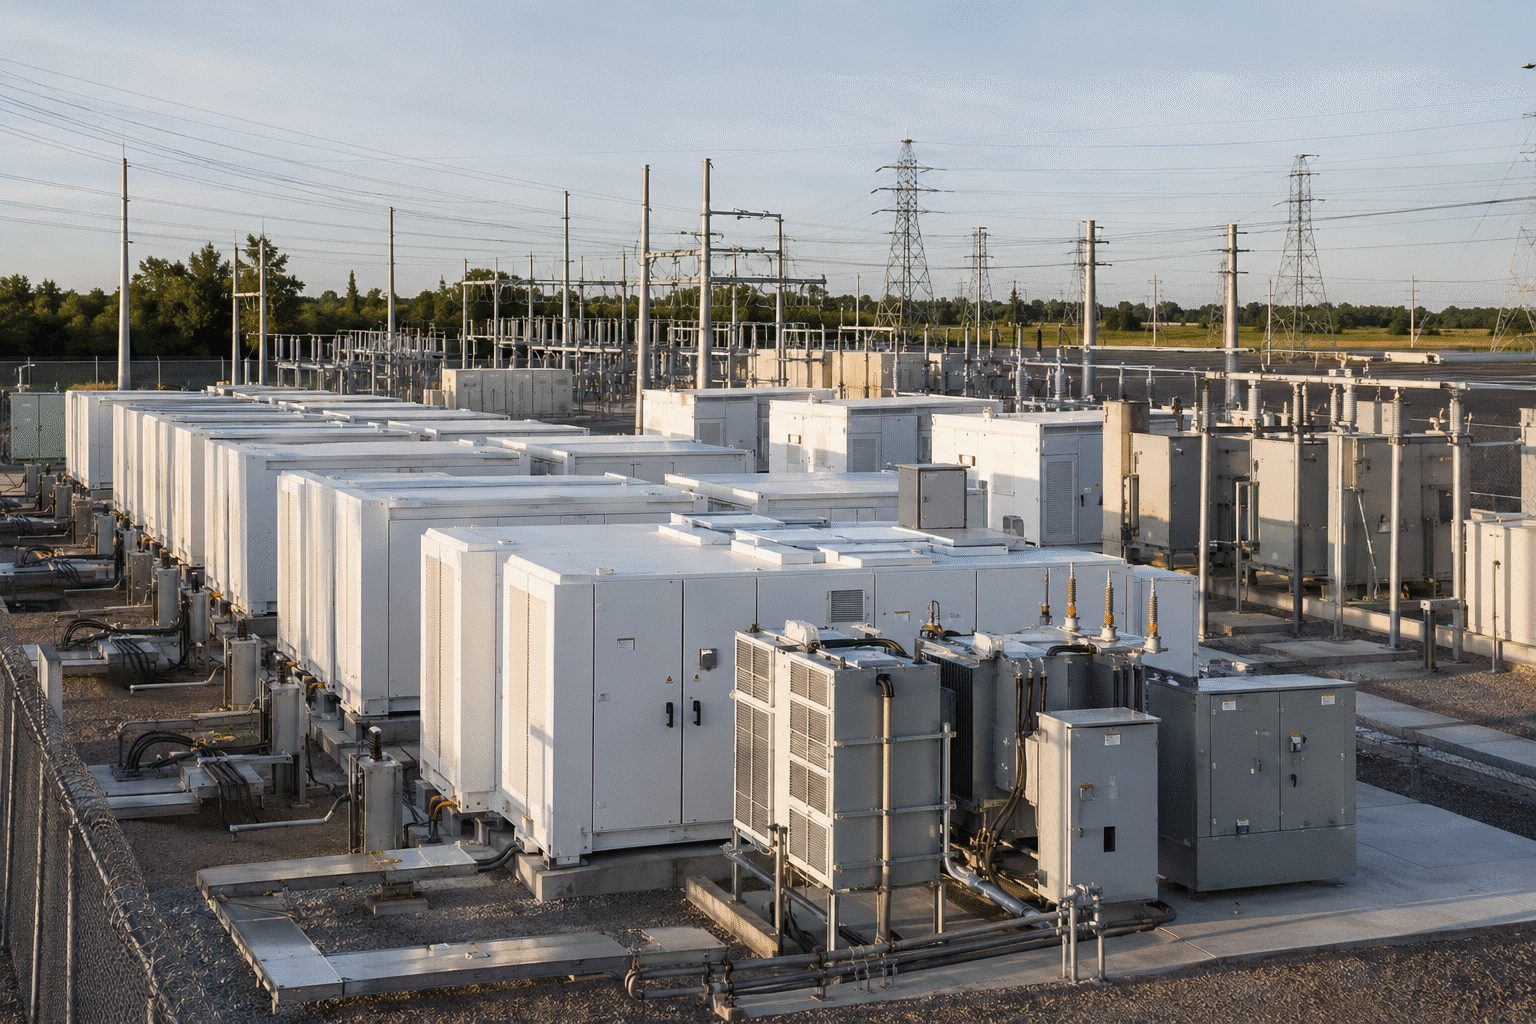
UBS moved to Neutral from Sell and raised its target to $12 from $9. The bank treats Fluence's guidance reset as an earnings trough, forecasting 22% annual revenue growth through 2030. The market's next proof point is whether $400 million of delayed project deliveries convert in fiscal 2027 without another margin setback.
Backlog conversion accelerates while new factories reach planned output.
Gross margin recovers from 5.1% as startup costs fade.
Another delay pushes revenue rightward and absorbs liquidity.
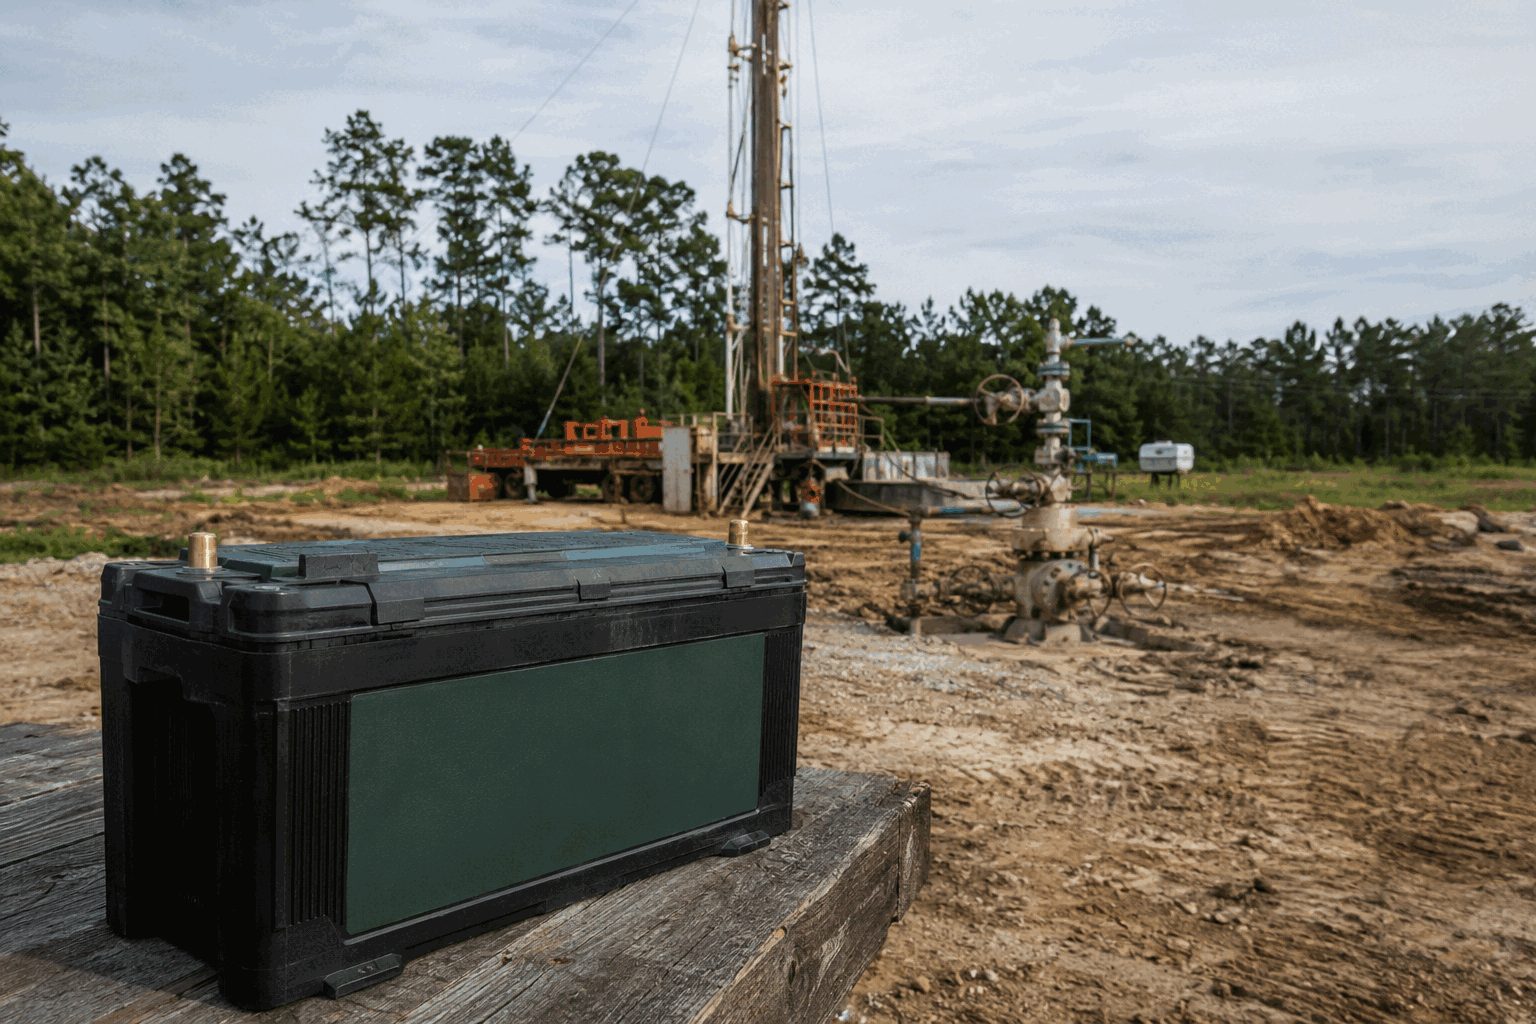
Financing relief meets a much larger dilution envelope.
Illustrative common equivalents at the initial $4.25 price. Additional closings require shareholder approval; later series may differ.
| Item | Amount | Read-through |
|---|---|---|
| Initial net proceeds | $8.20M | 5.3× June cash |
| Acquisition cash paid | $3.425M | 42% of proceeds |
| Maximum leasing commitment | $4.00M | 49% of proceeds |
| Acquisition + leasing | $7.425M | 91% of proceeds |
| First-half operating cash use | $2.607M | Before the pivot |
| Metric | Latest | Change/context |
|---|---|---|
| Q2 net sales | $2.03M | −32.1% year over year |
| Q2 gross margin | 32.4% | 20.8% a year earlier |
| H1 operating cash flow | −$2.61M | Cash use increased |
| June 30 cash | $1.54M | Before private placement |
| TTM revenue | $8.21M | As of Aug. 25 market snapshot |
Shareholder approvalConversion adjustmentsRegistration timingWell economics
No traditional analyst consensus or published price target was available on Aug. 25. P/E measures are not meaningful because earnings are negative.
| Security | Term | Investor significance |
|---|---|---|
| Initial debentures | $9M principal; 8% | Automatic preferred conversion after required approval and filing. |
| Series A-1 preferred | $4.25 initial conversion; 8% cumulative dividend from first anniversary | Conversion price can adjust for certain dilutive issues. |
| Initial warrants | 2,117,219 shares; $4.25 exercise; five years | Cashless exercise may apply when resale registration is ineffective. |
| Additional investment right | Up to $91M | Optional for investors; separate preferred series with substantially similar terms. |
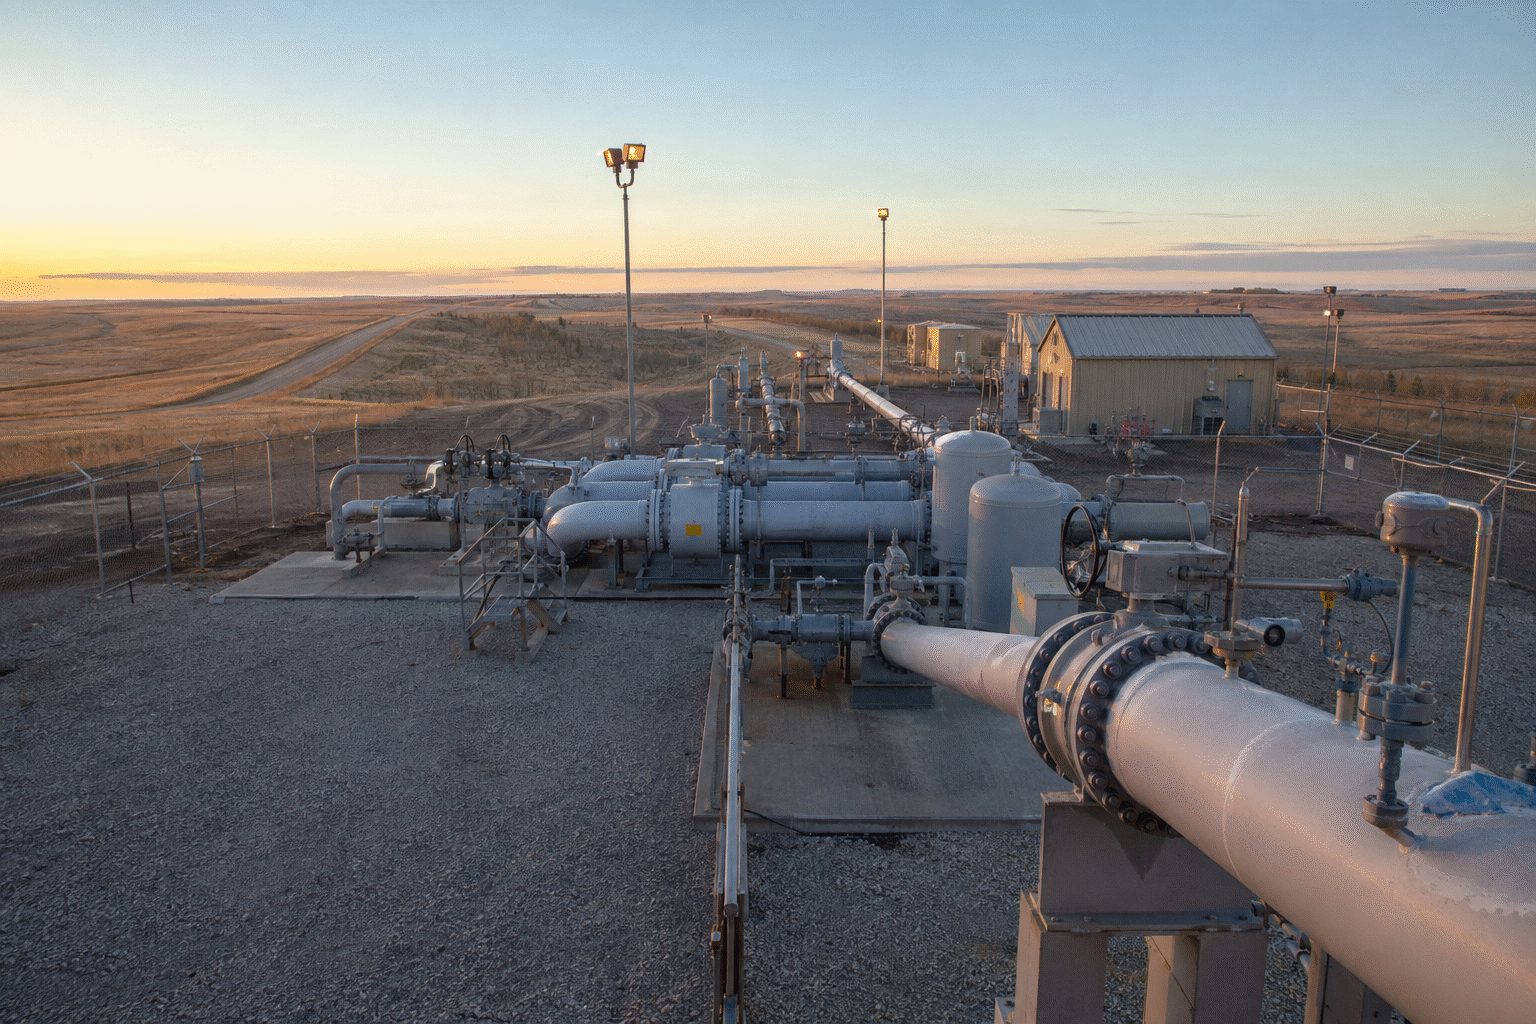
Prairie Connector is smaller than Keystone XL, already mostly contracted and still exposed to cross-border policy risk after U.S.-Canada trade talks collapsed.
Prairie Connector is 33.7% smaller than the original Keystone XL plan, but contracted service already covers 81.8% of proposed capacity.
U.S.-listed closes at 16:00 EDT. No fresh pipeline-breakthrough premium appeared.
| WTI settlement | $85.01/bbl |
| Daily move | −2.35% |
| Brent settlement | $92.17/bbl |
| Daily move | −2.35% |
| Timestamp | Aug. 24 settlement |
A broad crude selloff clouds the pipeline-specific equity signal.
| Year | Keystone flow | Change |
|---|---|---|
| 2024 | 624k bpd | Record |
| 2025 | 585k bpd | −6.3% |
| Prairie proposal | 550k bpd | 94% of 2025 flow |
2025 throughput was constrained after an April incident and reduced operating pressure.
| Driver | Investor consequence |
|---|---|
| 20-year contracts | Lower volume risk before financing. |
| Cross-border permit | Improves route credibility, but remains reversible. |
| 50% tariff conflict | Raises bilateral-policy and discount-rate risk. |
| Trans Mountain capacity | Reduces urgency for another U.S.-bound outlet. |
| Oil-production growth | Determines whether incremental capacity stays scarce. |
The proposal still needs multiple approvals, financing and a final investment decision. Route litigation, construction inflation, policy reversal and slower Canadian production growth could delay or weaken returns.
Read-through: commercially de-risked, politically unpriced.
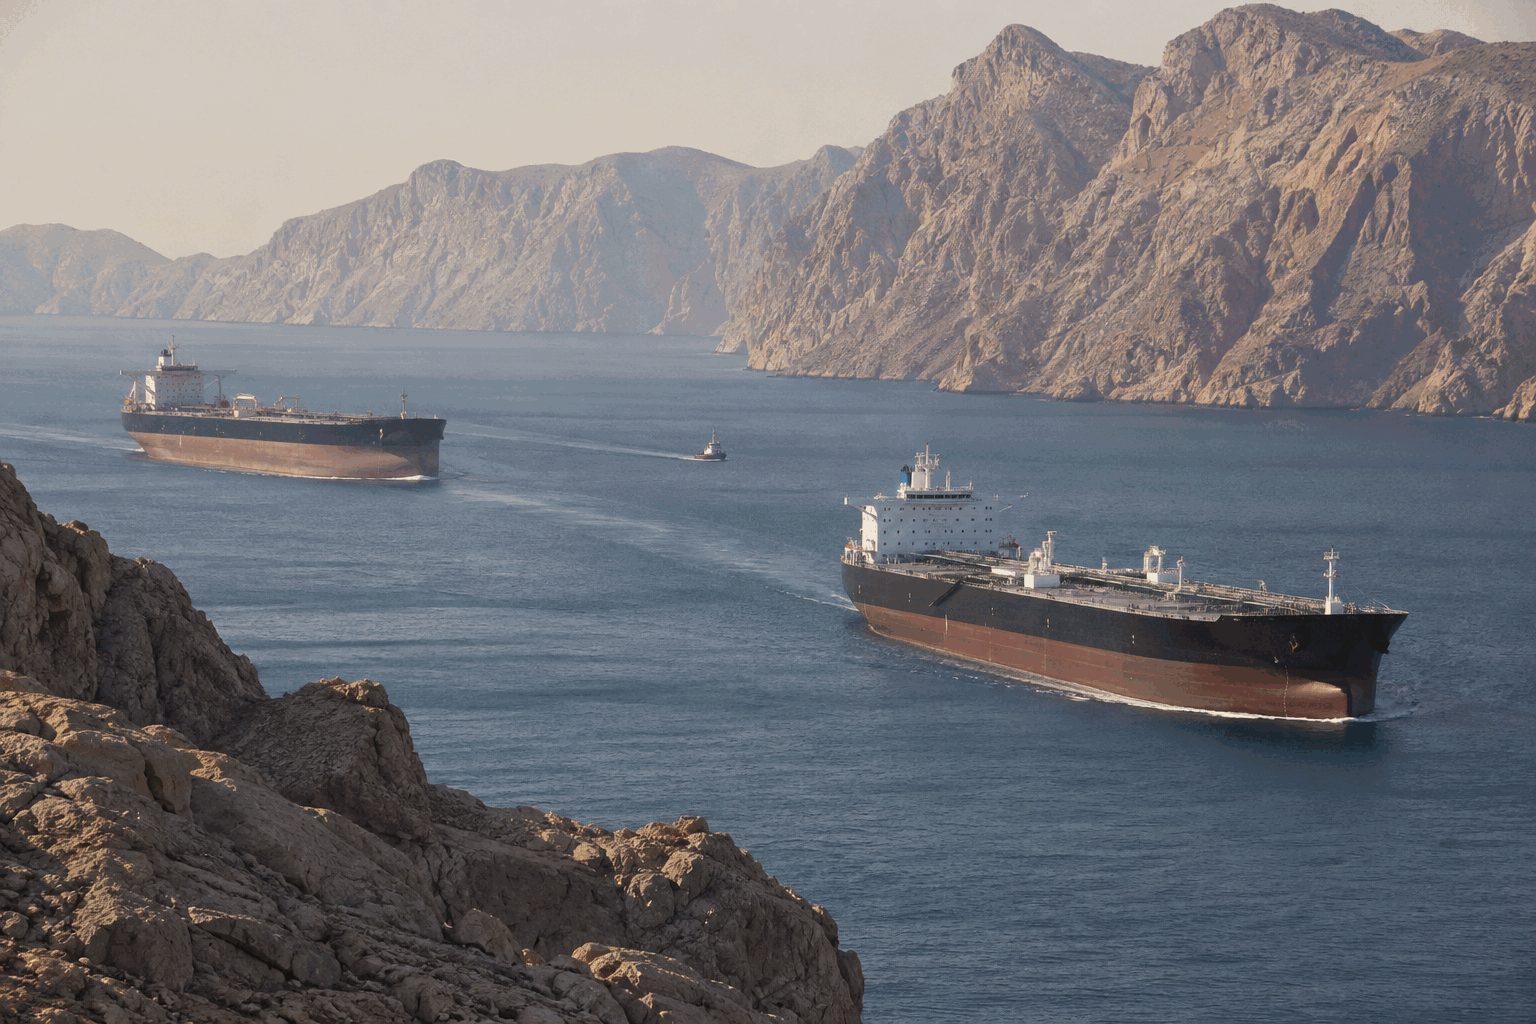
Brent and WTI ended six-session winning streaks after Washington widened pressure on Iran. The market still carries a measurable Hormuz premium.
EIA’s August outlook assumes Hormuz constraints persist through August. Its 2027 case requires inventories and production to rebuild.
The market is reacting to marginal barrels. That makes verified tanker flows more useful than sanction rhetoric alone.
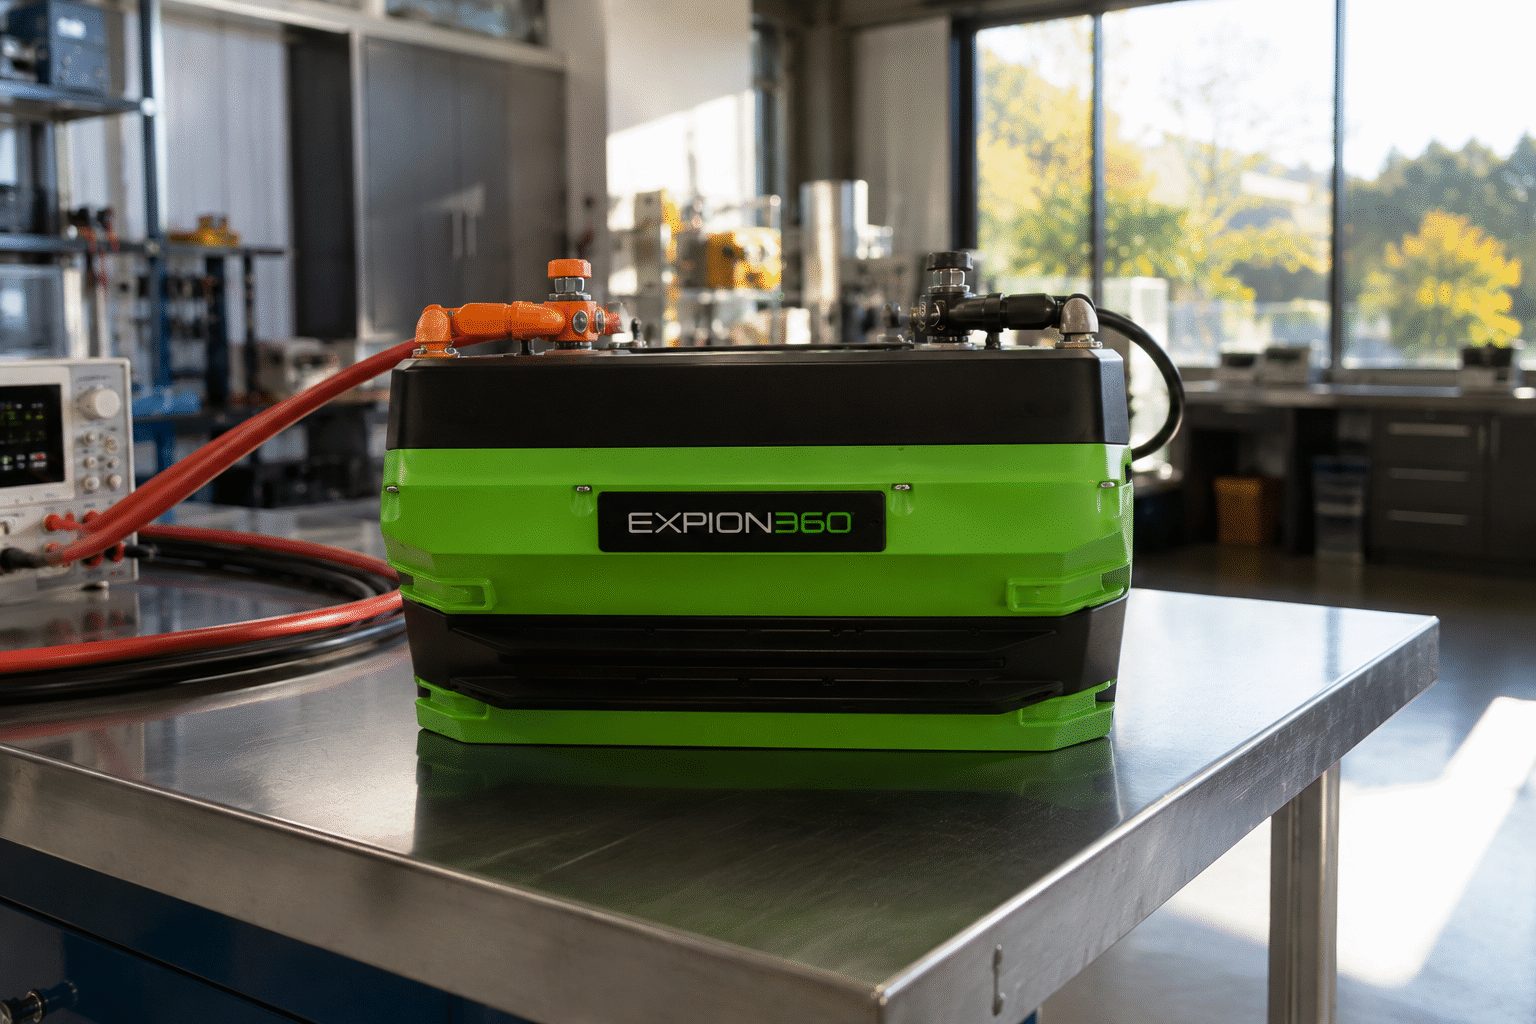
The rally reflects financing plus entry into upstream energy, not an improvement in the legacy battery revenue trend.
| Q2 metric | 2026 | YoY |
|---|---|---|
| Net sales | $2.03M | −32% |
| Gross margin | 32.4% | +11.6 pts |
| Net loss | −$1.28M | 6% narrower |
| June cash | $1.54M | −48% vs Dec. |
Market data: 24 Aug 2026, 13:12 BST, 15-minute delayed. London market status at report time: closed.
The attacked operator is undisclosed. National Grid is a listed infrastructure reference, not the identified victim.
Consensus is Hold. The average target sits about 16% above the delayed reference, but the low target is roughly 9% below it.
Near-term revenue impact looks immaterial. The bigger question is whether cyber controls, vendor replacement and reporting costs are efficiently funded through regulated allowances while National Grid delivers at least £70bn of investment through FY2031.

Exxon Mobil Corporation · U.S. premarket active
Regular-session closes, EDT. Monday premarket had no verified XOM trade when prepared.
Oil's 6% weekly surge lifted producers, but Monday profit-taking threatens the premium.
U.S.-Iran talks stalled, tanker traffic stayed restricted and Washington prepared new sanctions. Exxon gained less than Brent, then crude fell before the 14:00 EDT policy announcement.
XOM is 93.6% of its $176.41 52-week high.
| Asset | Move |
|---|---|
| Brent | +6.39% |
| WTI | +5.66% |
| ConocoPhillips | +6.38% |
| Exxon | +3.13% |
| Chevron | +2.64% |
| Gauge | Reading |
|---|---|
| Rial / USD | 2.02M |
| Hormuz global share | ~20% |
| Weekend vessels | <20 |
| Brent | $92.90 |
| WTI | $85.32 |
| Rating | Count |
|---|---|
| Strong Buy | 7 |
| Buy | 3 |
| Hold | 14 |
| Strong Sell | 1 |
| Target range | $142–$200 |
| Time / event | Investor question |
|---|---|
| 14:00 EDT Monday | How broad are secondary sanctions? |
| After announcement | Do Iranian offers to China fall again? |
| Shipping data | Does Hormuz traffic recover or tighten? |
| Equity open | Does Exxon hold its $20.6B weekly gain? |
Bull: tighter exports, shipping retaliation, sustained $90+ Brent.
Bear: weak enforcement, diplomacy, alternative supply routes.
Valuation: average target leaves only 2.8% upside.
Sources: Reuters, AP, StockAnalysis/S&P Global and company filings. Equity data as of August 21, 2026, 16:00 EDT. Crude data as of August 24, 2026, 06:49 GMT. Dashboard prepared August 24, 2026, 05:18 EDT. Figures may differ slightly across delayed feeds.