
Investor Dashboard

Shares of BitMine Immersion Technologies, Inc. rose 0.2% on Wednesday. The decline in ether, though, lowered the asset buffer supporting the stock.
Category hubCryptocurrency
Follow the latest TechStock² reporting, investor analysis and material developments for Cryptocurrency in one continuously updated topic hub.
Change from each asset's first regular-session five-minute close.
As of . Source: Yahoo Finance intraday data. Five-minute closes; not live streaming.
Sources: BitMine August 31 release and May 31 Form 10-Q. Estimate uses 603.23 million shares, the $280 million preferred liquidation claim and $30.1 million of May 31 liabilities. Rounded figures may not add.
Per-share estimates hold all non-Ether marks, liabilities and share count constant. Sources: company filings, Nasdaq and Yahoo Finance. Values are scenarios, not forecasts.
Monthly notional volume, U.S. dollars ·
Source: Binance company data. Values are reported notional volume.
Minimum number of supported U.S. stocks and ETFs, announced September 1
Source: Binance announcement. Ratio uses the stated minimum catalog sizes.
2026 year-to-date U.S. average daily volume, millions of contracts
Source: Options Clearing Corporation. Combined figure is the sum of equity and ETF options ADV.
Bitcoin recovered from the morning low
BTC-USD hourly closes, Eastern time
Source: Coinbase Exchange candles. The value callout uses the 12:30 spot quote; plotted points use hourly closes through 12:00 EDT.
U.S. spot-bitcoin ETF demand reversed twice
Daily net flow, $ millions
Source: Farside Investors, retrieved September 2, 2026, 12:30 EDT. Bar length shows absolute flow magnitude.
Bitcoin limited the 24-hour decline
Change from the 12:00 EDT hourly close on September 1 to September 2
Source: Coinbase Exchange, September 2, 2026, 12:30 EDT. Bar length shows loss magnitude, capped at 1.4%.
BTC/USDT four-hour closes and latest price, U.S. dollars
Net Bitcoin balance additions at tracked exchanges versus U.S. spot ETF net inflows
Platform assets divided by user assets; August 1, 2026 snapshot
Price in U.S. dollars; the dashed line marks Monday's $25.32 close.
As of . Source: Yahoo Finance market data. Intraday points are 30-minute observations.
U.S. dollars; asset values are a reporting-time estimate, not net asset value.
Sources: BitMine disclosure and Yahoo Finance. Crypto marks: September 1, 2026, 16:14 EDT.
Estimated asset pool using 5,901,112 ETH, 211 BTC and the other disclosed values.
Illustrative marks, not forecasts. BTC held at $77,335.94. Cash, marketable securities and company-stated investment marks held constant. Sources: BitMine and Yahoo Finance.
Hourly closes, with the latest observation added at 14:23 EDT. Source: Yahoo Finance. Prices are rounded.
Change from Yahoo Finance’s chart reference close; approximately 14:23 EDT
Source: Yahoo Finance chart feeds. Crypto markets trade continuously, so reference-close returns can differ from rolling 24-hour changes.
June 30 SEC filing versus August 30 issuer data
Sources: SEC filing and Bitwise. The later holding is dated August 30, 2026.
Token stocks compared with the September 1 gross escrow release
The release is gross availability, not confirmed selling. Fund holdings are a stock accumulated over time, not one-day inflow. Sources: Bitwise and Crypto News.
ETH-USD, dollars per Ether ·
Source: Yahoo Finance, five-minute observations. Values shown are selected interval closes.
Price change and market value ·
$293.8bn market value
$1.557tn market value
$86.0bn market value
Bar length shows decline magnitude on a common 0%–2% scale. Source: CoinGecko.
U.S. daily net flows, $ millions · data through August 31, 2026
Source: Farside Investors. Bar scale uses the five-day maximum.
$78,064.21 last price; $77,662.53–$79,257.14 range
As of . Hourly closes and range: Coinbase Exchange.
Every $1,000 Bitcoin move changes the balance by $61,000.
Scenario arithmetic uses 61 BTC. Current price as of September 1, 2026, 06:35 EDT: Coinbase Exchange.
Reported figures and timeline: LBC. Multiple is £3.3 million divided by £1,500; it excludes taxes, fees and any earlier sales.
Daily closes in U.S. dollars; Monday's close followed two high-volume post-results sessions.
USD billions; common value uses the $12.25 close. Gross assets are not adjusted net asset value.
HYPE price as of . Sources: CoinGecko, company filing and Yahoo Finance. Excludes taxes, other assets, liabilities and warrant exercise proceeds.
Millions of shares; conversion and exercise are not assumed to occur immediately.
Source: Hyperliquid Strategies 10-K. Full exercise could provide cash; warrant mechanics and preferred blockers apply.
Sberbank's forecast compared with the Finance Ministry's annualized activity estimate.
| Metric | Q2 2026 | YoY |
|---|---|---|
| Revenue | $174.9M | -27% |
| Net income | -$611.3M | vs. +$808.2M |
| Adjusted EBITDA | -$360.9M | vs. +$1.25B |
| Bitcoin produced | 2,422 | +3% |
| Energized hash rate | 70.3 EH/s | +22% |
| Bitcoin | Stabilization above $80,000 would support treasury value and mining revenue. |
| AI leasing | Signed tenants would turn power capacity into contracted cash flow. |
| Long Ridge | Closing, financing and realized earnings determine deal accretion. |
| Collateral | Lower Bitcoin raises borrowing and liquidity risk. |
| 5.85M ETH | $9.50B |
| 210 BTC | $16.4M |
| Cash + marketable securities | $308M |
| Beast Industries stake | $180M |
| Eightco stake | $89M |
| Total estimate | $10.10B |
|---|
Simple mark-to-market estimate. It excludes liabilities, taxes, other balance-sheet items and changes after the disclosure date.
| Metric | Reported | Current-price estimate |
|---|---|---|
| Staked ETH | 5.067M | 5.067M |
| 7-day annualized yield | 2.67% | 2.67% |
| Annualized revenue | ~$330M | ~$220M |
| Share of ETH staked | 87% | 87% |
Core question: can MAVAN and treasury execution justify a 30% premium after Ether's weekend reset?
Sources: BitMine August 24 release; MarketWatch/FactSet; live crypto quotes. Estimates use BMNR market capitalization of $13.13B, ETH at $1,624.95 and BTC at $78,117.
Visibility is immediate. The circulation return must still be earned.
| Added average USDC | Annual gross reserve income | After 61.7% cost ratio |
|---|---|---|
| $1B | $34.8M | $13.3M |
| $3B | $104.4M | $40.0M |
| $5B | $174.0M | $66.6M |
Scenario holds the Q2 reserve return rate at 3.48% and the cost ratio constant. It is not guidance.
Chelsea supplies global brand reach, but Circle earns mainly from the assets backing USDC. A durable return requires higher average circulation or greater fee revenue. Watch the weekly balance trend, reserve yield and distribution-cost ratio.
Risks: undisclosed sponsorship cost, weaker interest rates, stablecoin competition, marketing regulation and limited conversion from awareness to funded balances.
Sources: Circle transparency and Q2 2026 results; Chelsea FC partnership announcement; Reuters; market data as of Aug. 28, 2026. Scenario values are estimates.
Bitcoin collateral funds the AI pivot, increasing both runway and sensitivity.
Revenue fell 27%. Hashrate rose 22%, but energy cost per bitcoin increased to $38,690.
| Bitcoin held | 35,577 BTC |
| Quarter-end BTC value | ~$2.1B |
| Cash and equivalents | $421.3M |
| Combined balance | ~$2.5B |
| BTC loaned/pledged | 9,270 · 26% |
Balances dated June 30, 2026; bitcoin valued then at $58,524.
| Company | Friday move |
|---|---|
| MARA | −10.15% |
| Cipher Digital | −9.54% |
| Riot Platforms | −9.05% |
| TeraWulf | −6.82% |
The synchronized declines point to sector and bitcoin pressure, not only company-specific selling.
Rerating trigger: a named AI tenant, contracted economics and a funded construction timeline.
Risk: falling bitcoin prices reduce collateral value while debt service continues.
| Consensus | Moderate Buy |
| Buy / Hold / Sell | 8 / 2 / 2 |
| Average target | $18.78 |
| Low / High | $6 / $30 |
| Upside to average | 76% |
Third-party consensus checked Aug. 29, 2026; targets are estimates, not guarantees.
The $2.5B asset pool supports development, but a growing portion of bitcoin now backs financing. MARA trades near 5.8× annualized Q2 revenue. The stock can rerate through higher bitcoin prices or contracted AI infrastructure; both routes carry execution and financing risk.
The shares now trade near the company’s reported gross asset figure, but gross holdings are not NAV. Private stakes, taxes, liabilities, custody costs and staked-asset liquidity can widen the gap. Thin analyst coverage—only two listed ratings—also limits the usefulness of consensus targets.
MarketWatch quote · BitMine Aug. 24 release · SEC Form 10-Q · AP market close
BMNR selloff versus marked Ethereum assets
ETH marked at $2,438; other assets use August 23 company disclosures. Market cap uses 603.23M shares and Friday's close.
| ETH held | 5.848M |
| ETH staked | 5.067M |
| Share staked | 86.7% |
| 7-day yield | 2.67% |
| Annualized revenue | $330M |
| Measure | Current | Change / sensitivity |
|---|---|---|
| BMNR | $23.80 | −7.14% |
| Ether | ≈$2,438 | ≈−3.0% / 24h |
| Value impact of 1% ETH move | — | ≈$143M |
| Quarterly common-holder loss | May 2026 | −$83.6M |
| Stockholders' equity | May 2026 | $11.60B |
The common stock added roughly $5.2 billion of quoted value. The bitcoin reserve gained about $1.9 billion at the same snapshot.
Before debt, preferred equity, tax and other claims.
| Measure | Reading | Why it matters |
|---|---|---|
| BTC acquisition cost | $63.36B / $75,385 each | Current token price sits 6.6% higher |
| USD Reserve | $5.10B | Supports dividends and interest |
| USD Cash | $1.59B | Flexible treasury deployment |
| Q2 long-term debt | $6.7B | Down 18% in the quarter |
| Q2 preferred equity | $14.4B | Senior claim to common stock |
| Q2 software revenue | $122.4M | Up 6.9% year over year |
| Action, Aug. 17–23 | Amount | Investor interpretation |
|---|---|---|
| MSTR shares sold | 18.26M | Common-stock dilution |
| Net proceeds | $2.0065B | About $109.88 per share |
| STRC repurchase | $136.4M | Reduces preferred claim |
| USD Reserve increase | $300M | Extends obligation coverage |
| Bitcoin traded | None | 840,447 BTC unchanged |
MSTR’s daily gain materially exceeded bitcoin’s. That leverage can reverse. Common issuance, preferred dividends, debt service, tax changes, regulation and contraction of the equity multiple can outweigh a stable token price.
Primary data: Strategy Aug. 24 Form 8-K and Q2 2026 results. Market data timestamped above.
Fidelity joined an eighth straight industry inflow session, but FBTC captured less of the latest total than its cumulative flow share.
U.S. dollars, millions. GBTC redemptions offset part of the day’s creations.
The latest flow was 7.9 percentage points below FBTC’s cumulative share of industry net creations.
Bitcoin can move sharply while FBTC is closed, producing opening gaps. A break below Thursday’s $77,658 Bitcoin low would weaken the overnight signal. Fidelity also warns that digital assets can become illiquid; FBTC is not registered under the Investment Company Act of 1940, and shareholders cannot redeem shares for Bitcoin.
Sources: Farside Investors, Fidelity quote, FBTC factsheet, Fidelity disclosures, and Bitcoin market data. Flow observations are for August 26, 2026.
| Metric | Reading | Period |
|---|---|---|
| Total revenue | $1.22B | Q2 2026 |
| Subscription & services | $555M | Q2 2026 |
| Share of net revenue | 48% | Q2 2026 |
| Adjusted EBITDA | $207.8M | Q2 2026 |
| Net loss | −$359.5M | Q2 2026 |
| Trading-volume share | 10.3% | Q2 2026 |
Interpretation: Base can distribute the assets across wallets and DeFi protocols. The investor case still needs disclosed volume, take rate and contribution margin.
| Company | August 25 close | Day move | Market cap | Forward P/E | Analyst target upside |
|---|---|---|---|---|---|
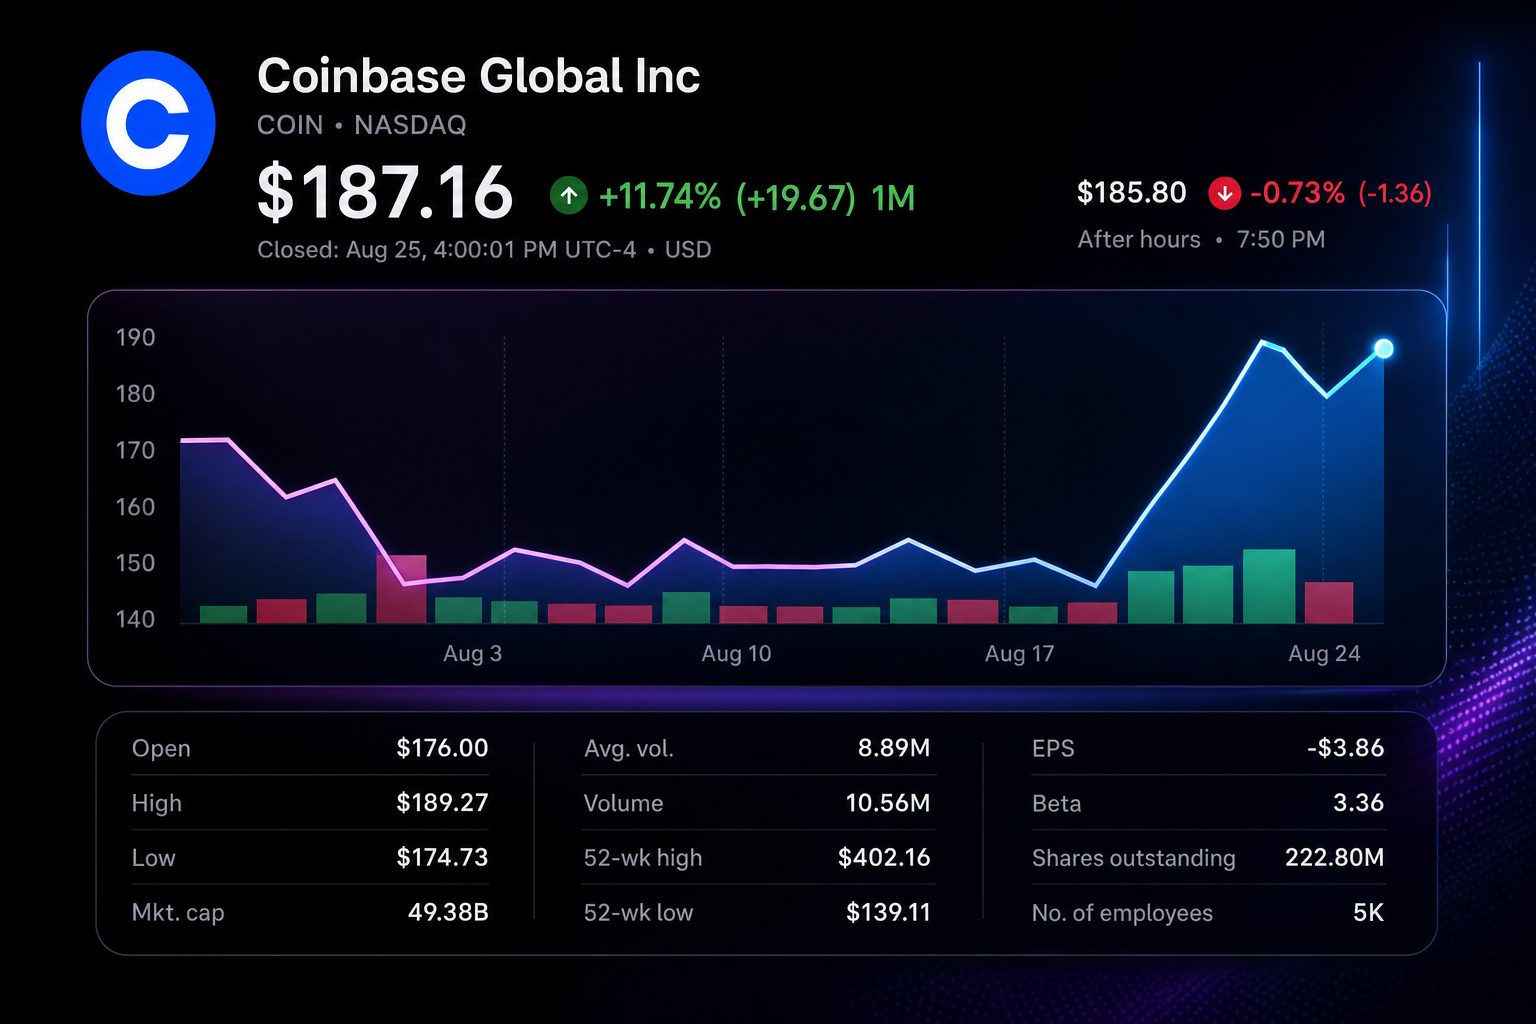
| Coinbase | $187.16 | +4.28% | $49.38B | 162.8× | +5.0% |
| Cboe Global Markets | $308.82 | +0.24% | $32.25B | 21.3× | +2.1% |
| Intercontinental Exchange | $161.78 | −0.74% | $90.82B | 19.7× | +14.6% |
| Nasdaq | $98.73 | −0.06% | $55.19B | 22.6× | +11.2% |
| CME Group | $277.32 | −0.66% | $99.72B | 22.5× | +2.1% |
Peer data are as of the August 25 U.S. close. The comparison shows Coinbase's greater earnings sensitivity to digital-asset activity and product adoption.
Consensus across 34 analysts, with an average target of $196.55.
The target implied 5.0% upside from the August 25 close. That is smaller than the stock's single-day 4.28% move.
Tuesday's price action treated tokenized equities as a credible extension of Coinbase's platform. The measurable evidence is the stock move, not product revenue. With only four securities and no disclosed fee schedule, adoption data now matter more than launch-day attention.
Revenue mix from Robinhood’s August 5, 2026, second-quarter release. Subcategories overlap the transaction total and therefore do not sum to total revenue.
| Metric | July 2026 | Month over month | Year over year |
|---|---|---|---|
| Equity notional | $332.8B | −15% | +59% |
| Options contracts | 324.2M | +2% | +66% |
| Crypto notional | $10.9B | −33% | −62% |
| Robinhood App crypto | $4.3B | −38% | −74% |
| Event contracts | 6.1B | −5% | +20× |
| Net deposits | $5.6B | 18% annualized rate | — |
The 76× ratio is a sensitivity marker. It shows how strongly investors linked Tuesday’s Bitcoin move to future trading activity, despite crypto’s small current share of Robinhood revenue.
A durable signal would pair stronger crypto notionals with continued deposit growth. Options, equities and event contracts would need to remain firm.
Bitcoin gave back part of its early rise. HOOD’s 49.64× trailing P/E leaves the shares exposed if activity fails to follow price.