
NEW YORK, August 4, 2026, 13:05 (EDT)
- JetBlue climbed 5.9% to $6.60 and reached a 52-week peak of $6.62.
- Brent crude dropped 3.9%, trading at $80.47, following indications of movement in U.S.-Iran negotiations.
- An adjustment of 10 cents in fuel prices represents roughly 3.5% of JetBlue’s equity value, calculated from second-quarter annualized fuel usage.
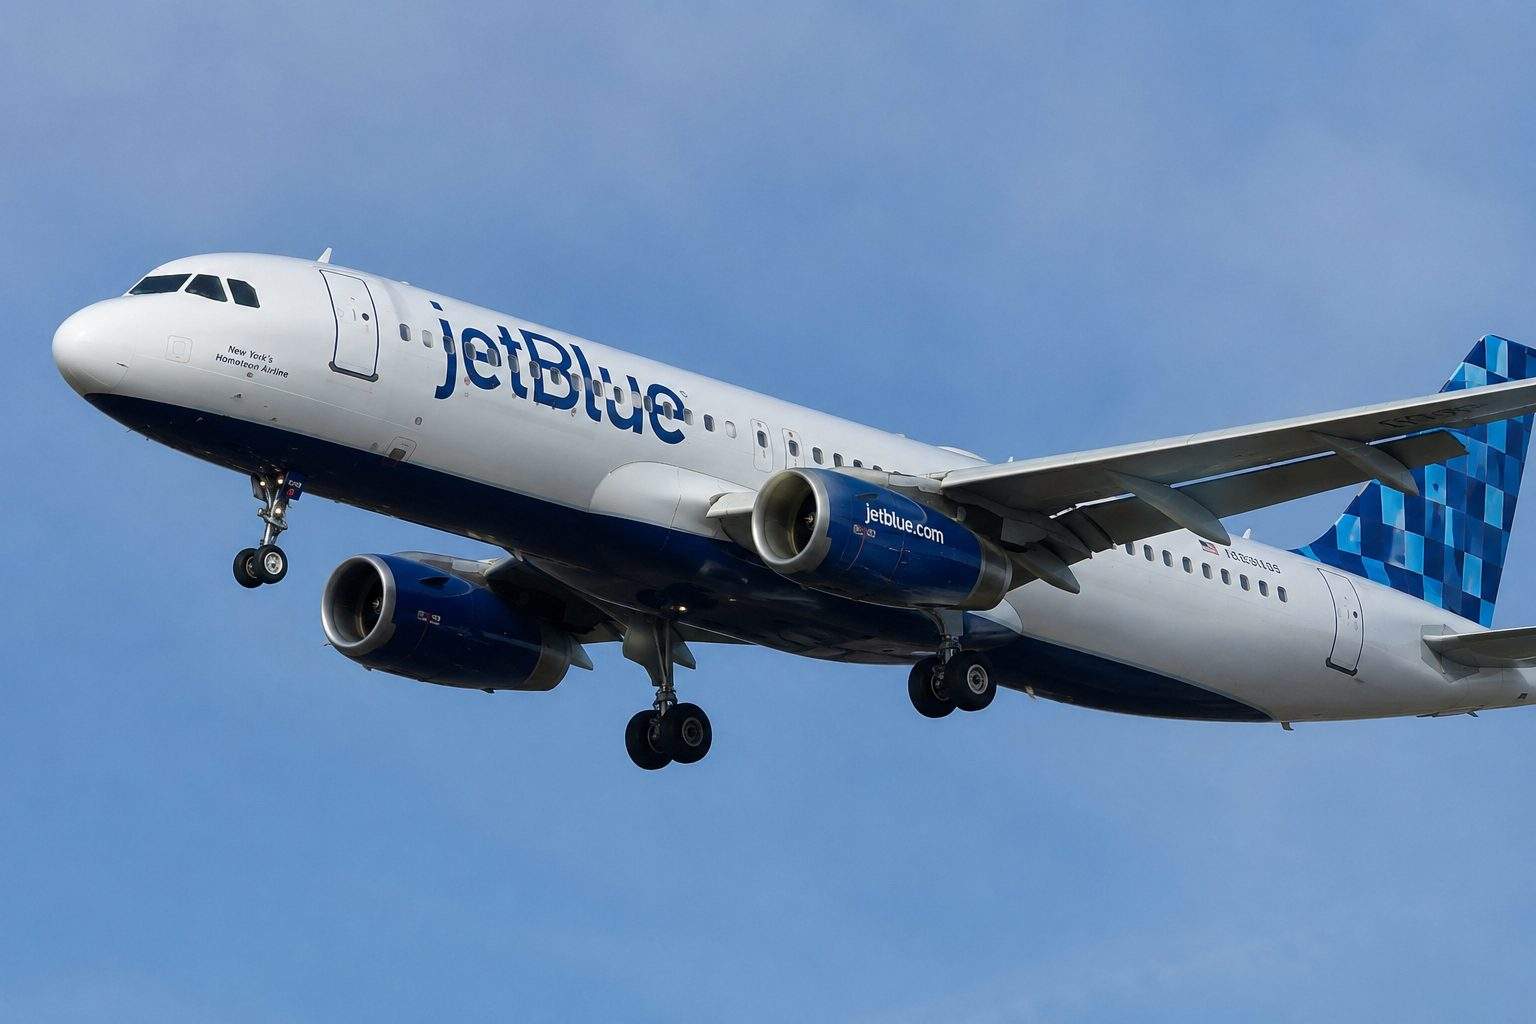
JetBlue Airways Corporation NASDAQ:JBLU gained 5.9% to $6.60 during midday trade. The stock reached $6.62, surpassing its previous 52-week high of $6.50.
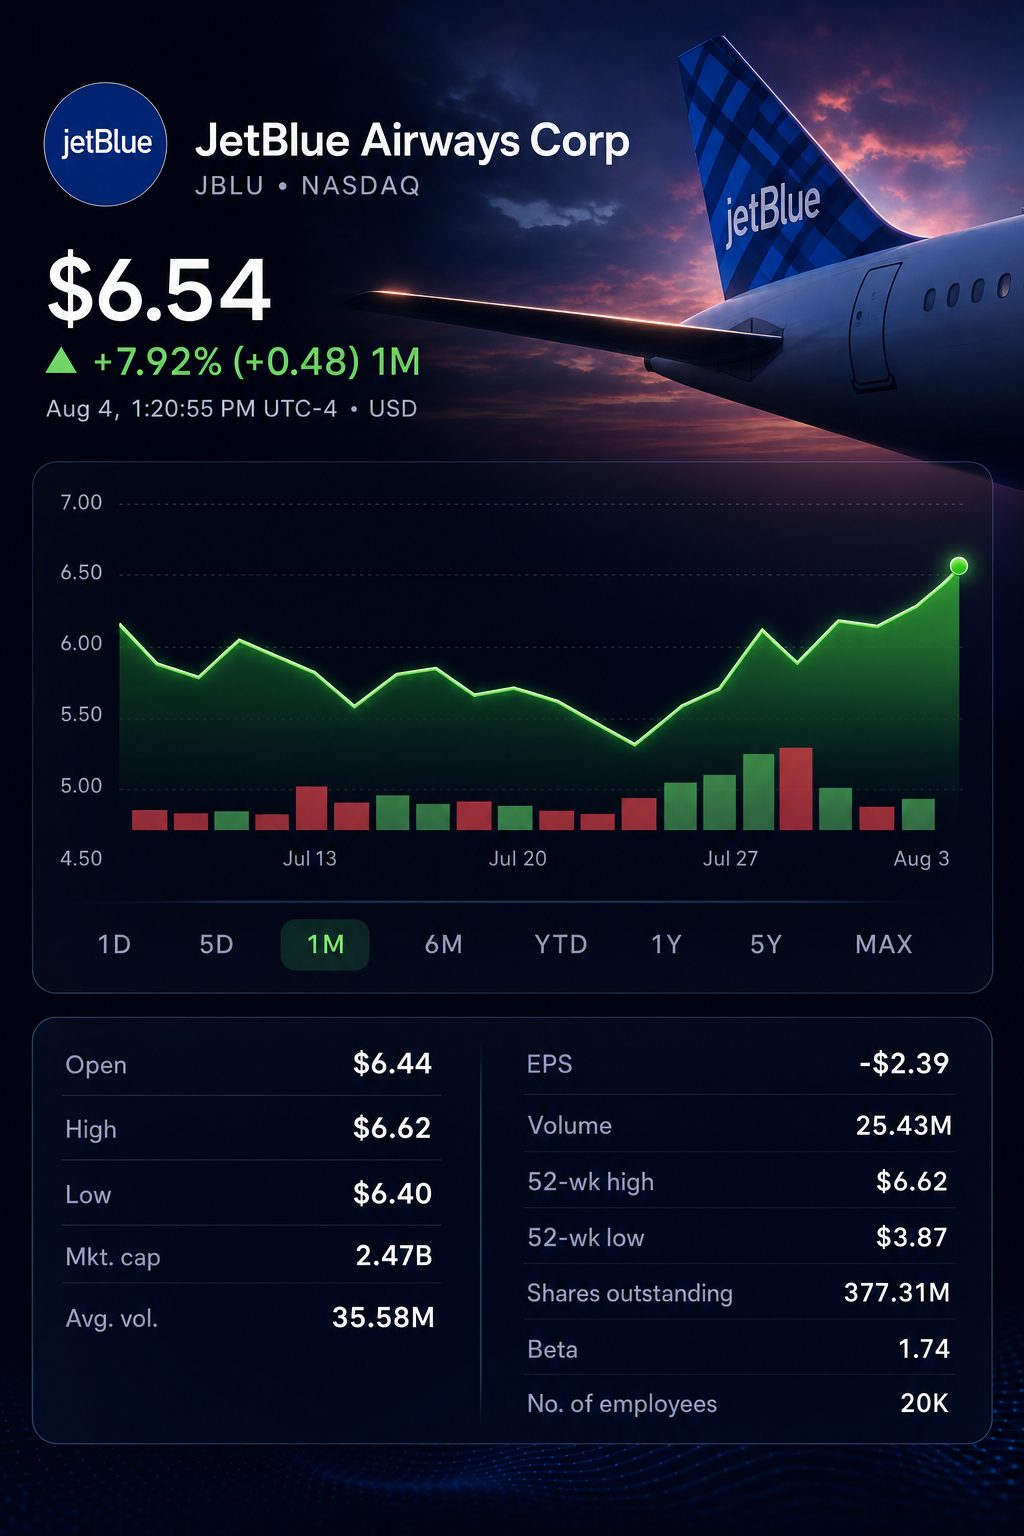
The stock is up 21.5% compared with its close on July 27, prior to earnings. The main driver in Tuesday’s session was lower oil prices.
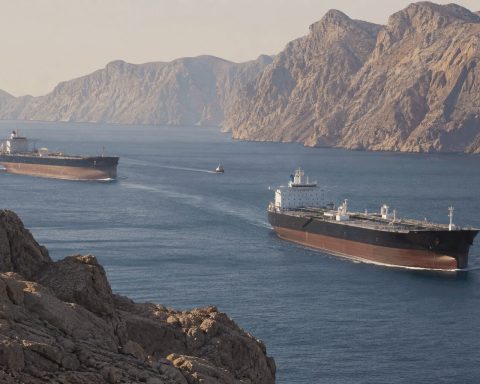
Brent dropped 3.9% to $80.47 on Tuesday, after tumbling about 7% on Monday. The declines came amid indications that U.S.-Iran negotiations may lead to the reopening of the Strait of Hormuz.
| Company | Price | Day move | Intraday high | Market value |
|---|---|---|---|---|
| JetBlue Airways Corporation NASDAQ:JBLU | $6.60 | up 5.9% | $6.62 | $2.49 billion |
| American Airlines Group NASDAQ:AAL | $16.54 | rising 3.1% | $16.76 | $10.96 billion |
| Alaska Air Group NYSE:ALK | $52.41 | higher by 4.4% | $52.46 | $5.99 billion |
| Southwest Airlines NYSE:LUV | $48.98 | gaining 4.1% | $49.12 | $24.15 billion |
Intraday delayed quotes appeared at approximately 12:50 EDT.
JetBlue outperformed its peers by no less than 1.5 percentage points. Meanwhile, the S&P 500 gained roughly 1.3%, indicating that increased risk appetite played a role.
Data indicates that fuel exposure accounts for some of the additional lift. In the second quarter, JetBlue used 215 million gallons.
| Fuel-price increase | Change in gross annual expenses | Portion of current market value |
|---|---|---|
| $0.10 per gallon | Roughly $86 million | 3.5% |
| $0.25 per gallon | Roughly $215 million | 8.6% |
| $0.50 per gallon | Roughly $430 million | 17.3% |
Initial reporter calculation: Gallons for the second quarter have been annualized. The estimate does not factor in pricing, capacity, or tax adjustments.
With this run-rate, a 10-cent fluctuation in fuel prices alters JetBlue’s annualized gross expense by approximately $86 million. This makes the airline’s equity notably sensitive to fuel costs.
The operating environment shows a mixed trend. Revenue increased by 14.5%, while the cost of aircraft fuel surged 80.7%.
| Metric | Q2 2026 | Q2 2025 | Change |
|---|---|---|---|
| Operating revenue | $2.697 billion | $2.356 billion | up 14.5% |
| Available seat miles | 17.170 billion | 16.634 billion | increased 3.2% |
| Aircraft fuel expense | $911 million | $504 million | rose 80.7% |
| Average fuel cost | $4.23/gallon | $2.40/gallon | jumped 76.3% |
| Operating margin | -5.2% | 0.3% | down 5.5 points |
| Net loss | $247 million | $74 million | Loss widened by $173 million |
JetBlue released its quarterly financial results on July 28.
Price adjustments helped cushion the impact. Revenue per available seat mile climbed 10.9%, and average ticket prices went up almost 9%. JetBlue CFO Ursula Hurley stated the company expects that “pricing will provide an offset” should fuel costs continue to rise. JetBlue Investor Relations
The adjusted per-share loss came in at 66 cents, surpassing the consensus estimate of 71 cents. Savanthi Syth, an analyst at Raymond James Financial NYSE:RJF, described the 2028 EPS goal as “ambitious.” Reuters
Management anticipates faster revenue growth per seat in the third quarter. The company maintains its projection for a full-year adjusted operating margin between negative 2% and 5%.
| Metric | Q2 actual | Estimated Q3 2026 | Estimated FY 2026 |
|---|---|---|---|
| Capacity increase | +3.2% | +3.0% to +6.0% | +1.5% to +3.5% |
| RASM change | +10.9% | +12.5% to +16.5% | +10.0% to +12.5% |
| Unit cost rise, excluding fuel | +2.4% | +2.5% to +4.5% | +2.0% to +4.0% |
| Fuel cost per gallon | $4.23 | $3.49 | $3.49 |
| Adjusted operating margin | -5.2% | Not provided | -2.0% to -5.0% |
The company has provided estimates for its Q3 and full-year results.
JetBlue bases its fuel projections on Brent prices and the jet crack spread. While lower crude prices offer some relief, the impact is not directly proportional.
The stakes are increased by the balance sheet. JetBlue’s cash and securities stood at $2.17 billion, while total debt was $8.48 billion. The resulting net debt of $6.31 billion is roughly 2.5 times greater than JetBlue’s present market value.
Risks: Oil prices may bounce back sharply if talks break down. JetBlue also needs to maintain higher fares, manage non-fuel expenses, and cover around $590 million in projected 2026 interest costs.
Currently, investors are favoring fuel relief ahead of seeing profits. The upcoming challenge will be whether $3.49 fuel prices and RASM growth in the double digits can happen at the same time.
Related articles: NASDAQ:JBLU