
American Airlines (NASDAQ:AAL) Stock Recovers From Outage Decline While Fuel Sustains Margin Disparity

American Airlines (NASDAQ:AAL) Stock Recovers From Outage Decline While Fuel Sustains Margin Disparity

NEW YORK, July 31, 2026, 13:30 EDT

  • American was last at about $15.30, falling 0.9%, as U.S. markets remained open for regular trading.
  • The stock traded 0.4% lower than its closing price before Tuesday’s outage. Shares of Delta Air Lines and United Airlines Holdings both slipped roughly 1.3%.
  • American recorded an adjusted pretax margin of 0.9% for the second quarter. Delta’s figure stood at 7.7%, and United reported 4.8%.

Shares of American Airlines Group Inc. fell 0.9% to $15.30 on Friday, though they had largely recovered from losses posted on Wednesday. U.S. markets were open for regular trading.
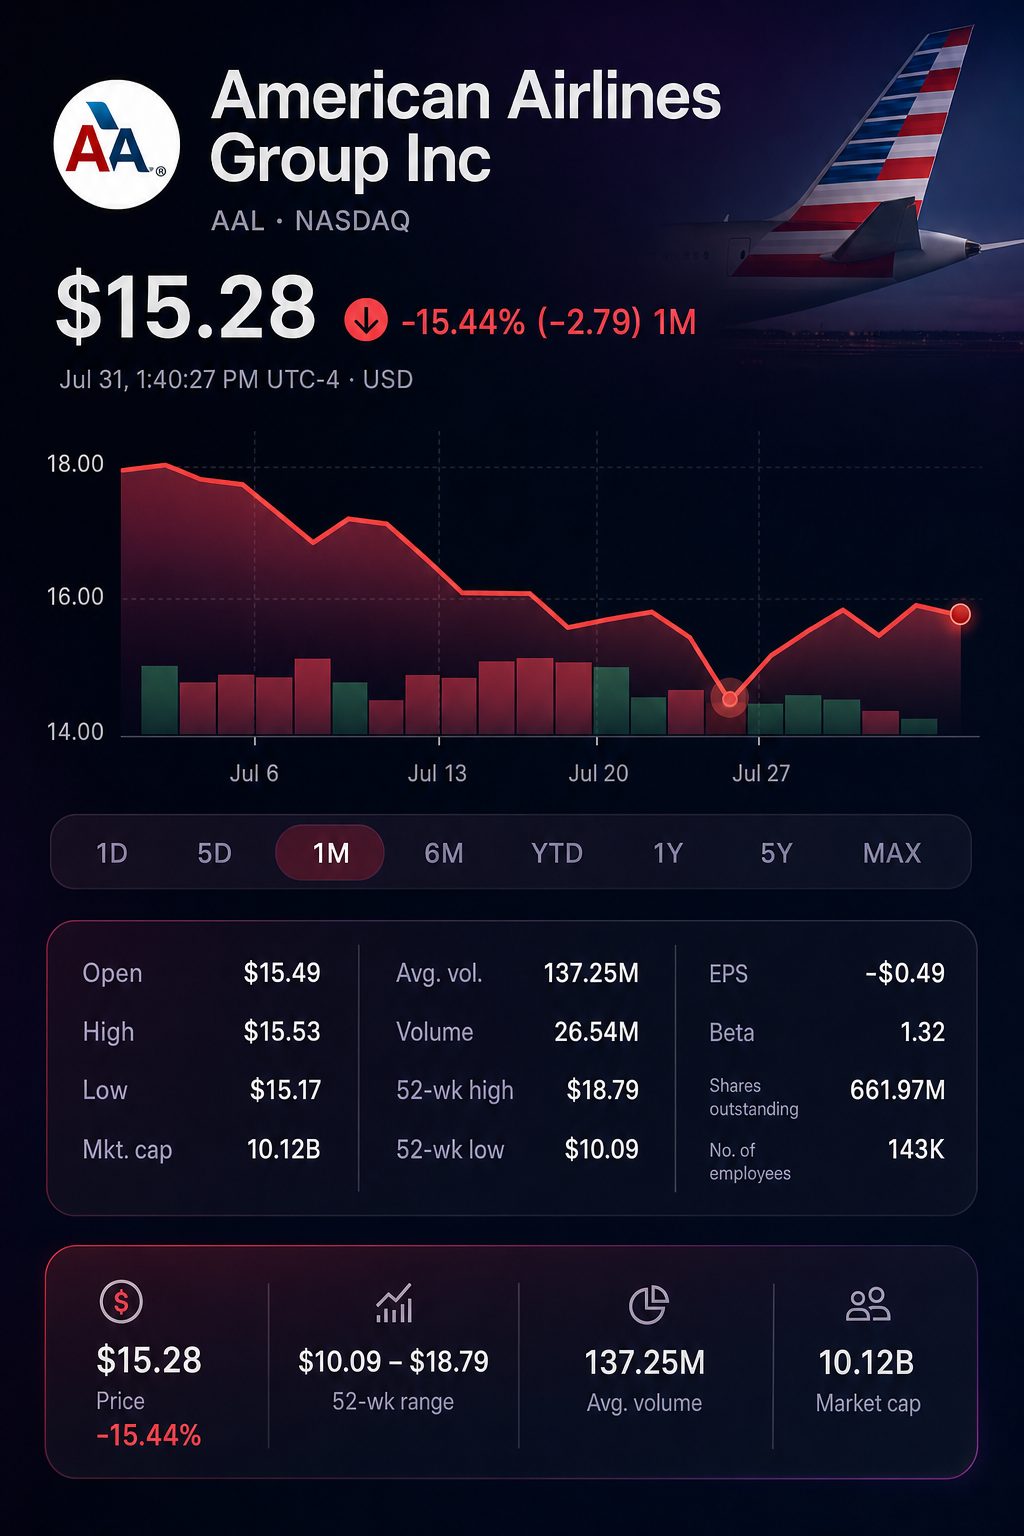
Stock chart for NASDAQ:AAL

The market focus now moves past the outage. The main concern for American lies in converting revenue to profits. Its reported adjusted pretax margin for the second quarter stood at just 0.9%.

The three airline stocks posted a slight divergence in daily performance around 13:15 EDT.

CompanyShare priceFriday moveMarket value
American Airlines Group $15.30-0.9%$10.1 billion
Delta Air Lines $88.21-0.4%$58.0 billion
United Airlines Holdings $122.14-1.1%$39.6 billion

Market values and prices reflected delayed intraday data.

American’s market capitalization stood at roughly a quarter of United’s and was below a fifth of Delta’s. The balance sheet further amplifies fluctuations in earnings.

As of June 30, long-term debt with current maturities totaled $28.6 billion, about 2.8 times the company’s market value on Friday.

The stock declined during the session following Tuesday evening’s outage but rebounded swiftly.

DateAmericanDeltaUnited
Tuesday, July 28 close$15.36$89.37$123.77
Wednesday, July 29 close$14.84$86.25$119.42
Thursday, July 30 close$15.43$88.59$123.56
Friday, July 31, approx. 13:15 EDT$15.30$88.21$122.14
Tuesday comparison-0.4%-1.3%-1.3%

Closing prices are shown for Tuesday to Thursday, while Friday’s data reflect intraday values.

As a result, American outpaced its competitors throughout the outage period. This relative performance indicates that investors viewed the disruption as short-lived. It does not reflect optimism regarding future earnings.

The incident had a significant operational impact. According to FlightAware data referenced by Reuters, there were around 1,100 flight delays and 221 cancellations. The Federal Aviation Administration removed the ground stop within an hour.

The reason American trades at a significant discount is highlighted by the second-quarter comparison.

CompanyQ2 revenue measureYear-on-year growthAdjusted pretax marginAdjusted EPSFuel expense growth
American$16.7 billion16.3%0.9%$0.1583.3%
Delta$17.7 billion14.0%7.7%$1.5677%
United$17.7 billion16.0%4.8%$1.9984%

Delta’s total refers to adjusted operating revenue. American’s margin is based on adjusted pretax income of $144 million and total revenue of $16.735 billion. Each company has its own method for calculating adjusted figures.

American achieved the same revenue growth as United but retained a smaller portion of each revenue dollar. Both airlines saw fuel costs climb at nearly identical rates.

Chief Executive Robert Isom stated that revenue growth was “exceeding our initial expectations.” Meanwhile, Chief Financial Officer Devon May expressed a more cautious view of fuel recovery, noting it was “obviously not 100%” for the second half. American Airlines Newsroom

Forward guidance continues to highlight that issue.

CompanyQ3 adjusted EPS forecastFull-year 2026 adjusted EPSQ3 fuel forecast
American-$0.70 to -$0.10-$0.65 to $0.65About $3.75 a gallon
Delta$2.00 to $2.50$6.50 to $7.50About $3.15 a gallon
United$2.50 to $3.50$9.00 to $11.00About $3.69 a gallon

The recommendations are based on the most recent quarterly reports and disclosures from the airlines.

American anticipates an adjusted loss for the third quarter. Its fuel estimate is 60 cents higher than Delta’s and six cents more than United’s.

Brent crude hovered close to $90 per barrel on Friday, on track for an estimated 24% rise in July. According to American estimates, every one-cent rise in fuel costs results in an additional $46 million in yearly expenditure.

Demand is providing a buffer. Managed corporate revenue climbed 26%, and premium passenger unit revenue was up 13.4%. Increased ticket prices compensated for almost half of the additional fuel expenses in the second quarter. Liquidity was reported at $11.3 billion.

Risks: A renewed surge in oil prices could wipe out those fare increases. Additional system breakdowns may push up costs related to rebooking and compensation. American’s $28.6 billion debt burden allows little margin for another earnings shortfall.

The upcoming focus is on pricing, rather than system recovery. American is required to narrow the margin gap in the third quarter. Investors viewed the outage as temporary. The earnings gap persists.

TS2 TECH • EXTENDED COVERAGE

Further analysis

How is American Airlines stock performing today?
At 1:08 p.m. EDT, shares of American Airlines hovered close to $15.30, representing a decline of roughly 0.9%. The U.S. Global Jets ETF also dropped 0.9%, whereas SPY advanced 0.4%. The data suggests underperformance specific to airlines, not a wider market downturn. American Airlines had a market capitalization near $10.1 billion with 24.3 million shares changing hands.
Were second-quarter results ahead of forecasts?
Adjusted earnings stood at $0.15 per share, topping the FactSet consensus of $0.03. wsj.com Revenue climbed 16.3% to a record $16.735 billion. However, GAAP net income dropped 88% to $71 million. Operating income declined 61%, and the adjusted pretax margin narrowed to 0.9%. SEC While the headline result outperformed forecasts, core profitability stayed subdued.
What caused record revenue to result in minimal profit?
Company data show that fuel costs accounted for nearly all of the rise in revenue. Fuel expenses surged by $2.218 billion, while revenue was up $2.343 billion. American’s fuel price was $4.05 a gallon, 77% higher than a year ago. Increased ticket prices made up for close to half of the higher fuel costs. SEC A one-cent increase in fuel prices lifts annual expenses by about $46 million, with most of that affecting pretax earnings. Reuters
What are the implications of the management’s updated 2026 outlook?
American’s revised adjusted EPS outlook is now between a $0.65 loss and a $0.65 gain, setting the midpoint at zero. Previously, the guidance was from a $0.40 loss up to a $1.10 gain. Reuters For the third quarter, the airline projects revenue growth between 16% and 19%. Management maintains its guidance for an adjusted per-share loss in the $0.10–$0.70 range. Before the announcement, analysts had forecast a $0.28 per-share profit. The projection factors in fuel costs of about $3.75 per gallon. SEC
Is there sufficient passenger demand to drive a recovery?
Robust demand continued, but pricing made a bigger contribution this quarter. Capacity was up 5.4%, while passenger traffic increased 3.6%, leading to a 1.5-point decline in load factor to 83.2%. Yield rose 11.9%, and total unit revenue increased 10.3%. SEC Premium unit revenue advanced 13.4%; managed corporate revenue surged 26%. That mix bolsters fares, but volume is still growing slower than capacity. SEC
Are non-fuel expenses being managed effectively?
Unit costs, excluding fuel, special items and profit sharing, increased by 2.9%. Total unit revenue gained 10.3%. SEC Salaries rose 5.9%, and maintenance expense was up 10.8%. SEC Management forecasts unit costs excluding fuel, profit sharing and special items to rise between 2.5% and 4.5% this quarter. Capacity is projected to grow 3% to 5%. SEC Core costs appear under control, while fuel remains the main variable.
What causes American to remain behind Delta and United?
American reported an adjusted pretax margin of 0.9%, significantly lower than Delta at 7.7% and United at 4.8%. SEC Although each company makes its own adjustments, the margin differences are notable. Delta reaffirmed its 2026 earnings forecast at $6.50 to $7.50 per share. United increased its projection to between $9 and $11. American’s midpoint guidance implies breakeven, providing limited cushion for a potential fuel price spike. ir.delta.com
What is the current state of liquidity, and what level of risk is associated with the debt?
Liquidity remains strong, but leverage is still the primary risk factor on the balance sheet. At the end of June, American reported $11.3 billion in available liquidity. SEC Total debt and finance leases stood around $28.9 billion, with operating lease liabilities contributing another $6.8 billion. SEC Operating cash flow for the first half was $4.694 billion, compared with $1.633 billion in capital expenditure and aircraft deposits. However, net interest expense for the second quarter was $409 million, closely trailing $446 million in operating income. SEC
Is AAL trading at a bargain at its current price?
Wall Street's mean price target stands at $19.43, roughly 27% higher than $15.30. Forecasts range between $12.50 and $25, indicating significant uncertainty. FactSet shows 11 Buys, one Overweight, 14 Holds, and two Sell ratings. wsj.com With trailing EPS in negative territory, a price/earnings ratio cannot be used. FactSet consensus projects $2.55 in EPS for 2027. At $15.30, this implies about six times estimated earnings. The multiple appears attractive only if margins rebound significantly. wsj.com
Has the IT outage this week impacted the investment thesis?
A 48-minute nationwide ground stop followed the July 28 outage. That day, FlightAware reported 1,100 delayed flights and 221 canceled across American. Thunderstorms on the East Coast further impacted airports, making it difficult to determine exact causes. Service resumed later the same evening. Reuters There has been no disclosed figure for the financial effect so far. The impact on earnings is still unclear. Isolated incidents have less significance than repeated disruptions.

Khadija Saeed is a financial markets reporter at TS2.tech, specializing in stocks, technology and emerging industries. She studied economics and finance at the London School of Economics and previously worked in market research before moving into financial journalism. Her coverage focuses on the companies, innovations and economic trends influencing global investors. Follow Khadija Saeed on Google News.

AI PORTFOLIO

Top Stock Picks

Today’s highest-ranked model selections.

#1 STRONG BUY

Xylem

NYSE: XYL 94 / 100
#2 STRONG BUY

AerCap

NYSE: AER 92 / 100
#3 BUY ON WEAKNESS

Visa

NYSE: V 90 / 100
#4 BUY

Chevron

NYSE: CVX 86 / 100
#5 ACCUMULATE

UPS

NYSE: UPS 84 / 100
View full portfolio
Editorial model selection. Not personalised advice.
Transocean (NYSE:RIG) Shares Rise as Merger Spread Reaches 2.4%
Previous Story

Transocean (NYSE:RIG) rises 3% while Valaris acquisition spread remains almost unchanged

Ford shares climb in premarket ahead of $6.3 billion cash target for 2026
Next Story

Ford shares shed earnings gains with 97% of cash target still ahead in H2 (NYSE:F)