
NEW YORK, July 30, 2026, 17:56 EDT
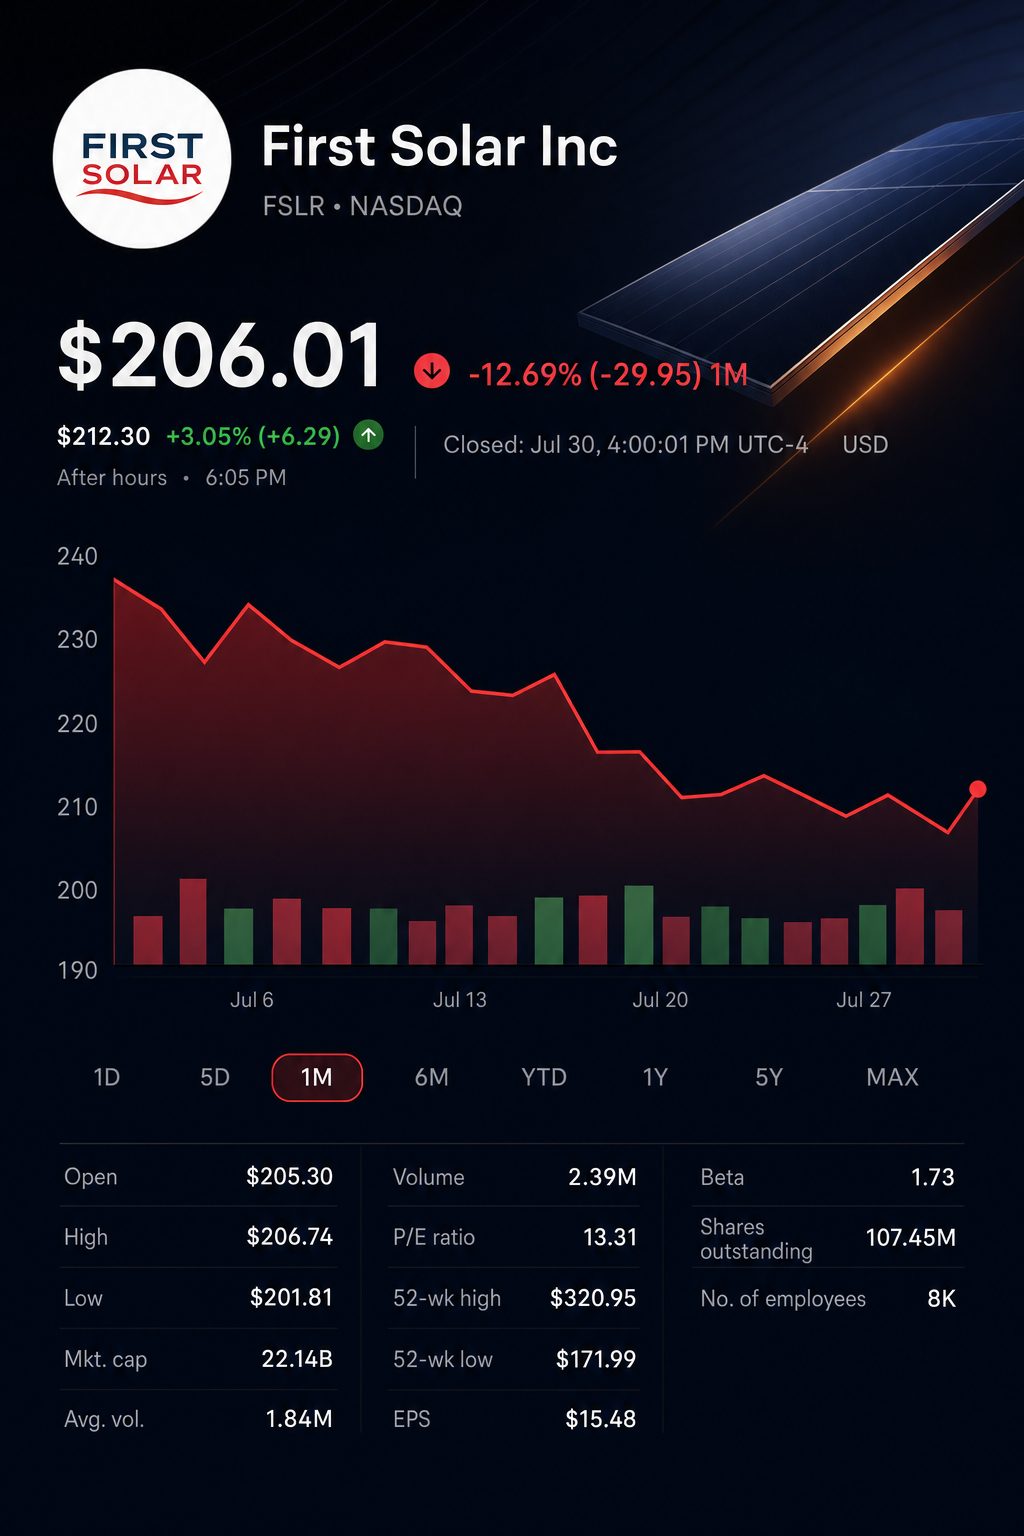
- The stock finished the session at $206.01, gaining 3.4%, and later traded around $212.30 after the market closed.
- Earnings in the second quarter came in at $3.92 per share, surpassing the analyst consensus of $2.99. Revenue was in line with the projected $1.06 billion.
- Initial estimates show an $88.6 million tariff-refund gain accounted for 84% of the rise in gross profit.
First Solar, Inc. NASDAQ:FSLR gained roughly 3% in after-market trading on Thursday after quarterly earnings surpassed forecasts, though its full-year guidance was left steady. U.S. regular trading had ended prior to the announcement.
The margin improvement was not as extensive as it appeared, with about 84% of the annual gross-profit growth coming from an estimated $88.6 million tariff refund.
Excluding just that benefit, preliminary gross margin stands at 48.9%. This figure is higher than last year’s 45.6%, but significantly under the reported 57.3%.
Thursday’s advance offset some of the losses from the previous week. The stock is still down 35.8% from its peak on June 3.
| Market comparison | Price | Return |
|---|---|---|
| Week ending July 24 | $202.82 | -4.3% compared to July 17 |
| July 24 through July 30 | $206.01 | +1.6% |
| After-hours, approximately 17:30 EDT | Approximately $212.30 | +3.1% over the close |
| Distance from June 3 high | High of $320.95 | -35.8% |
First Solar reported a drop in sales despite an increase in module shipments. Reduced contract-termination revenue and softer average prices outweighed the gains from higher volumes.
| Second-quarter scorecard | Q2 2026 | Q2 2025 | Change | Analyst consensus |
|---|---|---|---|---|
| Net sales | $1.056 billion | $1.097 billion | -3.7% | $1.06 billion |
| Diluted earnings per share | $3.92 | $3.18 | +23.3% | $2.99 |
| Net income | $422.6 million | $341.9 million | +23.6% | — |
| Adjusted EBITDA | $644 million | $560 million | +15.0% | — |
| Gross margin | 57.3% | 45.6% | +11.7 points | — |
| Module volume sold | 3.7 GW | 3.6 GW | +5.3% | — |
The margin bridge shows a sharp contrast. Gross profit as reported rose by $105.2 million, with the refund benefit reaching $88.6 million.
| Gross-profit comparison | Reported Q2 2026 | Preliminary ex-refund | Q2 2025 |
|---|---|---|---|
| Gross profit | $605.0 million | $516.4 million | $499.9 million |
| Gross margin | 57.3% | 48.9% | 45.6% |
| Year-on-year profit rise | $105.2 million | $16.6 million | — |
| Annual growth rate | 21.0% | 3.3% | — |
Initial estimate: gross profit reported minus the stated net tariff-refund benefit, then divided by reported sales. This does not factor in logistics, manufacturing credits, additional tariffs, or taxes.
Cash flow diverged from reported accounting earnings. Operations in the first half consumed $359.8 million in cash, while net income stood at $769.2 million.
Cash outflows included $649.3 million for government-credit receivables. Inventory accounted for a further $306.0 million, and receivables required $141.0 million. Overall inventory increased by 31% compared to December. Finished goods jumped by 66%.
The backlog shrank this quarter, with volume decreasing to 45.1 gigawatts from 47.9 gigawatts, and contracted value dropping to $13.6 billion.
| Backlog comparison | Q1 2026 | Q2 2026 | Quarterly change |
|---|---|---|---|
| Backlog volume | 47.9 GW | 45.1 GW | -5.8% |
| Total contract value | $14.4 billion | $13.6 billion | -5.6% |
| Contracted value per watt | $0.301 | $0.302 | +0.3% |
More recent orders provide some balance. First Solar announced 1.9 gigawatts of new U.S. bookings at approximately $0.36 per watt, factoring in contractual adjusters. This figure is around 19% higher than the basic backlog value, although these metrics are not directly equivalent.
Chief Executive Mark Widmar said the firm prioritises “long-term value over short-term booking volume.” Chief Financial Officer Alex Bradley stated the U.S. fleet was “substantially committed through 2028.” Investing.com
Management maintained its 2026 guidance ranges. The outlook includes an expectation of $2.10 billion to $2.19 billion in Section 45X manufacturing tax credits.
| 2026 outlook | Previous estimate | Updated estimate |
|---|---|---|
| Module sales | 17.0–18.2 GW | 17.0–18.2 GW |
| Net revenue | $4.9–$5.2 billion | $4.9–$5.2 billion |
| Gross earnings | $2.4–$2.6 billion | $2.4–$2.6 billion |
| Adjusted EBITDA | $2.6–$2.8 billion | $2.6–$2.8 billion |
| Capital expenditure | $0.8–$1.0 billion | $0.8–$1.0 billion |
| Net cash at year-end | $1.7–$2.3 billion | $1.7–$2.3 billion |
| Section 45X incentives | $2.10–$2.19 billion | $2.10–$2.19 billion |
At the halfway point, projected manufacturing credits represent about 86% of the gross-profit outlook. This is a straightforward comparison and does not indicate profit at risk.
Friday’s full-session response is the next key indicator. In the coming week, clarity on tariff refunds and any updates on national-security trade policies might influence shares. Investors will also watch if July bookings help backlog levels steady.
Risks: The tariff refund figure is provisional and subject to updates. Adjustments in policy may impact tariff recovery or the economics of manufacturing credits. Costs related to Southeast Asian underused capacity are about $30 million each quarter. The projected cost for the Series 7 warranty remains $47 million.
Related articles: Renewable Energy