
NEW YORK, August 16, 2026, 20:16 EDT
- The VIX declined to 14.56, about 25% under its historical average.
- This level suggests the S&P 500 would move by approximately 0.92% each day.
- Increasing tail hedges and subdued volume make the calm signal more complex.
Wall Street’s primary volatility index closed last week close to its 2026 low, but the options market signaled stronger demand for hedges against sharp, infrequent swings. The divergence holds significance as investors face a week notable for heavy retail activity, light volumes, and steady oil prices.
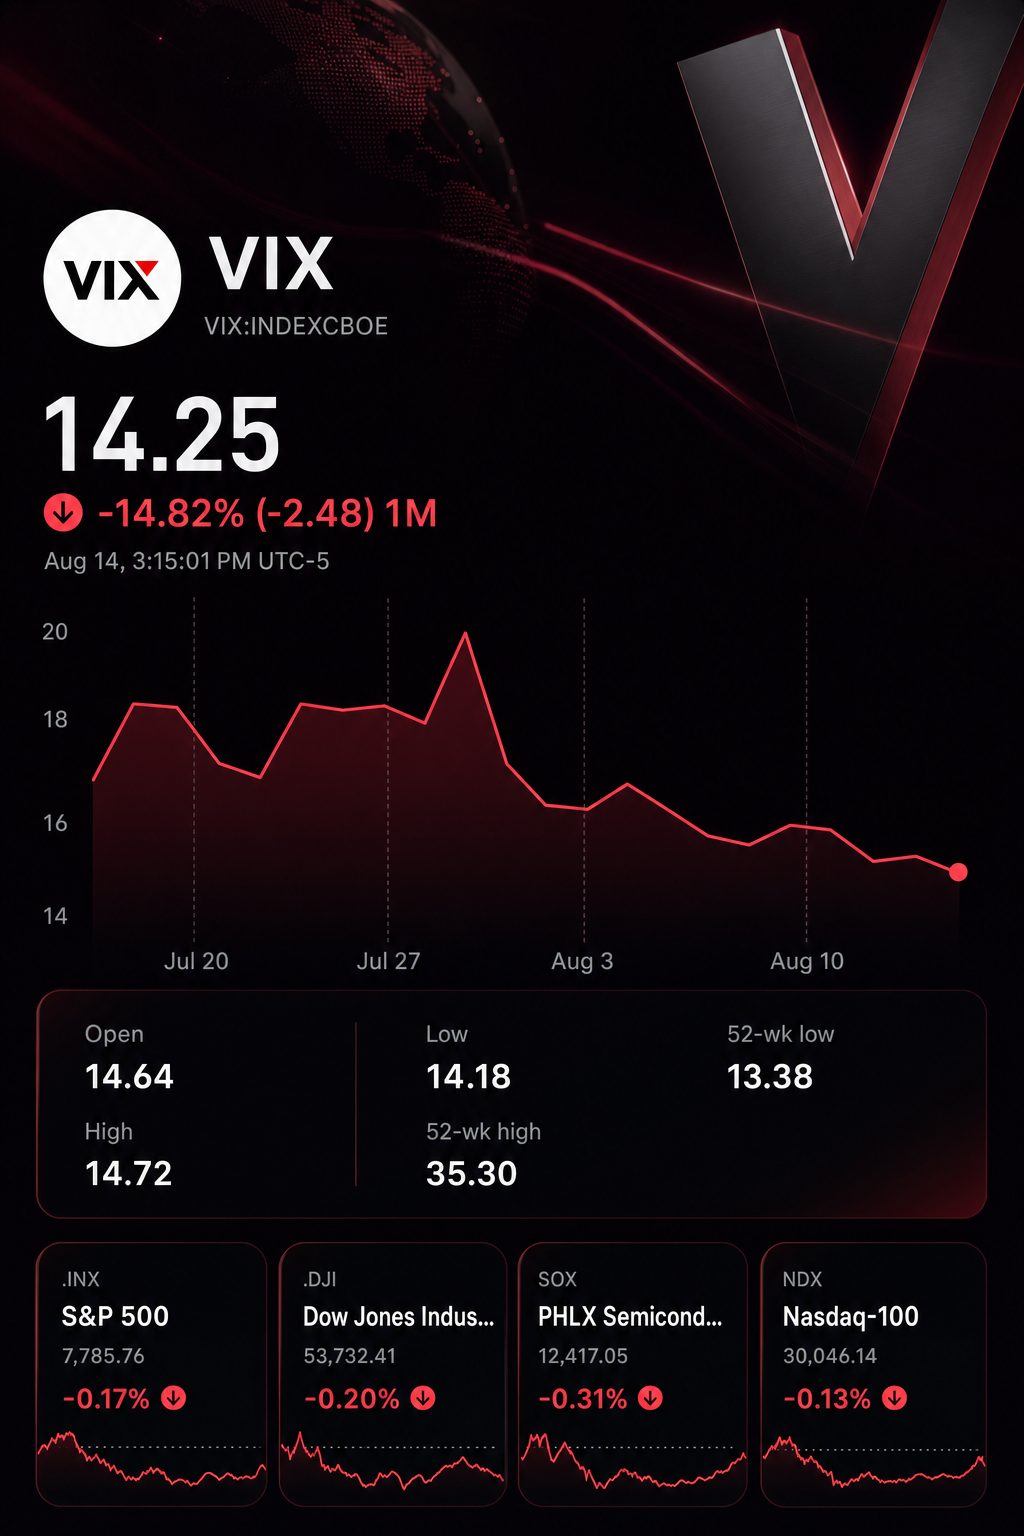
The Cboe Volatility Index, operated by Cboe Global Markets (CBOE:CBOE), slipped to 14.56 after reaching a session low of 14.28 on Friday. The VIX tracks projected 30-day volatility in the S&P 500, as implied by options pricing.
A 14.56 level implies a daily move of roughly 0.92% for a one-standard-deviation range. The figure comes from dividing annualized volatility by the square root of 252 trading days. This results in a tight trading band.
| Volatility measure | Latest reading | Investor comparison |
|---|---|---|
| VIX close | 14.56 | Roughly 25.1% under its long-term average of 19.45 |
| VIX Friday low | 14.28 | Approximately 26.6% under the long-run mean |
| Implied daily S&P 500 move | 0.92% | Reflects one standard deviation, VIX annualized then shown in daily terms |
| Cboe SKEW change since July | +6.6% | Indicates increased cost for potential sharp declines |
The outward calm does not indicate a straightforward risk-on environment. Cboe’s SKEW Index climbed 6.6% from July, even as spot volatility declined. Investors were spending less for typical price swings, yet paying a premium for protection from significant tail risks.
Friday saw subdued trading activity, with U.S. exchanges processing 9.6 billion shares, significantly below the 20-session average of 17.4 billion. Trading participation fell approximately 44.8% under typical levels.
| Index | Friday | Week |
|---|---|---|
| S&P 500 | -0.17% | up 0.4% |
| Nasdaq Composite | -0.28% | up 0.1% |
| Dow Jones Industrial Average | -0.20% | down 0.6% |
| Russell 2000 | up 0.5% | up 1.1% |
The S&P 500 managed to log a third straight weekly advance. Its most significant daily swing was 0.65% on Thursday. For the first week since May 1, the Nasdaq did not post a 1% daily change in either direction.
Elsewhere, markets showed a less steady picture. The 10-year Treasury yield stayed close to 4.7%, and Brent crude saw a notable increase on Friday. Sunday evening trading saw minimal movement in futures, with Nasdaq 100 futures gaining 0.1%.
| Cross-market signal | Reading | Why it matters |
|---|---|---|
| U.S. share volume | 9.6 billion | 44.8% under the 20-day average |
| 10-year Treasury yield | About 4.7% | Discount rate remains elevated even as equity volatility stays low |
| September Fed decision | 67% hold probability | A hike still holds a one-in-three chance |
| Consumer sentiment | 51 | Misses the 54.5 Reuters consensus |
As a result, investor positioning is more complex than what is indicated by the VIX headline. Thomas Martin from GLOBALT stated, “A lot of the drivers in the market right now are around various parts of AI.” Despite strong earnings, several technology stocks were hit by lofty expectations. Reuters
| Analyst | Date | Verified recommendation or view | Investor implication |
|---|---|---|---|
| Daniel O’Regan, Mizuho | August 14 | Called the market’s lack of significant response to geopolitical news “headline fatigue” | A modest index shift should not be seen as evidence event risk has gone away |
| Thomas Martin, GLOBALT | August 14 | Highlighted that expectations connected to AI are major factors for markets | Prioritize individual company choices over general low-volatility strategies |
| Koen Hoorelbeke, Saxo | July 1, background | Recommended operating within the priced range, given high tail risk | Define event-specific exposure while standard volatility remains low |
This week will gauge if the current low-volatility environment remains in place. Residential construction figures are due on Tuesday. Minutes from the Federal Reserve will be released on Wednesday, and several leading U.S. retailers are scheduled to post results during the week. On Friday, initial manufacturing and services PMIs will be published.
The main threshold is not marked by a single VIX reading. The focus is on whether spot volatility holds at low levels even as SKEW, bond yields and oil prices stay elevated. A broader divergence would leave calm conditions more reliant on steady correlations and sufficient liquidity.
Risks: The VIX may stay low for extended stretches. Time decay can rapidly erode the value of protective options. Favorable retail figures or weaker economic data could also negate tail hedges even if equities do not decline.