
PERTH, August 24, 2026, 08:16 AWST – Pilbara Minerals PLS.AX reported record profit but faces the challenge of executing an A$653 million capital expenditure plan.
- Revenue for FY26 surged 152% to A$1.93 billion, while underlying EBITDA totaled A$1.14 billion.
- FY27 capital expenditure guidance indicates an almost twofold increase at the midpoint, with production projected to grow by approximately 21%.
- A final dividend of five cents has been reinstated, yet the projected yield remains under 1% at A$5.07.
- The average price target from analysts indicates just a 1.3% potential gain from the most recent confirmed closing price.
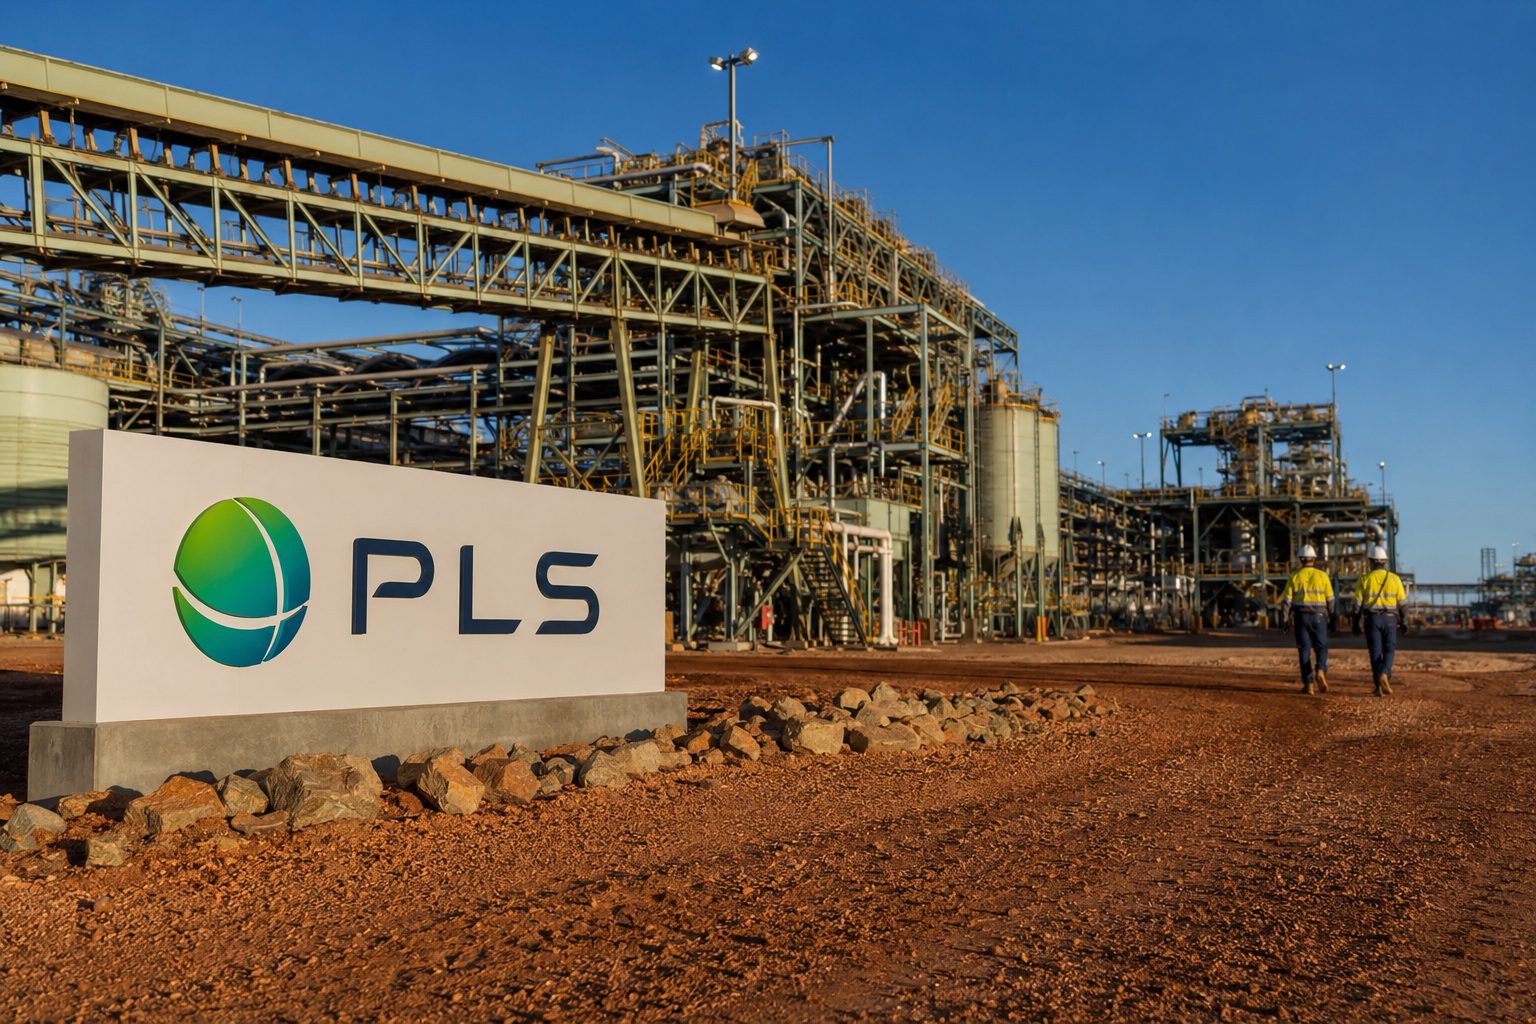
PLS Group Limited ASX:PLS posted its highest-ever annual earnings on Monday and reinstated its dividend. However, the main challenge for investors is a significant increase in growth expenditure.
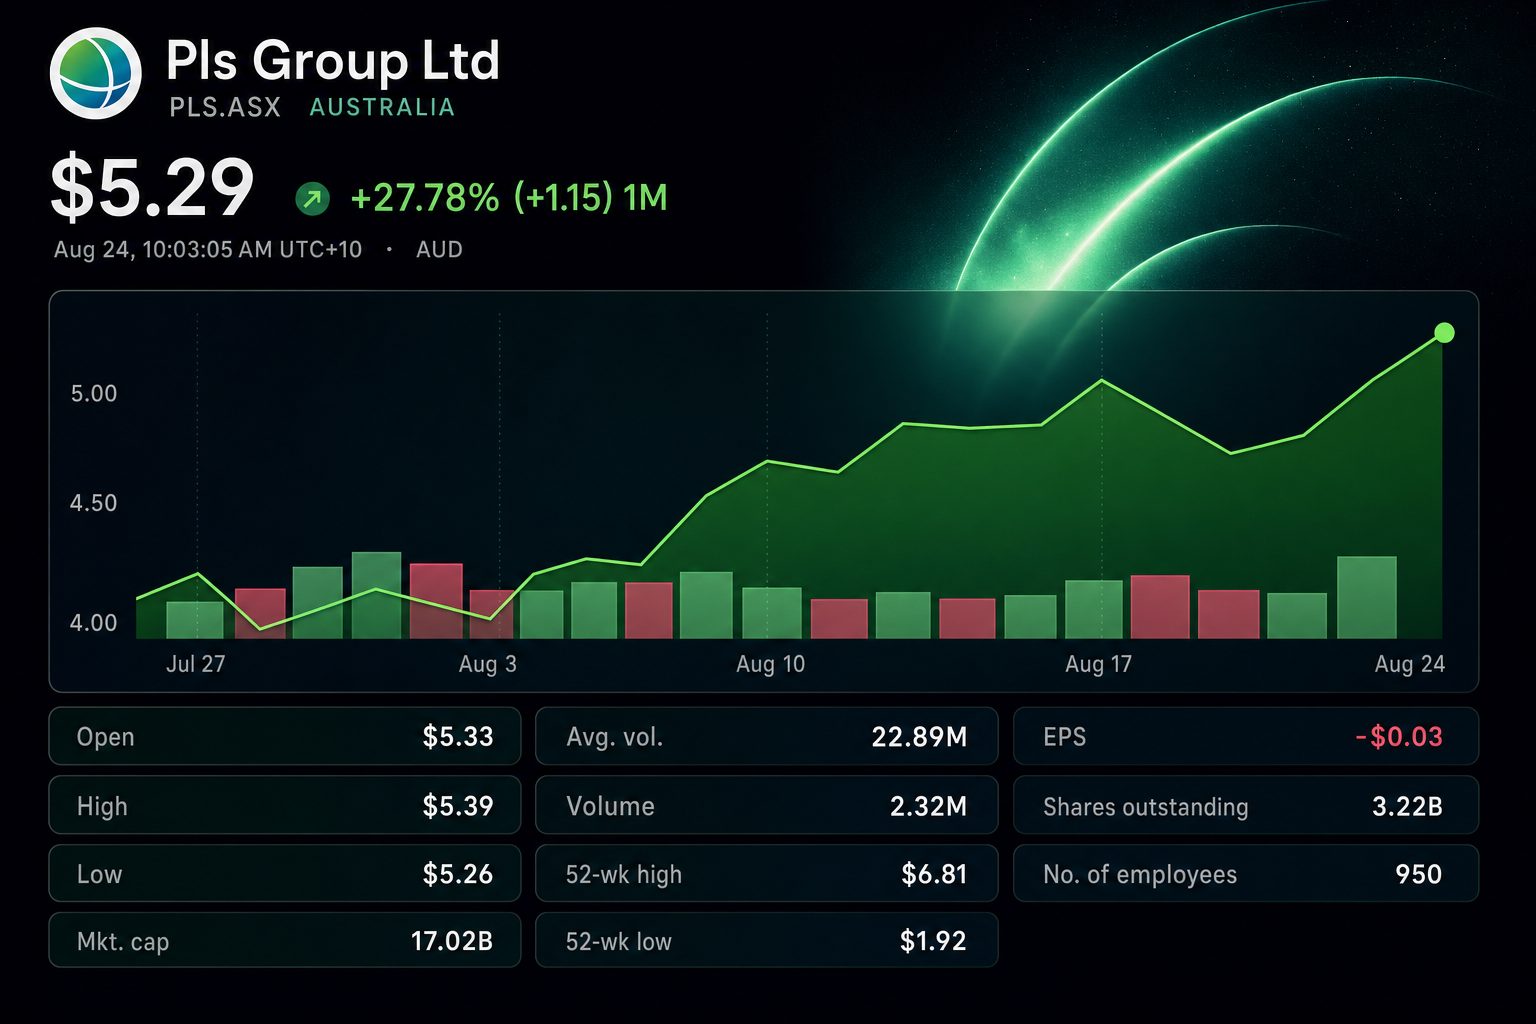
The lithium producer forecasts capital expenditure for FY27 to range from A$620 million to A$685 million. The midpoint of A$652.5 million is nearly twice the anticipated spend in FY26 and represents 57% of the most recent underlying EBITDA.
The balance is significant following a sharp pre-earnings rally. PLS ended trading at A$5.07 on August 21, gaining 4.97% for the day and advancing 138% over one year. This figure was logged at 16:12 AEST, prior to Monday’s announcement; no trades after the results could be confirmed at the time of publication.
| FY financial measure | FY26 | FY25 | Change |
|---|---|---|---|
| Revenue | A$1,934m | A$769m | up 152% |
| Underlying EBITDA | A$1,137m | A$97m | soars 1,067% |
| Net profit after tax | A$526m | A$196m loss | Returns to profit |
| Year-end cash | A$2,290m | A$974m | up 135% |
Most of the earnings increase was driven by pricing. The estimated realised spodumene price climbed to US$1,488 a tonne, more than doubling. Increased shipments also contributed to gains.
| Operating measure | FY26 | FY25 | Change |
|---|---|---|---|
| Production | 879.5kt | 754.6kt | +17% |
| Sales | 891.6kt | 760.1kt | +17% |
| Realised price, SC5.2 CIF China | US$1,488/t | US$672/t | +121% |
| FOB unit operating cost | A$569/t | A$627/t | -9% |
Chief Executive Dale Henderson described FY26 as “a record year for PLS”. He stated the company is transitioning its emphasis from defence to expansion. The Motley Fool Australia
The balance sheet provides management with flexibility. Cash increased to A$2.29 billion, and borrowings totaled A$853 million. As a result, net cash prior to lease and convertible modifications stood at roughly A$1.44 billion.
Part of the funding was secured through financing. PLS raised US$600 million via senior notes and obtained a US$100 million prepayment from a customer in FY26. Operating cash flow also remained strong.
| FY27 item | Guidance | Midpoint | Change from FY26 |
|---|---|---|---|
| Production | 1,030–1,100kt | 1,065kt | up 21% |
| FOB unit cost | A$575–625/t | A$600/t | rise of 5% |
| Capital expenditure | A$620–685m | A$652.5m | increase of 99% |
| P2000 pre-FID work | About A$175m | About A$175m | Additional growth investment |
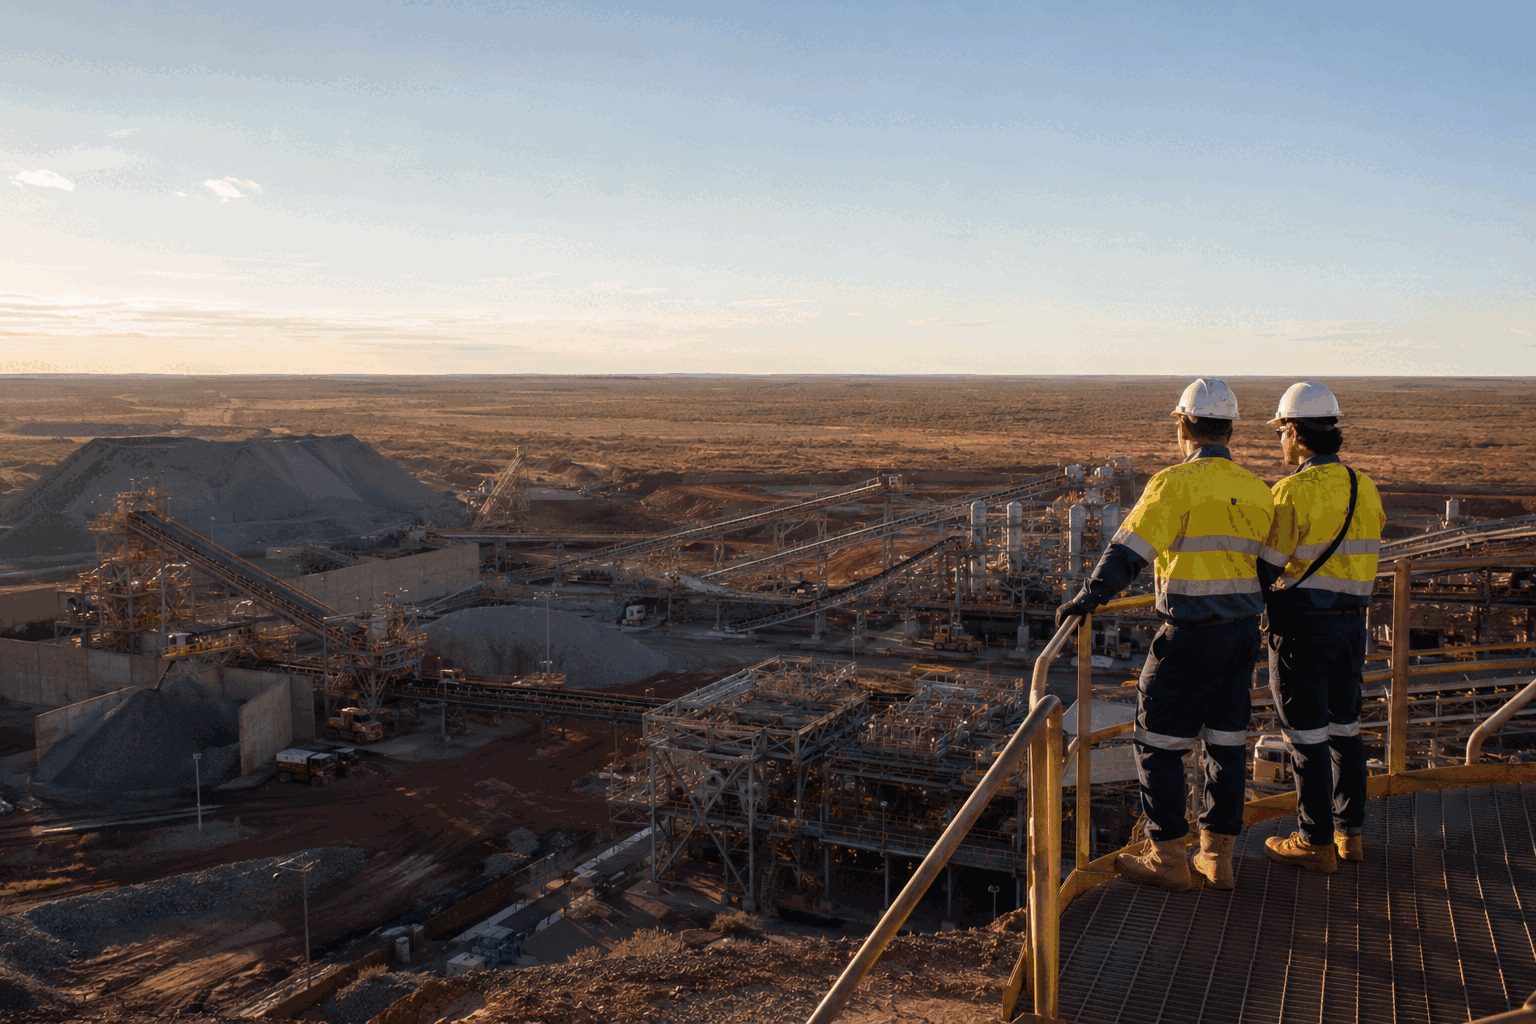
The investment aims to increase Pilgangoora’s output to around two million tonnes a year. A feasibility study for the P2000 expansion is scheduled for completion in the December 2026 quarter. The estimate does not include any potential P2000 expenditure after approval.
The resumed operations at the Ngungaju plant are expected to increase output. Guidance also indicates that this will drive unit costs up. At this stage, strong execution is more important than previous profit results.
The fully franked final dividend of five cents comes to approximately A$161 million. This accounts for 22% of adjusted free cash flow, fitting within PLS’s framework of 20% to 30%. The suggested yield is around 0.99% when measured at A$5.07.
| Analyst view | Count | Share of 17 | Reference |
|---|---|---|---|
| Buy | 8 | 47% | JPMorgan A$7.10; RBC A$7.00 |
| Hold | 6 | 35% | Consensus classification |
| Sell | 3 | 18% | Consensus classification |
| Average target | — | — | A$5.138; 1.3% greater than A$5.07 |
While sentiment is positive, the valuation is not considered low. Out of 17 analysts, eight recommend buying the shares. However, the average price target of A$5.138 is just 1.3% higher than the most recent confirmed closing price.
Risks: Lithium prices continue to be unpredictable. Lower prices could pressure margins while PLS increases expenditure and costs. Setbacks at P2000, Ngungaju, or international projects would also undermine growth projections.
The coming week will indicate if unprecedented cash generation is enough to cover investment spending. For shareholders, this now defines the rally’s benchmark.

![Australia Stock Market Today 24/08/2026 [UPDATE: 12:39 AEST] [Uranium Surge Widens ASX Gain as Banks and Insurers Lag]](https://ts2.tech/wp-content/uploads/2026/08/AU-market-dashboard-2026-08-24-1239-480x384.jpg "Australia Stock Market Today 24/08/2026 [UPDATE: 12:39 AEST] [Uranium Surge Widens ASX Gain as Banks and Insurers Lag]")
![Asia Stock Market Today 24/08/2026 [UPDATE: 10:05 SGT] [Alibaba’s AI Placement Deepens Asia’s Heavyweight Selloff]](https://ts2.tech/wp-content/uploads/2026/08/Asia-market-dashboard-2026-08-24-1005-480x384.jpg "Asia Stock Market Today 24/08/2026 [UPDATE: 10:05 SGT] [Alibaba’s AI Placement Deepens Asia’s Heavyweight Selloff]")