
GOODLETTSVILLE, Tennessee, August 24, 2026, 10:21 CDT
- New projections indicate that the initial 2027 Social Security cost-of-living adjustment (COLA) will range from 3.4% to 3.6%.
- This range would increase yearly OASDI payments by approximately $56.5 billion to $59.8 billion, prior to any offsets.
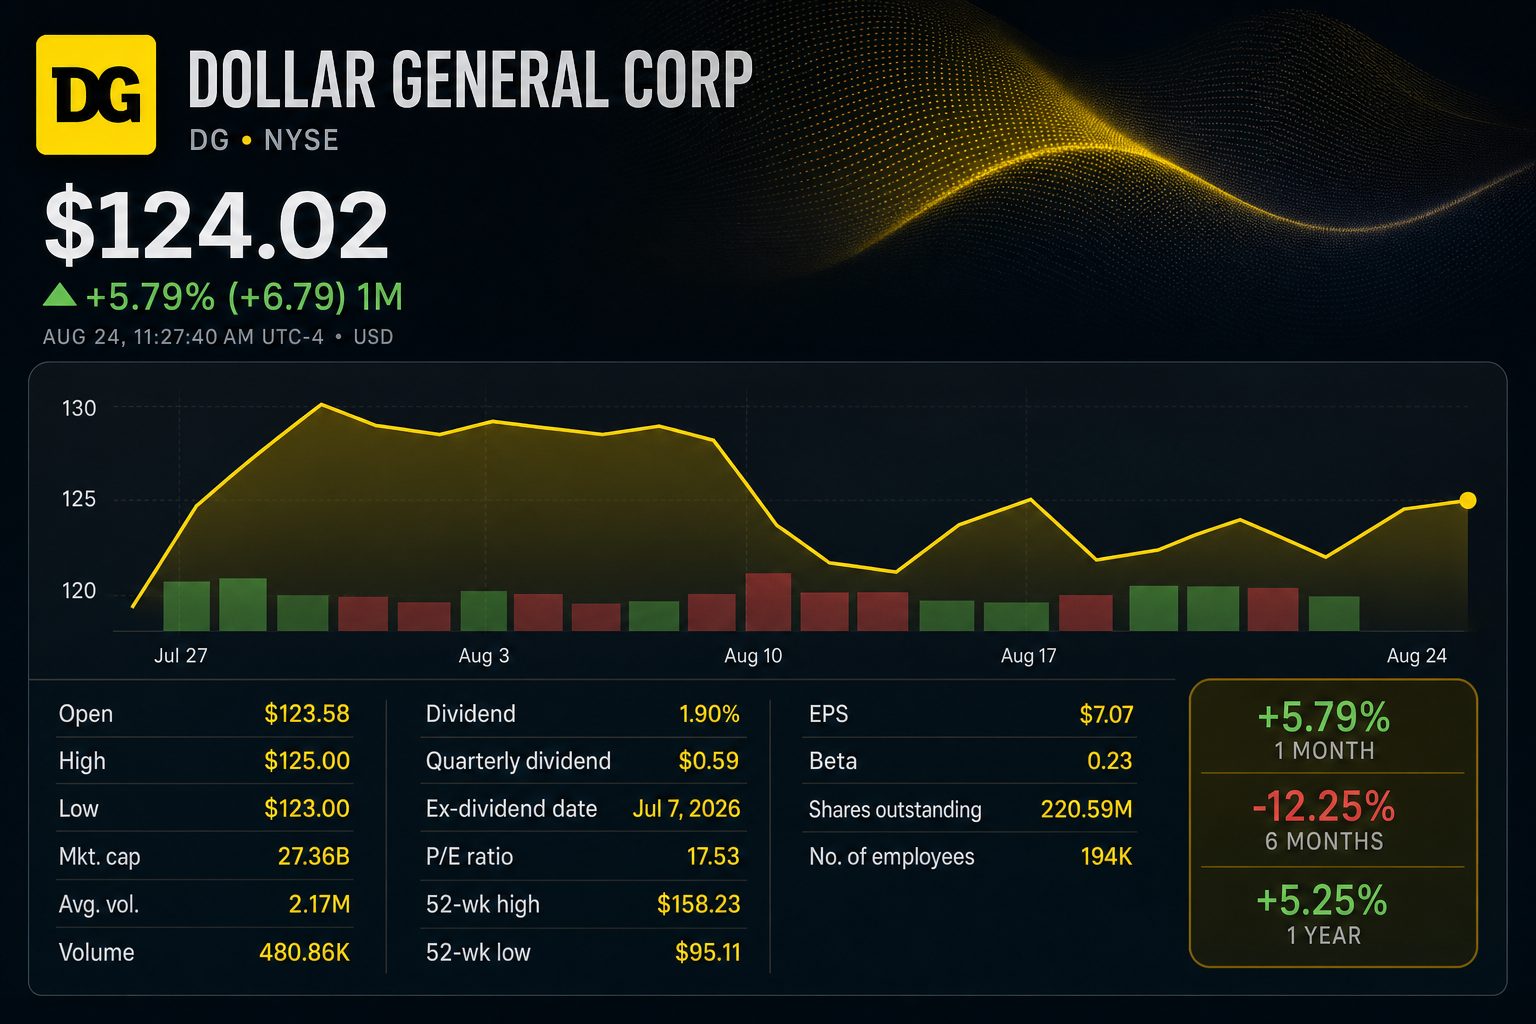
- Shares of Dollar General rose 0.85%, reaching $124.46 at 09:58 EDT.
- The retailer is set to release its quarterly results on August 27, with customer traffic likely to be the more immediate driver for the stock.
A 3.6% Social Security cost-of-living adjustment may boost yearly benefit payouts by nearly $60 billion. The early estimate is attracting renewed search activity in the United States and presents a concrete gauge of demand for Dollar General Corporation NYSE:DG.
The Senior Citizens League is forecasting a 3.6% increase for 2027. Independent expert Mary Johnson predicts a 3.4% rise, while AARP anticipates a 3.5% adjustment. The official figure, set to be released October 14, will be based on inflation during the third quarter.
| 2027 COLA outlook | Projection | Yearly increase for typical retired worker |
|---|---|---|
| Mary Johnson | 3.4% | $851 |
| AARP | 3.5% | $876 |
| The Senior Citizens League | 3.6% | $901 |
| 2026 result | 2.8% | $701 equivalent |
The figures are strikingly straightforward. In July, Social Security disbursed $138.41 billion to 71.34 million recipients. Using the projected range results in an increase of $4.71 billion to $4.98 billion in monthly cash flow.
| COLA scenario | OASDI monthly boost | Total annual rise | Additional over 2.8% |
|---|---|---|---|
| 3.4% | $4.71 billion | $56.47 billion | $9.97 billion |
| 3.5% | $4.84 billion | $58.13 billion | $11.63 billion |
| 3.6% | $4.98 billion | $59.79 billion | $13.29 billion |
Dollar General provides an effective retail distribution network. In the first quarter, consumables accounted for 82.4% of sales. Visits to stores increased by 1.4%, and the typical purchase amount rose by 0.5%. As a result, minor adjustments in household finances can have an impact on results.
The following table presents a sensitivity analysis and does not serve as a market share forecast. Capturing 0.5% of the total gross benefit increase would represent between $282 million and $299 million, equating to approximately 0.7% of Dollar General’s projected fiscal 2025 sales.
| Assumed market share | Impact on revenue | Portion of FY2025 revenue | Portion of projected FY2026 increase |
|---|---|---|---|
| 0.25% | $141 million-$149 million | 0.33%-0.35% | About 8% |
| 0.50% | $282 million-$299 million | 0.66%-0.70% | About 17% |
| 1.00% | $565 million-$598 million | 1.32%-1.40% | About 34% |
The stock saw a moderate gain in Monday’s session. Dollar General was at $124.46 as of 09:58 EDT, up 0.85%. No confirmed link has been established between COLA searches and the price move.
| Dollar General summary | Value | Details |
|---|---|---|
| Stock price | $124.46 | August 24, 2026, 09:58 EDT |
| Session move | +0.85% | Prior close $123.41 |
| Market capitalization | $27.22 billion | 220.59 million shares outstanding |
| Trailing P/E ratio | 17.52 | As per MarketWatch |
| 52-week high/low | $95.11-$158.23 | Shares are trading 21% under the 52-week high |
The next test arrives Thursday. Analysts project quarterly revenue of approximately $11.19 billion and earnings of $2.01 per share, data from Google Finance shows. The company’s management forecasts full-year sales growth between 3.7% and 4.2%, with earnings ranging from $7.20 to $7.45 per share.
Chief Executive Todd Vasos stated that the retailer’s wide presence and focus on essential goods help it manage the economic environment. However, he noted that main shoppers have reduced spending on other household items, like food, as a result of increased fuel prices. Vasos warned that this strain might offset some of any future COLA gains.
| Analyst | Date | Recommendation | Target |
|---|---|---|---|
| Bank of America | June 2 | Buy | $175 |
| JPMorgan | August 18 | Buy | $170 |
| Bernstein | July 31 | Buy | $149 |
| Evercore ISI | July 7 | Hold | $135 |
| Piper Sandler | August 20 | Hold | $118 |
Inflation continues to be the main factor. U.S. consumer prices climbed 3.4% in July. Energy costs advanced 14.7%, and food prices increased by 3.0%. The COLA calculation relies on a different index and considers data from three months, meaning the official rate has not yet been determined.
Risks: An increase in Medicare premiums could offset the net gain for recipients. Rising prices for fuel and food might use up more of the payment. Dollar General is also exposed to risks related to execution, inventory, and wages prior to any benefit in 2027 reaching its customers.
The investor signal remains conditional. A gross benefit rise of nearly $60 billion is significant enough to monitor. Data on Thursday regarding traffic and basket size will indicate if Dollar General is able to translate household relief into increased sales.