
OMAHA, Nebraska, August 8, 2026, 09:22 CDT — U.S. cash markets are shut for the weekend.
- Berkshire bought back $4.53 billion worth of its shares during the last quarter, with additional July buybacks over $3.3 billion.
- A reported currency movement accounted for 66% of the rise in operating profit.
- Class B shares rose 2.0% over the past week, underperforming the S&P 500, which climbed 3.6%.
Berkshire made net equity purchases and buybacks totaling approximately $24 billion last quarter, breaking a streak of 14 consecutive quarters as a net seller of stocks. This change represents Greg Abel’s most significant move on capital allocation since he took over as chief executive.
The reported profit increase requires further context. Operating income climbed by $1.82 billion, or 16.3%, reaching $12.98 billion. Of that rise, 66% came from a $1.20 billion shift in stated debt-related currency impacts.
When excluding that reported item, adjusted earnings increased approximately 5.2%. This figure is based on calculations rather than company disclosures. As a result, the change in spending sends a clearer signal than the headline percentage.
| Capital measure | First quarter 2026 | Second quarter 2026 | July 2026 |
|---|---|---|---|
| Share buybacks | $0.24 billion | $4.53 billion | Over $3.3 billion |
| Net movement in equity | Net seller | Roughly $19.8 billion net buyer | Not provided |
| Cash position | $380.2 billion | $364.7 billion | Not provided |
Quarter-end cash values are reported. Repurchases in July reflect only those disclosed.
Cash declined by just 4.1% over the quarter but remained at $364.7 billion. Berkshire increased its investment in Alphabet Inc. (NASDAQ:GOOGL; NASDAQ:GOOG) by $10 billion, making the position one of Berkshire’s largest publicly listed holdings.
Repurchase prices can serve as an additional reference for valuation. Based on reported transactions, the average for May-June Class B equivalents was about $486. The closing price on Friday of $521.80 was 7.3% higher than that benchmark.
That figure does not represent a price target. Berkshire allows buybacks solely when shares trade beneath what it assesses as conservatively calculated intrinsic value. The average price paid for July repurchases has not been revealed.
Cathy Seifert, a CFRA analyst who holds a neutral rating, described the outcome as “a pretty healthy beat.” She noted Abel has been steadily stepping into his role as Berkshire’s new leader. Reuters
The business mix was mixed. Manufacturing, services and retail were responsible for the biggest increase in dollar terms. Both insurance underwriting and investment income declined.
| After-tax operating profit | Q2 2026 | Q2 2025 | Change |
|---|---|---|---|
| Insurance underwriting | $1.73 billion | $1.99 billion | -13.1% |
| Insurance investment returns | $3.06 billion | $3.37 billion | -9.1% |
| BNSF railroad | $1.56 billion | $1.47 billion | +6.3% |
| Berkshire Hathaway Energy | $0.89 billion | $0.70 billion | +26.9% |
| Manufacturing, service and retail operations | $4.47 billion | $3.60 billion | +24.1% |
| Other | $1.27 billion | $0.03 billion | +$1.24 billion |
| Total operating profit | $12.98 billion | $11.16 billion | +16.3% |
| Total excluding specified currency line | $12.66 billion | $12.04 billion | +5.2% |
This is an estimated figure, not disclosed by the company. It excludes a $326 million gain in 2026 and an $877 million loss in 2025.
Net income surged to $25.67 billion, more than twice the previous amount. This figure reflects $12.68 billion in investment gains. Berkshire cautions that net earnings may be distorted by quarterly market fluctuations.
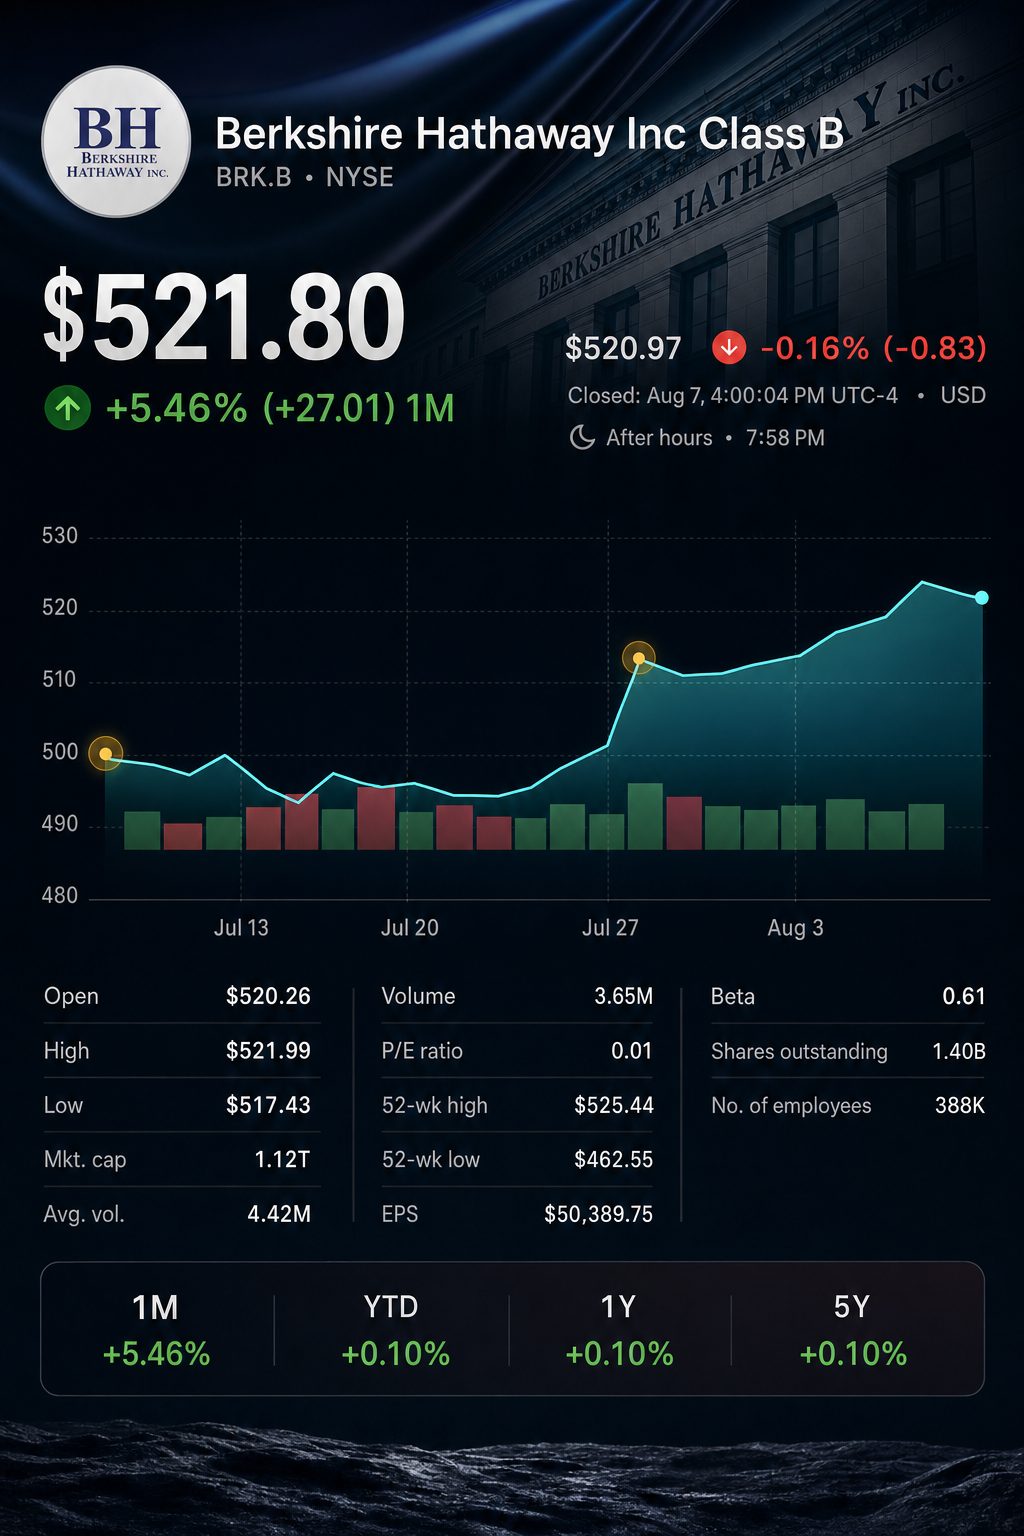
The shares were unable to reflect Saturday’s report in their pricing. Class B rose 2.0% over the past week, lagging behind the wider market upswing. On Friday, it ended down 0.54% at $521.80.
| Market measure | Friday close | Friday move | Weekly move |
|---|---|---|---|
| Berkshire Class B | $521.80 | down 0.54% | up 2.0% |
| S&P 500 | 7,757.64 | up 0.6% | rising 3.6% |
| Nasdaq Composite | 26,690.62 | gained 1.3% | advanced 5.2% |
Analyst opinions are scarce and split. Released targets might not account for Saturday’s outcome. Two existing datasets suggest limited movement from Friday’s closing price.
| Recommendation source | Analysts | Rating mix | Consensus | Average target | Implied move |
|---|---|---|---|---|---|
| WSJ market data | 7 | 2 Buy, 4 Hold, 1 Sell | Hold | $509.86 | -2.3% |
| StockAnalysis | 4 | Not displayed in summary | Buy | $525.33 | +0.7% |
Based on Friday’s closing price of $521.80. Analyst coverage varies according to different sources.
The market’s initial response will be seen at Monday’s open. The upcoming major economic indicator, July consumer prices, is due Wednesday. Producer price data and retail sales figures will be released afterwards.
| Date and time | U.S. release | Berkshire relevance |
|---|---|---|
| Wednesday, August 12, 08:30 ET | July consumer prices | Interest rates, stock valuations and returns on cash |
| Thursday, August 13, 08:30 ET | July producer prices | Costs for industry and input materials |
| Friday, August 14, 08:30 ET | July retail sales | Trends in consumer demand at operating businesses |
Stronger inflation may push Treasury yields and Berkshire’s cash income higher, while weighing on equity valuations and housing demand. Weaker data would likely unwind much of that move.
Risks: Insurers saw a drop in earnings, although operating growth benefited from currency movements. Repurchases may decelerate as shares approach record highs. Gains from investments are vulnerable to reversal, and stronger inflation could push discount rates higher.