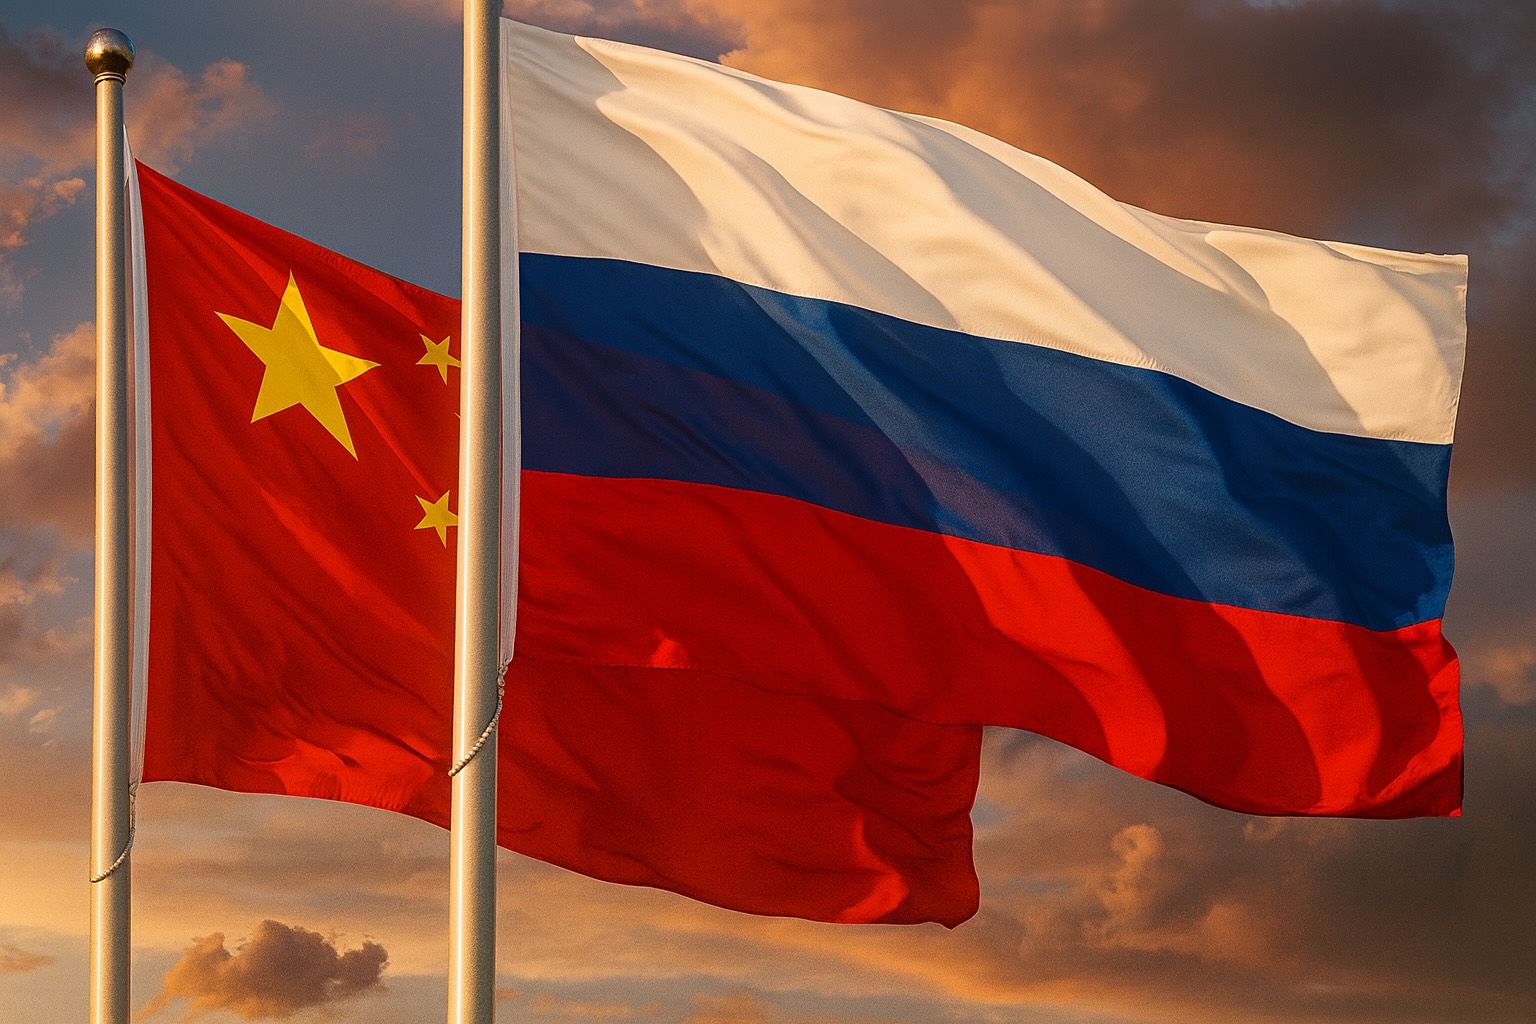
- New trade pact: On Oct. 27, 2025 Russia’s parliament ratified an updated China–Russia investment and trade treaty (agreed May 8), aiming to liberalize and expand commercerussiaspivottoasia.com. Officials pledged to boost high-tech, digital and energy trade1 .
- Deal highlights: The pact includes the recently signed Power of Siberia-2 gas pipeline memorandum (signed during Putin’s Sept. visit to China)reuters.com and plans to settle more trade in yuan/rubles (de-dollarizing)2 .
- Market moves (Oct 30): China’s Shanghai Composite closed ~3,986.9 (–0.73%)english.news.cn and Hong Kong’s Hang Seng ~26,282.7 (–0.24%)marketscreener.com. Russia’s MOEX index rose modestly (to ~2,532 points, +0.3%) by mid-morningtass.com. By contrast, US stocks hit all-time highs on global trade optimism3 .
- Trade context: Bilateral trade hit a record $244.8 billion in 2024reuters.com, but was ~9% lower in H1 2025themoscowtimes.com. China’s exports to Russia fell sharply in Sept. (–21% yoy)reuters.com even as imports from Russia ticked up.
- Energy & sanctions: The two sides vowed closer energy ties (expanding LNG, nuclear, pipelines) even as US/EU sanctions target Russian oil and banking. Oil prices rose on the news (WTI ~$60, Brent ~$64) and gold surged near $3,950/ozindopremier.com4 .
New China–Russia Trade Agreement
China and Russia have upped their economic partnership with a new set of agreements. In late October 2025 Beijing and Moscow announced that they would “push for a stable expansion of two-way trade with an optimized structure”en.people.cn. Commerce Minister Wang Wentao and Russia’s economic minister Reshetnikov co‑chaired a subcommittee meeting on Sept. 28, where they agreed to deepen cooperation in areas from digital services to infrastructure. Most notably, President Putin signed (Oct. 27) the law ratifying an updated Bilateral Investment Treaty with Chinarussiaspivottoasia.com. This overhaul — originally agreed in May — strengthens legal protections for investors and introduces “single-window” support and visa facilitation for businesspeople, addressing hurdles that had stalled cooperation.
The new agreement formally extends the “Power of Siberia 2” gas pipeline project. Gazprom CEO Alexei Miller confirmed that a “legally binding memorandum” was signed during Putin’s September visit, kicking off construction of the pipeline through Mongoliareuters.com. Industry analysts at the Oxford Institute project that even with a final deal, first gas deliveries might not occur before 2030, with full ramp-up by mid-2030sreuters.comreuters.com. In parallel, Russia is expanding LNG supply to China (from projects like Arctic LNG 2 and Sakhalin 2)reuters.com. The overall aim is to diversify Russia’s markets beyond Europe and to secure China’s access to energy and raw materials as Western importers pull back.
Market Reaction
News of the China–Russia deal came amid euphoric global markets. On Oct. 29–30, world stocks were rising on optimism about easing U.S.–China trade tensionsts2.tech. In Hong Kong, the Hang Seng Index (already the world’s best performer in 2025, up ~35% YTDts2.tech) ticked down slightly by Oct. 30 (26,282.7, –0.24%)marketscreener.com. Mainland Chinese bourses also eased: Shanghai’s Composite fell 0.73% to 3,986.9english.news.cn on Oct. 30, reflecting some profit-taking after recent gains. By contrast, Russia’s MOEX exchange saw modest gains. The MOEX index was around 2,532 midday on Oct. 30 (up ~0.3%)tass.com, following a 1.13% jump on Oct. 29tass.com. Russian oil and mining stocks led the advance, buoyed by higher oil prices (Brent ~$64) and a weaker ruble. TASS finance analysts noted that rising oil prices and currency moves helped Russian shares5 .
In the United States, the news coincided with record highs on Wall Street. The Dow Jones Industrial Average closed near 47,706 and the S&P 500 near 6,890 on Oct. 29ts2.tech, driven by an AI‐tech rally and President Trump’s comments that he expects a U.S.–China trade deal soonts2.tech. Safe-haven assets also spiked – gold climbed to roughly $3,950/ozts2.tech and Bitcoin topped $125,000ts2.tech – as investors took profits on stocks and awaited central bank cues (the Fed was widely expected to cut rates on Oct. 30ts2.tech). Tech stocks led gains (Nvidia up ~5%), and even Chinese ADRs like Alibaba and JD.com jumped on renewed trade optimism (US-listed Chinese stocks were up 3–5% in late Oct.).
Economic and Geopolitical Context
China–Russia trade ties have soared in recent years under political pressure. In 2024, bilateral trade hit a record $244.8 billionreuters.com (up from $240.1B in 2023), despite falling growth rates. However, trade momentum has slowed: in the first three quarters of 2025, two-way trade was down ~8.6% (to ¥1.17 trillion)reuters.com, and Chinese exports to Russia plunged 21% in Sept. YoYreuters.com. Much of this reflects Western sanctions and banking hurdles. For example, recent US sanctions on Rosneft and Lukoil sent Russia’s MOEX index tumbling 3–4% on Oct. 23themoscowtimes.com, and Europe’s 19th sanctions package targeted Russian oil revenues.
The new trade deal aims to mitigate these pressures. Experts note that China and Russia are increasingly settling trade in yuan and rubles to bypass dollar-based systemstass.com. Chongyang Institute economist Wang Wen observes that China now gets 10–13% of its energy imports from Russia, and both sides are gradually “eliminating the dollar” from settlementstass.com. A Kremlin statement earlier in 2025 even touted the opening of new “trade corridors” via Central Asia to strengthen economic sovereignty.
From a Western perspective, closer Sino-Russian ties raise strategic concerns. U.S. officials have warned China against supplying weapons to Russia, even as they have dropped pressure on Chinese oil importsresponsiblestatecraft.org. Meanwhile, Europe fears that additional pipeline and LNG capacity to China will undercut its push to fully ban Russian energy by 2027. Some analysts caution that the pact could blunt sanctions’ effectiveness and create new economic blocs. For now, however, global investors remain focused on fundamentals: many portfolio managers highlight buoyant corporate profits and expectations of easier monetary policy as drivers of market rallies6 .
Expert Commentary and Outlook
Analysts and officials see the deal as part of a broader realignment. China’s Commerce Ministry noted that bilateral cooperation sets “a model” for major powersen.people.cn. BCS World of Investments (Moscow) noted that in the short term, rising oil prices (and a planned ruble tweak) have supported Russian equitiestass.com. On the Chinese side, commentators pointed out that even if trade dipped in 2025, longer-term potential is large. China’s Trade Minister and experts have forecast bilateral trade reaching $300 billion by 2030. In fact, Wang Wen (Chongyang Institute) predicts Russia will be in China’s top-5 trading partners by 2030tass.com. He also emphasized that China and Russia strive for a “fairer international monetary system” by reducing dollar reliance2 .
Looking ahead, forecasters expect continued expansion of strategic industries: tech joint ventures, cross-border e-commerce links, and Arctic shipping (the Northern Sea Route) are all on the agenda. Energy ties should deepen: analysts at Oxford Energy suggest that, even with pipeline projects, it may take a decade or more for gas exports to fully ramp upreuters.com. In the meantime, markets will watch for how the agreement affects supply chains and sanctions regimes. If Beijing increases its purchases of Russian commodities (energy, metals, agriculture), global commodity prices could see further shifts. Conversely, if Western powers retaliate (e.g. stricter secondary sanctions), investment flows might slow.
For investors and the public, the big-picture takeaway is that China and Russia appear determined to anchor each other’s economies. This could provide growth opportunities for Asian and emerging-market firms (energy, mining, infrastructure) even as Western firms face constraints. At the same time, experts warn of risk factors: markets are already trading near bubble valuations by some measurests2.tech, and geopolitical tensions could flare up unexpectedly. Overall, however, most analysts agree that the China–Russia trade pact cements a long‑term trend toward deeper Asia-centric trade, with far‑reaching implications for global markets and the world order.
Sources: Official announcements and data from Xinhua, TASS, Reuters, etc. (including TechStock² analysis)russiaspivottoasia.comen.people.cnenglish.news.cnmarketscreener.comtass.comreuters.comreuters.comtass.comreuters.comts2.tech. Each cited report provides the underlying figures and expert commentary.


