- Fordow lies beneath roughly 90 metres of limestone outside Qom and houses Iran’s most advanced uranium-enrichment cascades, with enrichment reaching 60% by June 2025 per the IAEA.
- Fordow was exposed by Western intelligence in 2009, had activity frozen under the JCPOA from 2013 to 2015, and restarted enrichment from 2019 to 2024, reaching 60% in 2025.
- Commercial satellites from Planet Labs, Maxar, and Airbus imaged Fordow almost hourly in mid‑June 2025.
- On 19 June 2025, new ventilation stacks appeared on roof section C of Fordow, signaling possible underground welding work.
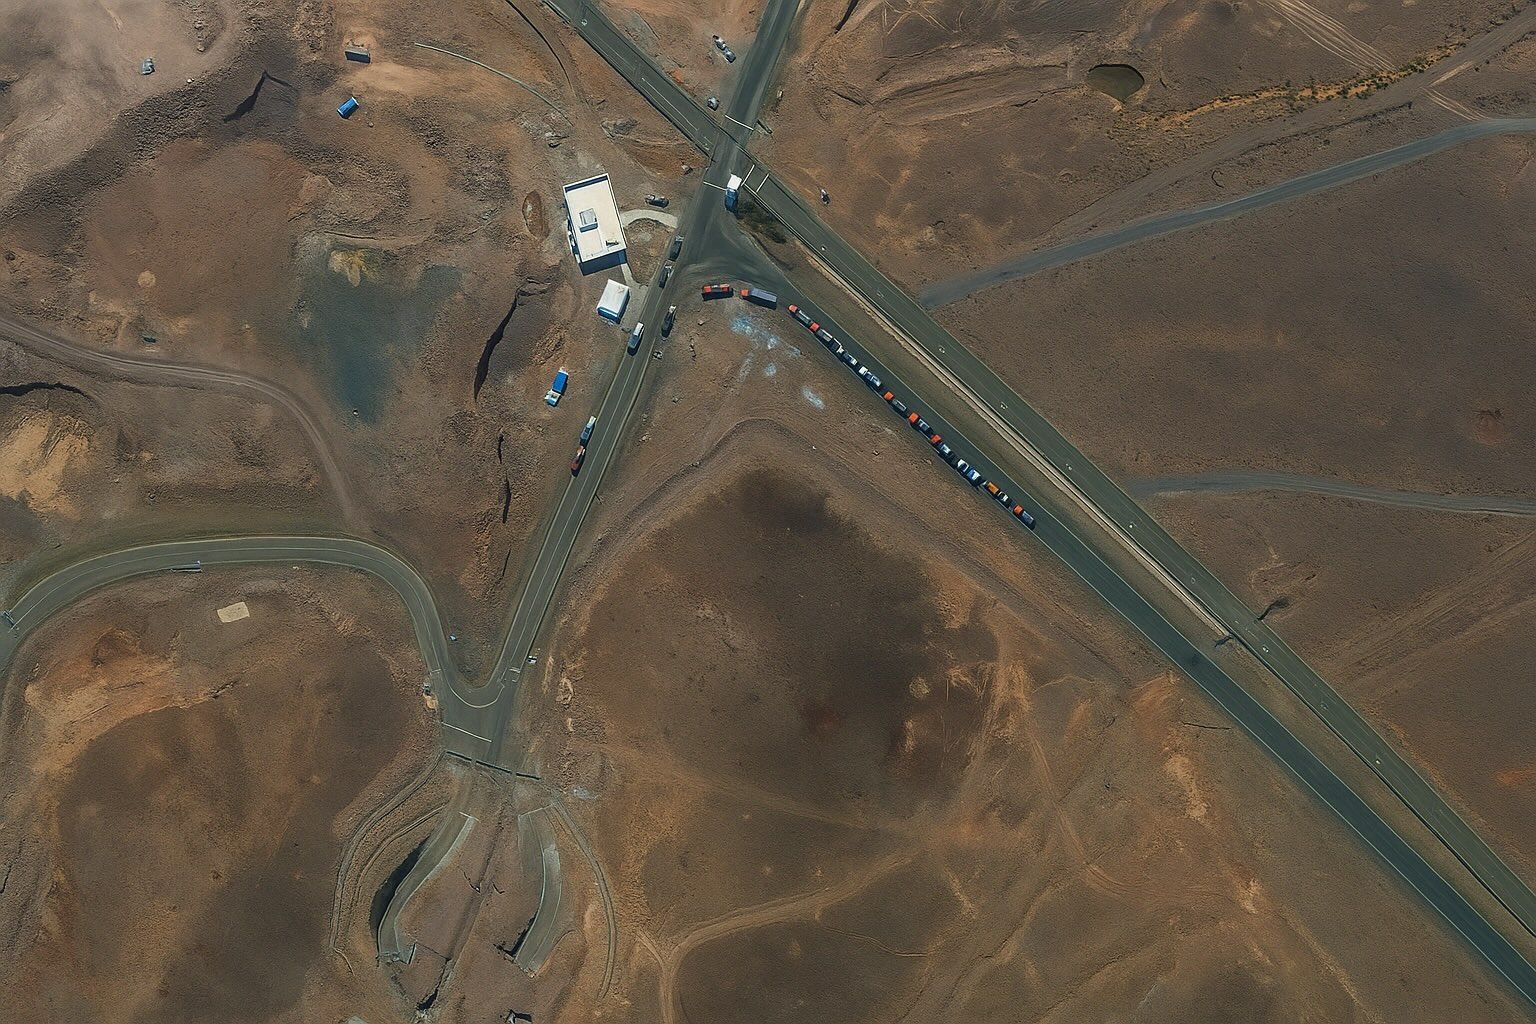
- On 20 June 2025, a convoy of five flat‑beds and two cranes was observed at the western tunnel portal, likely moving centrifuge stands or shielding.
- On 21 June 2025 at dawn, a bulldozer graded a berm near Portal 2 with fresh spoil piles visible, suggesting the construction of blast doors or a debris trap.
- Maxar imagery from 22 June 2025 showed collapsed power conduits and scorched portals at Fordow, while Natanz and Isfahan’s above‑ground facilities were damaged, with no proven breach of the deep halls.
- U.S. analysts matched truck counts and portal activity to SIGINT hints to justify a rapid bombing run, and President Trump announced a “spectacular military success” after B‑2s and Tomahawks struck Fordow, Natanz, and Isfahan.
- IAEA chief Rafael Grossi said on‑site cameras were destroyed and inspectors blocked, leaving the agency reliant on public satellite imagery for monitoring.
- The broader point is that commercial satellite imagery has become central to non‑proliferation work, exposing prestrike activity, guiding targeting, and enabling post‑strike assessment, even as it cannot alone seal a centrifuge hall.
In the 48 hours before U.S. B‑2 bombers punched bunker‑busting holes into Iran’s Fordow, Natanz and Isfahan complexes, a burst of commercial‑satellite photos captured trucks, bulldozers and security convoys swarming Fordow’s tunnel mouths. Analysts read the pictures as a frantic effort to shift centrifuges or shielding materials—clues that helped tip Washington’s calculus toward a lightning strike. What follows is an in‑depth reconstruction of those decisive days, the imagery behind the decision, and what experts say the post‑strike pictures reveal about Iran’s remaining nuclear potential.
1. Fordow in Focus: Why One Mountain Matters
Fordow—carved beneath roughly 90 metres of limestone outside Qom—houses Iran’s most advanced uranium‑enrichment cascades. Its geological armor means “only the heftiest U.S. ordnance can touch the main halls,” an Australian Broadcasting Corporation imagery brief noted, showing tunnel portals and blast traps in PlanetScope pictures from 20 June 2025 1 .
A brief history
- 2009: Site exposed by Western intelligence.
- 2013‑2015: Activity frozen under the JCPOA.
- 2019‑2024: Cascades restarted after the deal’s collapse.
- 2025: Enriching to 60 %—a stone’s throw from weapons‑grade—according to the IAEA’s June report to the U.N. Security Council 2 .
2. The Satellite Clues That Sparked Alarm
Commercial constellations—Planet Labs, Maxar and Airbus—imaged Fordow almost hourly in mid‑June:
| Date (2025) | Imagery highlight | Analyst interpretation |
|---|---|---|
| 19 June | New ventilation stacks on roof section C ts2.tech | Possible prepping for underground welding work. |
| 20 June | Convoy of five flat‑beds and two cranes at western tunnel portal aljazeera.com | Likely movement of centrifuge stands or shielding. |
| 21 June (dawn) | Bulldozer grading a berm near Portal 2; fresh spoil piles visible newsweek.com | Suspected creation of blast doors or debris trap. |
“These pictures shouted that Iran was either hardening Fordow or emptying it in anticipation of an attack; either way, time was running out,” argued Jeffrey Lewis of the Middlebury Institute after reviewing Planet imagery on 21 June 3 .
3. From Pixels to Policy: How Imagery Shaped the White House Decision
- Intelligence fusion: U.S. analysts matched truck counts and portal activity with SIGINT hints that critical equipment was being relocated.
- Policy window: President Trump’s advisers who once opposed a strike revised talking points to support a “quick bombing run,” The Guardian reported 4 .
- Green light: Hours later, Trump announced “a spectacular military success” after B‑2s and Tomahawks hit three sites, including Fordow 5 .
David Albright, ex‑U.N. inspector now at the Institute for Science and International Security, told Reuters that planners hoped to catch centrifuges “in mid‑move,” something only overhead imagery could confirm 6 .
4. What the Post‑Strike Pictures Show
- Fordow: Maxar photos from 22 June reveal collapsed power conduits and scorched portals but no proven breach of the deep halls 7 .
- Natanz & Isfahan: Above‑ground support buildings flattened, external power lines severed; imagery montage by Reuters graphics team illustrates craters and debris fields 8 .
- Damage debate: “There’s no evidence the underground site was destroyed,” Albright warned, pointing to intact ventilation shafts reuters.com. James Acton of Carnegie echoed that satellites “show limited off‑site contamination risk” because most uranium remained in chemical form 9 .
5. Inside the Imagery War Room: Tech That Made It Possible
| Capability | Provider | Role in Fordow intel cycle |
|---|---|---|
| 30 cm resolution stereo pairs | Maxar/WorldView‑3 | Measured portal rubble depth. |
| Rapid‑revisit wide‑area views | PlanetScope | Flagged vehicle surges leading to tasking of higher‑res assets. |
| Night‑time infrared | Airbus Pléiades Neo | Detected heat bloom from portable generators during equipment extraction. |
| SAR penetration imaging | Capella Space (U.S.) | Provided change‑detection overlays through smoke after the strike (not publicly released). |
Kelley, the imagery analyst featured in Bloomberg’s visual explainer, said the combination of optical and SAR meant “you could watch Fordow breathe” as trucks altered its thermal signature 10 .
6. Regional and Nuclear Implications
IAEA’s monitoring dilemma
IAEA chief Rafael Grossi told the Security Council that on‑site cameras were destroyed and inspectors blocked, leaving the agency reliant on the same commercial imagery “everyone can now buy” 2 .
Iranian reaction
Iran claims it pre‑emptively evacuated fissile material; state media called the strikes “ineffective” and pledged retaliation indiatoday.in. Al Jazeera live updates documented Iranian missile fire at Israeli cities within hours 11 .
Global risk calculus
The Guardian’s live blog noted European allies fear escalation but lack verification leverage without satellites and residual JCPOA constraints theguardian.com. The Wall Street Journal, drawing on Israeli defense briefings and commercial photos, warned that Iran still has “deep‑mountain capacity” untouched 12 .
7. Expert Voices on What Comes Next
- Jeffrey Lewis: “Commercial satellites have democratized verification—governments can’t hide bulldozers anymore, but they can still hide enrichment behind 90 meters of rock.” 3
- James Acton: “Strikes buy time, not disarmament. Iran could reconstitute in a decade if negotiations fail.” 13
- David Albright: “Without destroying tunnels, you only clip wings. Watch for rapid rebuild once smoke clears.” 6
- IAEA’s Grossi: “We are flying blind unless Iran restores inspection, but satellites will continue to whisper clues.” 2
8. Conclusion: The New Normal of Pixel‑Perfect Non‑Proliferation
Satellite imagery has leapt from adjunct to centerpiece in the global non‑proliferation toolbox. In the Fordow case it:
- Exposed suspicious activity ahead of time, shaping policy;
- Guided precision targeting moments before impact;
- Now underpins forensic assessment of what was—and wasn’t—destroyed.
As commercial constellations grow, hiding enrichment behind mountains will be harder; preventing proliferation, however, still demands diplomacy. Pixels alone cannot seal a centrifuge hall. They can, though, keep the world watching—and, perhaps, buy negotiators the daylight they need.
