

NEW YORK, August 7, 2026, 17:06 EDT
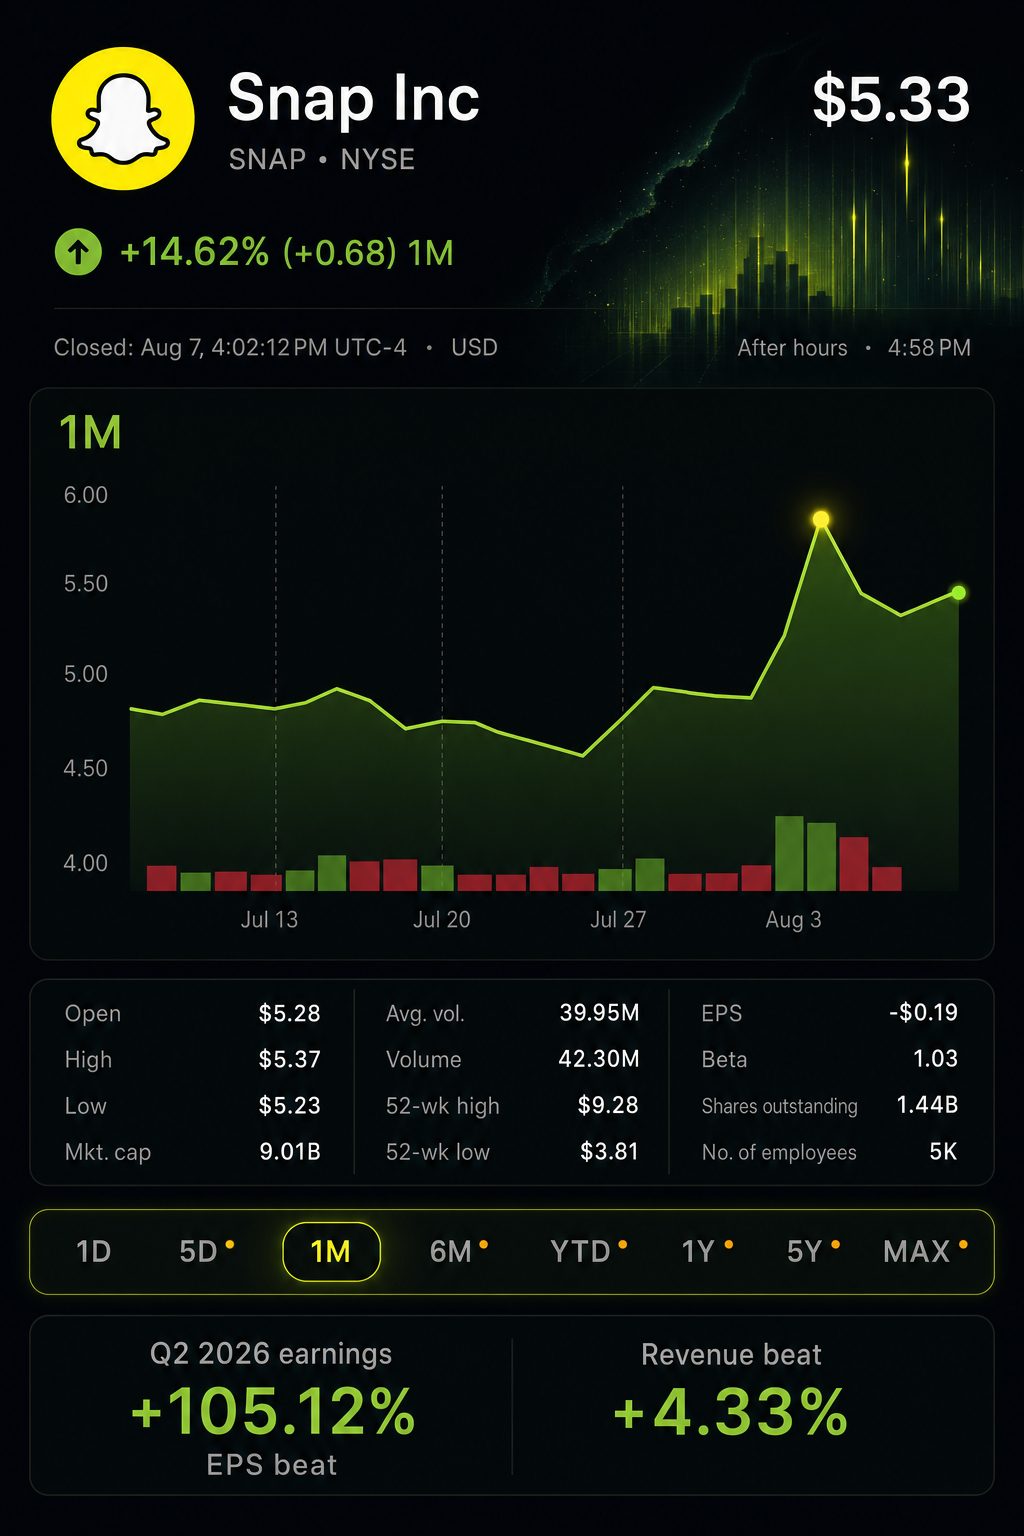
- U.S. cash trading was not open. Snap closed at $5.33, with after-hours trading around $5.32.
- An initial estimate using rounded figures indicates that other/direct revenue accounted for approximately 57% of sales growth in the second quarter.
- FactSet Research Systems NYSE:FDS received a Hold consensus, with an average price target of $7.44.
Snap’s own rounded figures indicate that direct revenue accounted for roughly 57% of its second-quarter sales increase. Shares finished the week 7.9% lower than Tuesday’s closing price.
The split is significant as direct revenue accounted for just 19.8% of sales in the quarter. This development provides Snap with an additional growth driver aside from advertising. However, investors are waiting for proof that the recent surge is sustainable.
Snap finished Friday’s session at $5.33, marking a 2.1% increase for the day. The stock rose 13.6% over the week. Its closing trend illustrates when momentum slowed; updates below reflect official closing prices.
| Session | Closing price | Daily change |
|---|---|---|
| Friday, July 31 | $4.69 | — |
| Monday, August 3 | $5.04 | up 7.5% |
| Tuesday, August 4 | $5.79 | up 14.9% |
| Wednesday, August 5 | $5.33 | down 7.9% |
| Thursday, August 6 | $5.22 | down 2.1% |
| Friday, August 7 | $5.33 | up 2.1% |
Other revenue climbed 85% to $316 million. Total revenue advanced by $254 million to $1.599 billion. The segment contribution figures below are based on Snap’s rounded reports.
| Q2 revenue stream | 2026 | 2025 estimate | YoY growth | Share of dollar growth |
|---|---|---|---|---|
| Advertising | $1.283 billion | $1.174 billion | 9% | Roughly 43% |
| Other/direct | $316 million | $171 million | 85% | Roughly 57% |
| Total | $1.599 billion | $1.345 billion | 19% | 100% |
Initial estimates based on rounded data released by the company. Segment totals may not add up exactly.
Fewer than 3% of Snap’s 971 million monthly active users purchase direct products. The company points to potential in premium offerings, AI creative tools and fresh subscription services as areas for growth. This represents the opportunity, but durability is still to be proven.
Advertising performance strengthened as well. Revenue climbed 9% to $1.28 billion, driven by increased World Cup-related spending and bigger clients in North America. Overall revenue surpassed the $1.54 billion LSEG LON:LSEG analyst consensus by roughly $59 million.
Chief Executive Evan Spiegel said the quarter served to “strengthen our core business and build a more durable financial foundation.” Net loss decreased to $164 million compared to $263 million. Free cash flow increased to $121 million from $24 million. Snap Inc. Investor Relations
User economics continue to be challenging. On rounded numbers, markets outside North America and Europe accounted for the entire net increase in daily users. North America and Europe posted declines.
| Region | Q2 daily users | DAU change* | Q2 revenue | Revenue change | ARPU |
|---|---|---|---|---|---|
| North America | 92 million | -6% | $943 million | +15% | $10.26 |
| Europe | 98 million | -2% | $354 million | +33% | $3.62 |
| Rest of world | 303 million | +12% | $302 million | +17% | $1.00 |
| Global | 493 million | +5% | $1.599 billion | +19% | $3.25 |
Regional DAU fluctuations are based on the company’s rounded numbers.
Markets outside North America and Europe gained approximately 32 million daily users, while North America and Europe together saw a drop of eight million users. Direct revenue enables monetization of this audience without relying on local ad rates to reach North American levels.
Other major social-media stocks advanced on Friday, with Snap outperforming the sector. The difference in equity value is still significant.
| Company | Friday close | Friday move | Market value |
|---|---|---|---|
| Snap Inc. NYSE:SNAP | $5.33 | up 2.1% | $8.87 billion |
| Meta Platforms NASDAQ:META | $592.10 | gained 0.3% | $1.52 trillion |
| Pinterest NYSE:PINS | $23.68 | rose 1.5% | $13.33 billion |
The widening scale gap puts greater focus on managing costs. Snap lifted its full-year infrastructure cost outlook to a range of $1.65 billion to $1.70 billion, raising both ends by $50 million after increased spending on AI and machine-learning. Third-quarter revenue guidance is set between $1.70 billion and $1.74 billion.
The midpoint of the revenue range is $1.72 billion, just topping LSEG’s $1.70 billion forecast. Adjusted EBITDA is projected between $300 million and $350 million, bracketing the consensus figure of $329.9 million.
Chief Financial Officer Doug Hott stated: “Going forward, our financial objective is Free Cash Flow per share.” Snap has reported positive free cash flow for the last eight consecutive quarters. The company continues to target full-year stock-based compensation close to $1.05 billion. Q4 Capital
Wall Street maintains a cautious stance. According to FactSet, there are 12 Buy ratings, 33 Holds, and three Sells. The consensus target suggests a 39.6% potential increase, with a median target of $6.88 indicating a 29.1% gain.
| Analyst recommendation | Current count | One month ago | Current share |
|---|---|---|---|
| Buy | 8 | 7 | 16.7% |
| Overweight | 4 | 4 | 8.3% |
| Hold | 33 | 34 | 68.8% |
| Underweight | 0 | 0 | 0.0% |
| Sell | 3 | 3 | 6.3% |
| Total | 48 | 48 | 100% |
Risks: The number of North American users is declining, expenses for AI are increasing, and the company still faces uncertain legal risks. Snap flagged that regulatory attention related to young users and ongoing U.S. court cases could require changes to products or drive costs up. The Specs launch set for September 16 introduces additional execution risk.
July consumer inflation data is due Wednesday, with producer prices expected Thursday and retail sales on Friday. According to early Reuters forecasts, headline inflation is estimated at 3.4% and core inflation at 2.5%. Stronger-than-anticipated figures may push yields higher and weigh on growth stocks.
Snap’s second quarter results indicated the company now has a secondary source of revenue. However, Friday’s closing price of $5.33 suggests shareholders are waiting for further proof.
Related articles: NYSE:SNAP