
NEW YORK, August 13, 2026, 17:16 EDT Amcor’s integration of Berry is delivering synergies 10% higher than projected, but the combined entity’s debt is testing a 5.5% yield.
- Adjusted earnings for the fiscal fourth quarter surpassed consensus estimates by 2.5%.
- Berry’s savings are approximately 10% higher than projected in the first-year plan.
- The approximately 5.5% yield is currently reliant on both cash conversion and reducing leverage.
Amcor plc NYSE:AMCR surpassed quarterly expectations as cost savings from Berry Global were realized ahead of schedule. The outcome provides investors with clearer proof that the major acquisition has the potential to boost earnings.
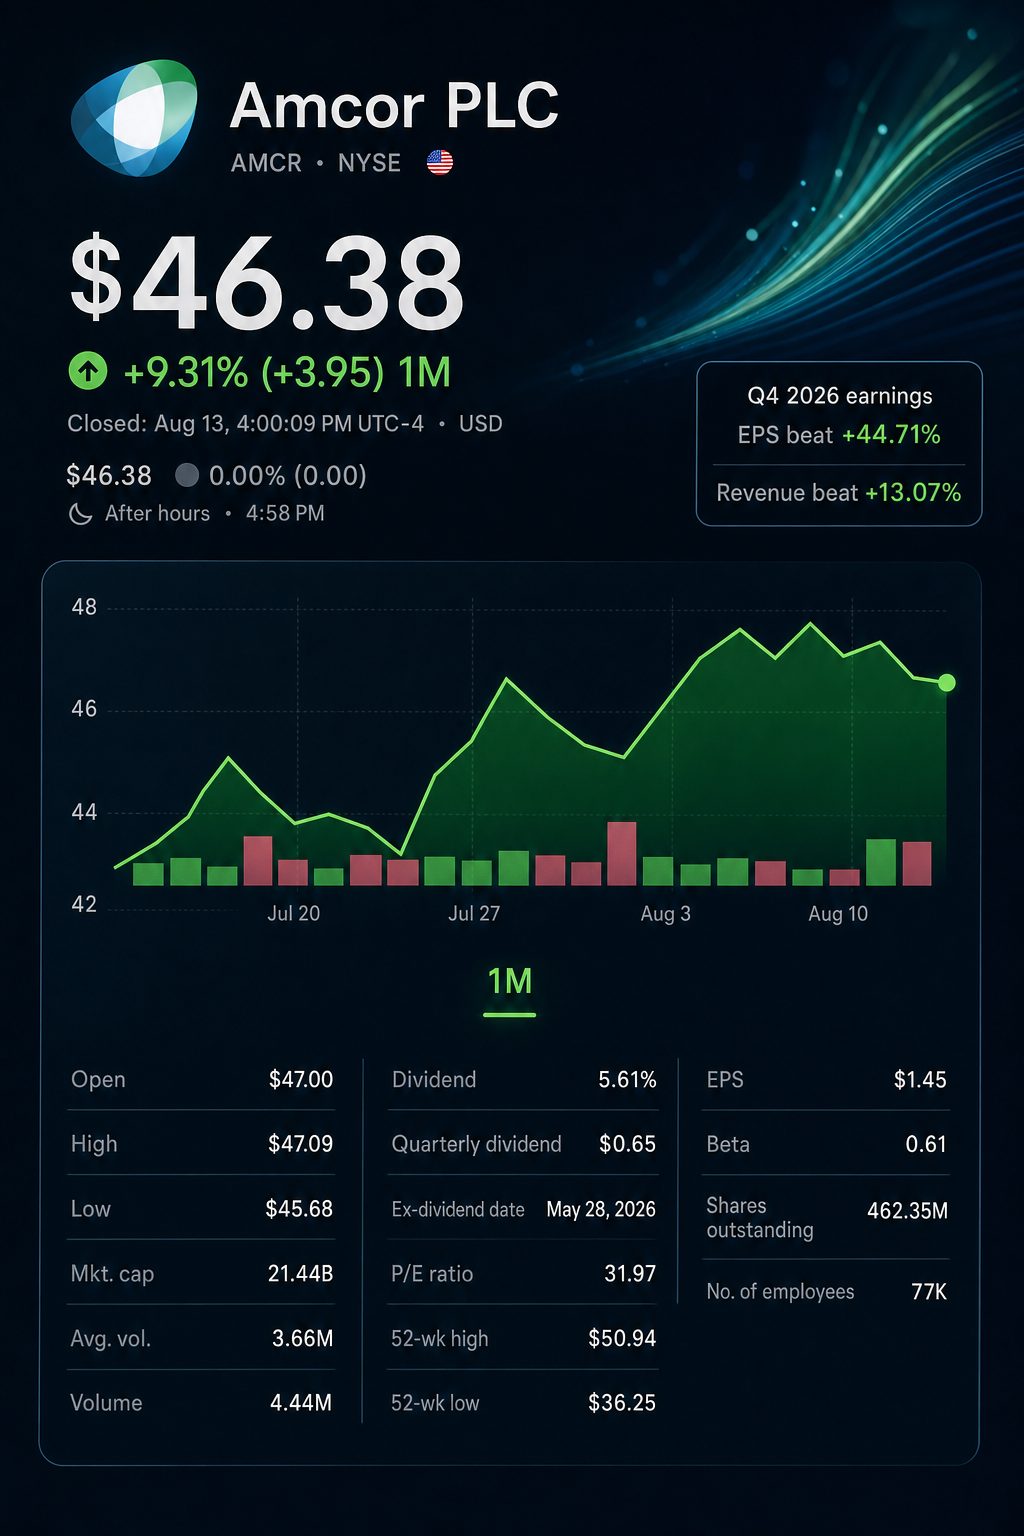
The tougher challenge now lies beneath the income statement. Amcor needs to convert those savings into cash and maintain a dividend with a yield around 5.5%.
Fourth-quarter adjusted earnings climbed 23% to $1.23 per share, while revenue grew 26% to $6.4 billion. Both figures surpassed Wall Street expectations, results released Wednesday showed.
| Fiscal Q4 measure | Reported | Consensus | Beat | Year-on-year |
|---|---|---|---|---|
| Adjusted EPS | $1.23 | $1.20 | 2.5% | up 23% |
| Revenue | $6.40 billion | $6.01 billion | 6.5% | up 26% |
The acquisition is starting to reveal that benefit. Amcor reported that first-year savings are tracking about 10% above its $260 million forecast.
The speed is more important than reported sales growth. Berry scaled up mechanically, with cost reductions able to boost margins and support debt reduction efforts.
Amcor acquired Berry through an all-stock deal valued at $8.4 billion. Upon completion, the company set a goal of achieving $650 million in yearly pre-tax synergies by fiscal 2028. Management further forecast annual cash flow to exceed $3 billion once at full run rate.
| Integration and balance-sheet measure | Earlier benchmark | Latest verified measure | Change or gap |
|---|---|---|---|
| FY2026 pre-tax synergies | $260 million plan | Roughly 10% above plan | Strong implementation |
| FY2028 synergy target | $650 million | $260 million as first-year base | Initial year delivers 40% of target |
| Net debt | $13.271 billion at June 2025 | $14.266 billion as of March 2026 | Increase of $995 million |
| FY2026 free-cash-flow guide | $1.8-$1.9 billion | $1.5-$1.6 billion at Q3 | Midpoint lowered by 16.2% |
| Leverage | 2.5-3.0 times target range | Roughly 3.8 times as of March | Over target |
The balance sheet continues to act as a limiting factor. As of March 31, net debt totaled $14.266 billion. Leverage was close to 3.8 times trailing EBITDA, in part due to seasonal working capital.
In May, free-cash-flow guidance was reduced to $1.5 billion-$1.6 billion. Management cited increased inventory for the revision and reaffirmed its focus on maintaining investment-grade status. This results in a narrower margin for operational missteps.
Chief Executive Peter Konieczny stated in May that the first anniversary of the deal demonstrated “the resilience of our business.” The recent earnings beat backs up that assertion, though the process of reducing debt is still ongoing. Amcor
Analyst sentiment has become more favorable, though not entirely positive. UBS Group SWX:UBSG started coverage with a Buy rating, anticipating 9% EPS growth per year over the next three years. Overall consensus continues to include six Hold ratings.
| Recommendation | Analysts | Share of 14 |
|---|---|---|
| Strong Buy | 1 | 7% |
| Buy | 7 | 50% |
| Hold | 6 | 43% |
| Sell | 0 | 0% |
| Consensus target | $48.08 | Range: $43-$54 |
The stock had climbed nearly 18% in the three months leading up to the report. Shares dipped around 2% early Wednesday following the earnings beat. The move indicates that investors had largely anticipated the integration progress.
The key point for investors is straightforward. When synergy gains are realized as cash, both dividend payments and debt cuts can be achieved together. Should cash conversion fall behind once more, the yield might indicate pressure on the balance sheet instead.
Risks: Lower consumer demand, rising raw material costs, and sluggish inventory adjustments may impact volumes. Errors during integration or a further increase in working capital could slow deleveraging and strain dividend coverage.
Related articles: Stock Market