
TAIPEI, August 20, 2026, 19:45 CST
- Samsung’s 10% to 15% hikes in foundry prices highlight constrained industry capacity.
- TSMC accounts for over 70% of foundry revenue, with July sales increasing by 44.7%.
- Third-quarter growth remains robust, yet the gross-margin outlook continues to indicate a decline.
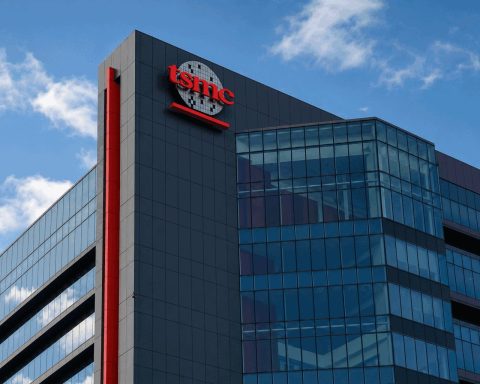
Samsung Electronics Co. KRX:005930 has increased certain foundry prices by up to 15%, highlighting how tight advanced-chip supply continues to bolster pricing in the industry. Taiwan Semiconductor Manufacturing Co. (TPE:2330; NYSE:TSM) remains dominant, accounting for over 70% of worldwide foundry revenue.
This development carries greater significance for TSMC than Samsung’s 7% share might indicate. Clients are paying premium prices to the smaller competitor as TSMC continues to face capacity shortages. Limited supply is allowing for stronger pricing power.
The key consideration for investors is if TSMC can turn limited supply into bigger profit margins. The chipmaker projects third-quarter revenue between $44.6 billion and $45.8 billion. Its gross margin outlook is 65%–67%, lower than the 67.7% achieved in the second quarter.
| Foundry signal | TSMC | Samsung foundry | Investor reading |
|---|---|---|---|
| Global revenue share | Over 70% | Roughly 7% | TSMC still sets the price benchmark |
| Reported price action | No recent figure released | Increase of 10%–15% for certain nodes | Limited capacity benefits the industry |
| August 20 share move | +1.06% | +8.48% | Samsung secures stronger leverage |
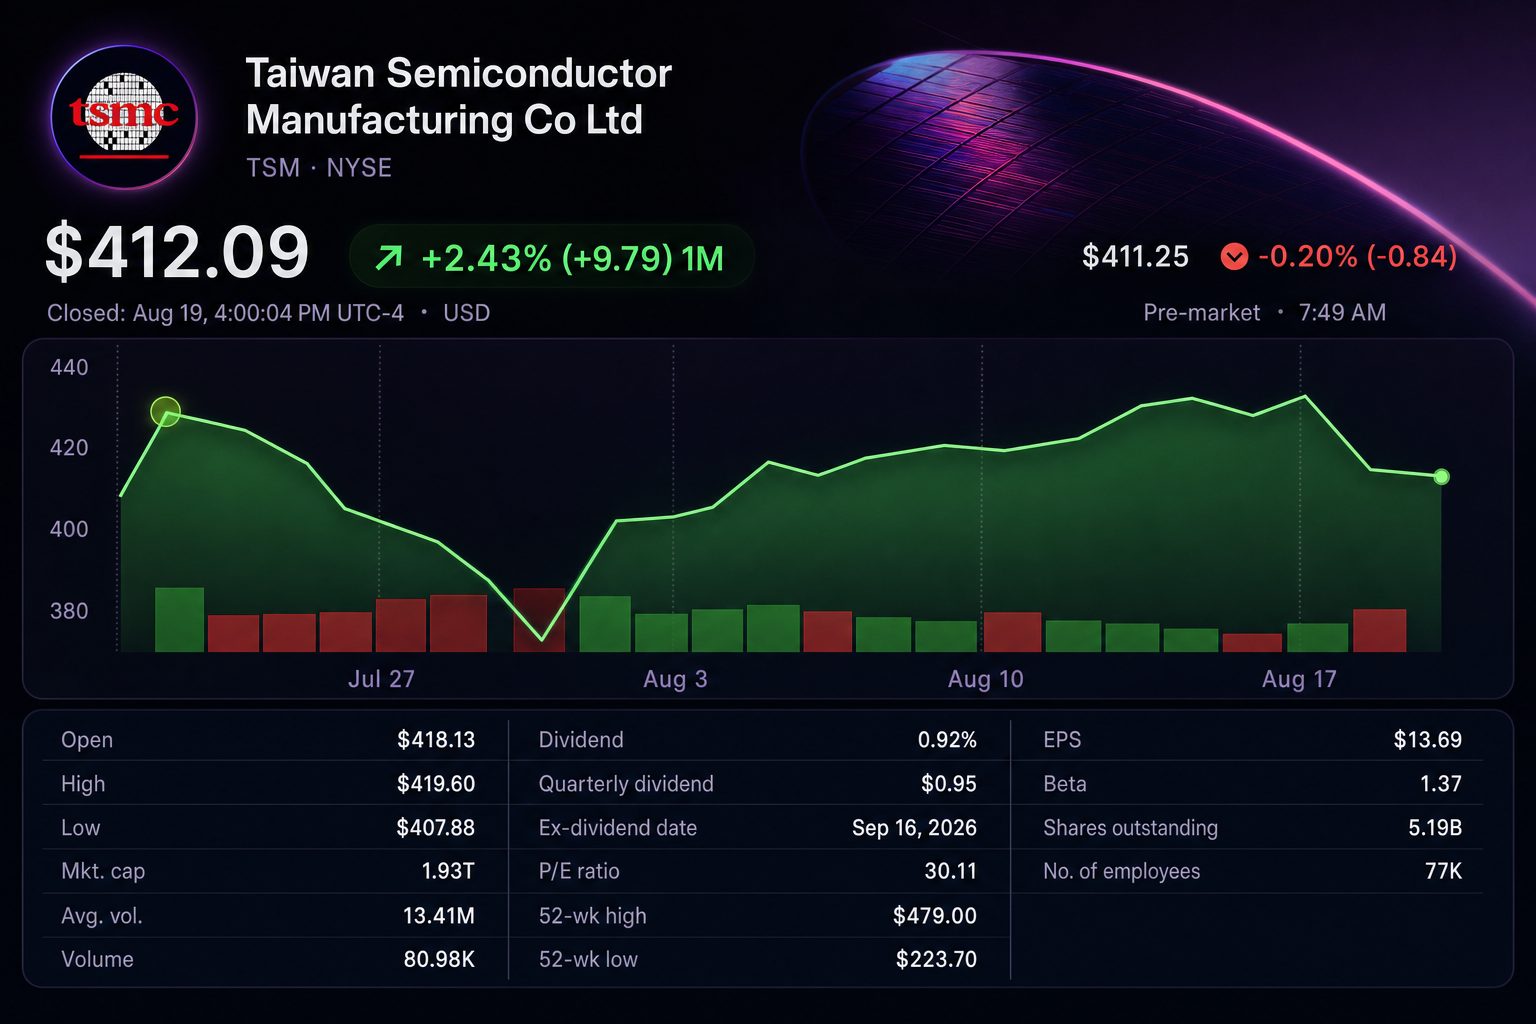
TSMC shares ended up 1.06% at NT$2,375 in Taipei. The local exchange was shut at the time of publication. The company was valued at approximately $1.93 trillion, making it the largest non-U.S. firm on TradingView’s platform.
Strong sales boost the scarcity argument. Early figures for July show revenue at NT$467.58 billion, an increase of 5.6% compared with June and 44.7% higher than the same month a year ago. Revenue for the first seven months climbed 37% to reach NT$2.87 trillion.
| 2026 monthly revenue | NT$ billion | Year-on-year growth | Sequential growth |
|---|---|---|---|
| April | 410.73 | 17.5% | −1.1% |
| May | 416.98 | 30.1% | +1.5% |
| June | 442.68 | 67.9% | +6.2% |
| July, preliminary | 467.58 | 44.7% | +5.6% |
TSMC’s revenue growth in July surpassed its projection of just over 40% growth in U.S. dollar terms for the year. The monthly data does not detail sales by product category. Attributing the entire gain to artificial intelligence alone would exaggerate what has been disclosed.
Nonetheless, high-performance computing accounted for 66% of revenue in the second quarter. Chairman and Chief Executive C.C. Wei stated that AI-related demand was “extremely robust.” This year’s capital expenditure is planned between $60 billion and $64 billion. TSMC July sales coverage
| Operating benchmark | Q2 2026 actual | Q3 2026 guidance | Sequential implication |
|---|---|---|---|
| Revenue | $40.20 billion | $44.6–$45.8 billion | Increase of 10.9% to 13.9% |
| Gross margin | 67.7% | 65.0%–67.0% | Decline of 0.7–2.7 percentage points |
| Operating margin | 60.3% | 56.0%–58.0% | Falls by 2.3–4.3 percentage points |
The disparity in margins is significant. Overseas growth, such as the intended $265 billion investment in Arizona, involves increased upfront costs. Profitable pricing at fully operational sites needs to offset those expenses as well as the costs associated with launching new technologies.
| Analyst recommendations | Buy / strong buy | Hold | Sell | Average target |
|---|---|---|---|---|
| Taiwan-listed shares | 34 | 1 | 0 | NT$3,141.60 |
| NYSE ADRs | 18 | 1 | 0 | $540.20 |
The target for Taiwan suggests a potential upside of roughly 32% compared to Thursday’s closing price. While the outlook is generally positive, it is not universal. Forecasts for the target range from NT$2,147 up to NT$4,200, highlighting questions over the length of the cycle and the company’s performance.
The July sales report from last week bolstered optimism among bulls. Looking to the coming week, Nvidia Corp. NASDAQ:NVDA is set to release results that will gauge demand for AI infrastructure. At TSMC, stakeholders are expected to focus on client spending patterns and shipment schedules rather than overall semiconductor order figures.
Risks: Capacity could rapidly become less tight if export controls, reliance on a small group of customers, power limitations, or reduced AI spending occur. Increased international expenses may also limit margins from reaching current forecasts.
Samsung’s price increase reflects the external view of TSMC’s bottleneck premium. The next milestone is distinct. Revenue needs to keep growing, and margins should remain close to the upper end of forecasts.
Related articles: NYSE:TSM