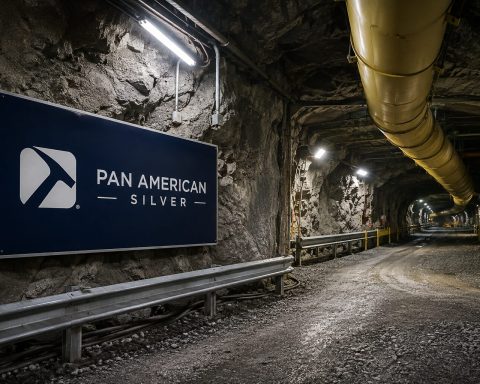

NEW YORK, August 21, 2026, 06:08 EDT — The most recent jump in silver prices has pushed Pan American Silver Corp.’s NYSE:PAAS TSX:PAAS indicative price-cost spread to more than $51 per ounce.
- On Friday, spot silver hit $68.92, following a 3.49% increase on Comex from the previous day.
- Pan American reported a second-quarter Silver Segment AISC of $17.80 per ounce.
- On Thursday, the stock closed just $0.10 higher than the firm’s average buyback price for the second quarter.
The math is straightforward. The spot price on Friday was $68.92, with a quarterly all-in sustaining cost of $17.80, resulting in $51.12. This figure is not an accounting profit, but represents a practical indication of operating leverage before accounting for corporate expenses, tax, royalties, and sales schedules.
| Silver measure | Latest reading | Investor signal |
|---|---|---|
| Spot silver, Aug. 21 | $68.92/oz | Rose 2.6% on Friday |
| Comex settlement, Aug. 20 | $68.026/oz | Advanced 3.49% Thursday |
| Two-session Comex move | +6.39% | Biggest two-day advance since early August |
| Distance from January record | -40.89% | Significant upside swings still offset by risk of declines |
The development is significant as Pan American forecasts attributable silver output of 25 million–27 million ounces for the year. Each $1 change in the realized silver price equates to about $25 million–$27 million in annual revenue sensitivity, prior to any adjustments. The firm is additionally engaged in gold and base metals production.
| Pan American silver metric | Reported or calculated value | Context |
|---|---|---|
| Q2 attributable output | 6.47 million oz | Near upper edge of projected range for the quarter |
| Q2 Silver Segment AISC | $17.80/oz | Non-GAAP; after by-product credits |
| Friday spot minus Q2 AISC | $51.12/oz | Represents spread, distinct from profit |
| 2026 silver forecast | 25 million–27 million oz | Guidance reaffirmed Aug. 12 |
| Example full-year spread range | $1.28 billion–$1.38 billion | $51.12 multiplied by forecast; prior to corporate deductions, tax, and scheduling |
Chief Executive Michael Steinmann stated: “We produced 6.5 million ounces of silver, at the upper end of our quarterly guidance.” Attributable free cash flow totaled $344 million. Revenue came in at $1.124 billion. Issuer release and executive quote
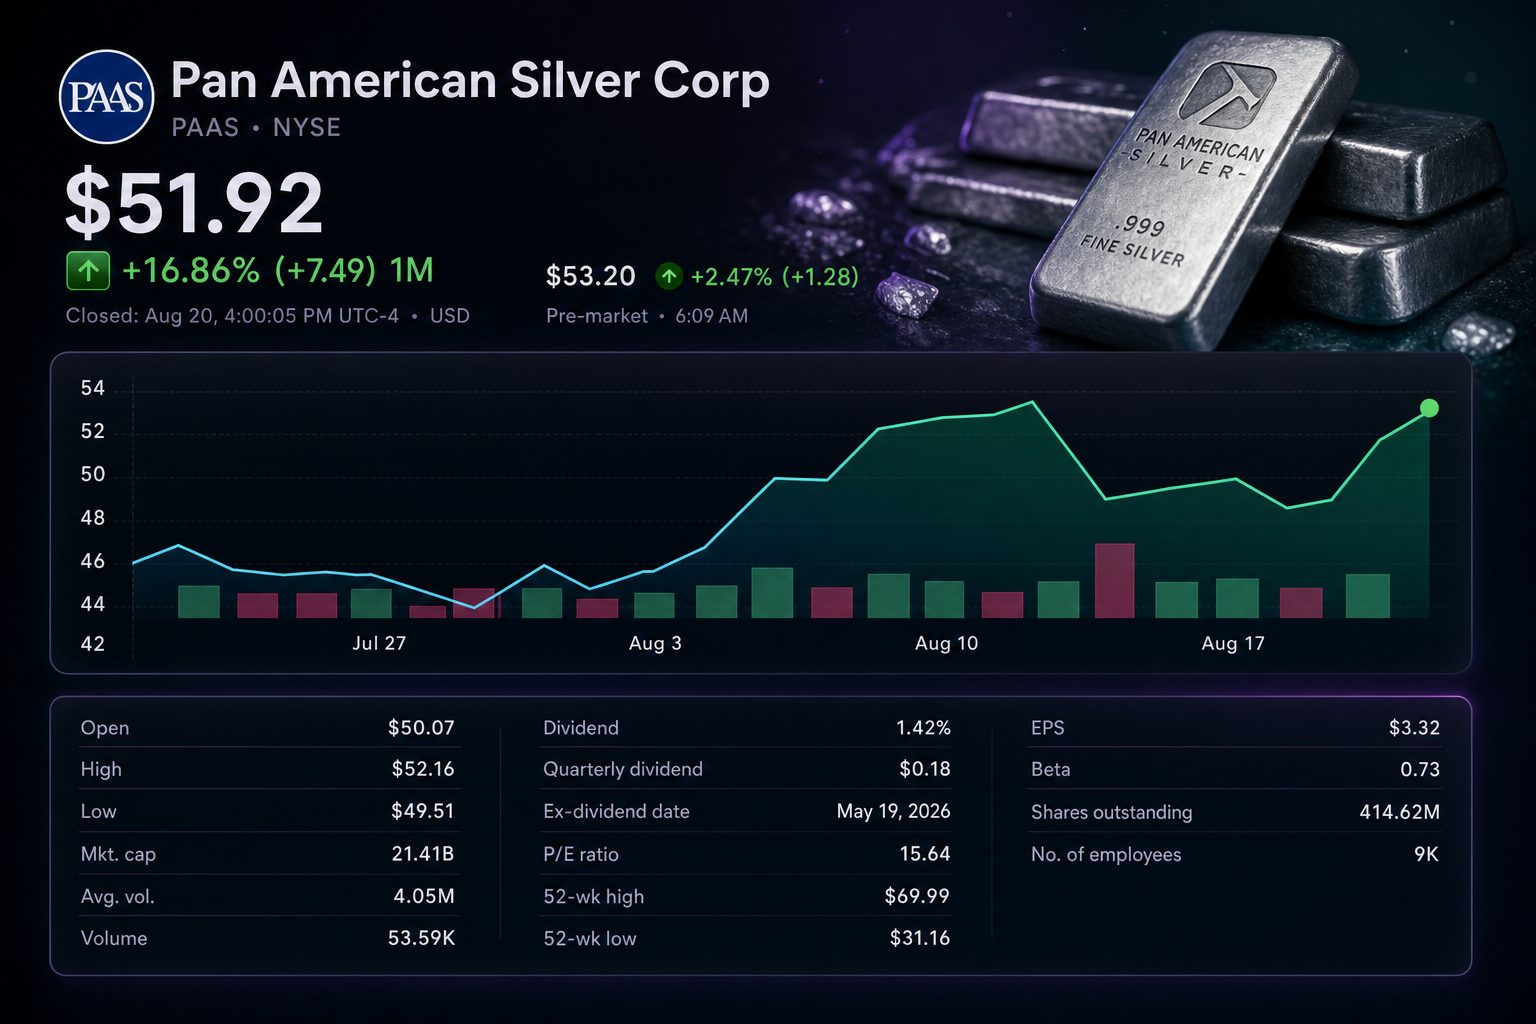
The stock’s trajectory has not been linear. Pan American finished Thursday at $51.56, marking a 2.5% rise since Wednesday. After-hours trading saw it decline 1.38% to $50.85.
| Listed silver exposure | Market or issuer reading | Date and time basis |
|---|---|---|
| Pan American Silver NYSE:PAAS | Closed at $51.56; $50.85 after-hours | Aug. 20, 16:00 and 20:00 EDT |
| Pan American weekly move | Up 8.7% | Increase from Aug. 14 close of $47.42 to Aug. 20 close |
| iShares Silver Trust NYSEARCA:SLV | NAV at $60.31; one day up 5.35% | Aug. 20 |
| SLV bullion holdings | 491.12 million oz | Aug. 20 |
| SLV net assets | $32.77 billion | Aug. 20 |
The closing price ended just $0.10 higher than Pan American’s average repurchase cost of $51.46 in the second quarter. The company acquired 4.4 million shares for roughly $224 million. That near match provides investors with a clear benchmark.
| Analyst / firm | Recommendation | Target | Date |
|---|---|---|---|
| Cosmos Chiu — CIBC TSX:CM | Buy, rating affirmed | C$130.44 | Aug. 13 |
| Matt Murphy — BMO Capital TSX:BMO | Hold, rating restated | C$75.00 | Aug. 13 |
| Lawson Winder — BofA Securities NYSE:BAC | Buy, rating unchanged | C$95.75 | Aug. 13 |
| Josh Wolfson — RBC Capital TSX:RY | Buy, rating affirmed | C$90.20 | Aug. 10 |
| Ovais Habib — Scotiabank TSX:BNS | Buy, rating maintained | C$95.00 | July 14 |
| Nine-analyst consensus | Buy | C$92.00 average | Latest compiled view |
Silver climbed as the dollar weakened and worries resurfaced over U.S. debt levels. Treasury’s expanded buybacks of long-term bonds first drove yields down. But the 30-year yield soon rebounded to approach 5.25%, highlighting how fast that backing can disappear.
This week will deliver a more significant macroeconomic challenge. The second estimate of U.S. second-quarter GDP and July figures for personal income and spending are scheduled for release on August 26 at 08:30 EDT. Unexpected inflation readings may trigger simultaneous moves in the dollar, yields and silver.
Risks: Although silver has bounced back, it is still 40.89% under the January peak. Any increase in real yields, a firmer dollar or reduced geopolitical tensions could unwind the gains. Pan American is additionally exposed to risks related to mine operations, labour, weather, taxes and royalties.
Currently, the crucial figure is $51.12. Should silver stay close to $69, Pan American’s operating leverage continues to stand out. Miners’ ability to retain this advantage will be tested at Friday’s U.S. equity open.