
Chip Selloff Softened for SMH on Heavyweight Exposure, but ETF Still Trails by 19 Points YTD

Chip Selloff Softened for SMH on Heavyweight Exposure, but ETF Still Trails by 19 Points YTD

NEW YORK, July 28, 2026, 14:00 EDT — U.S. markets open

  • At 1:44 p.m. EDT, SMH dropped 3.5% and SOXX declined 4.8%.
  • Issuer data through Monday indicated SMH had risen 52.2% so far this year, while SOXX was up 71.5%.

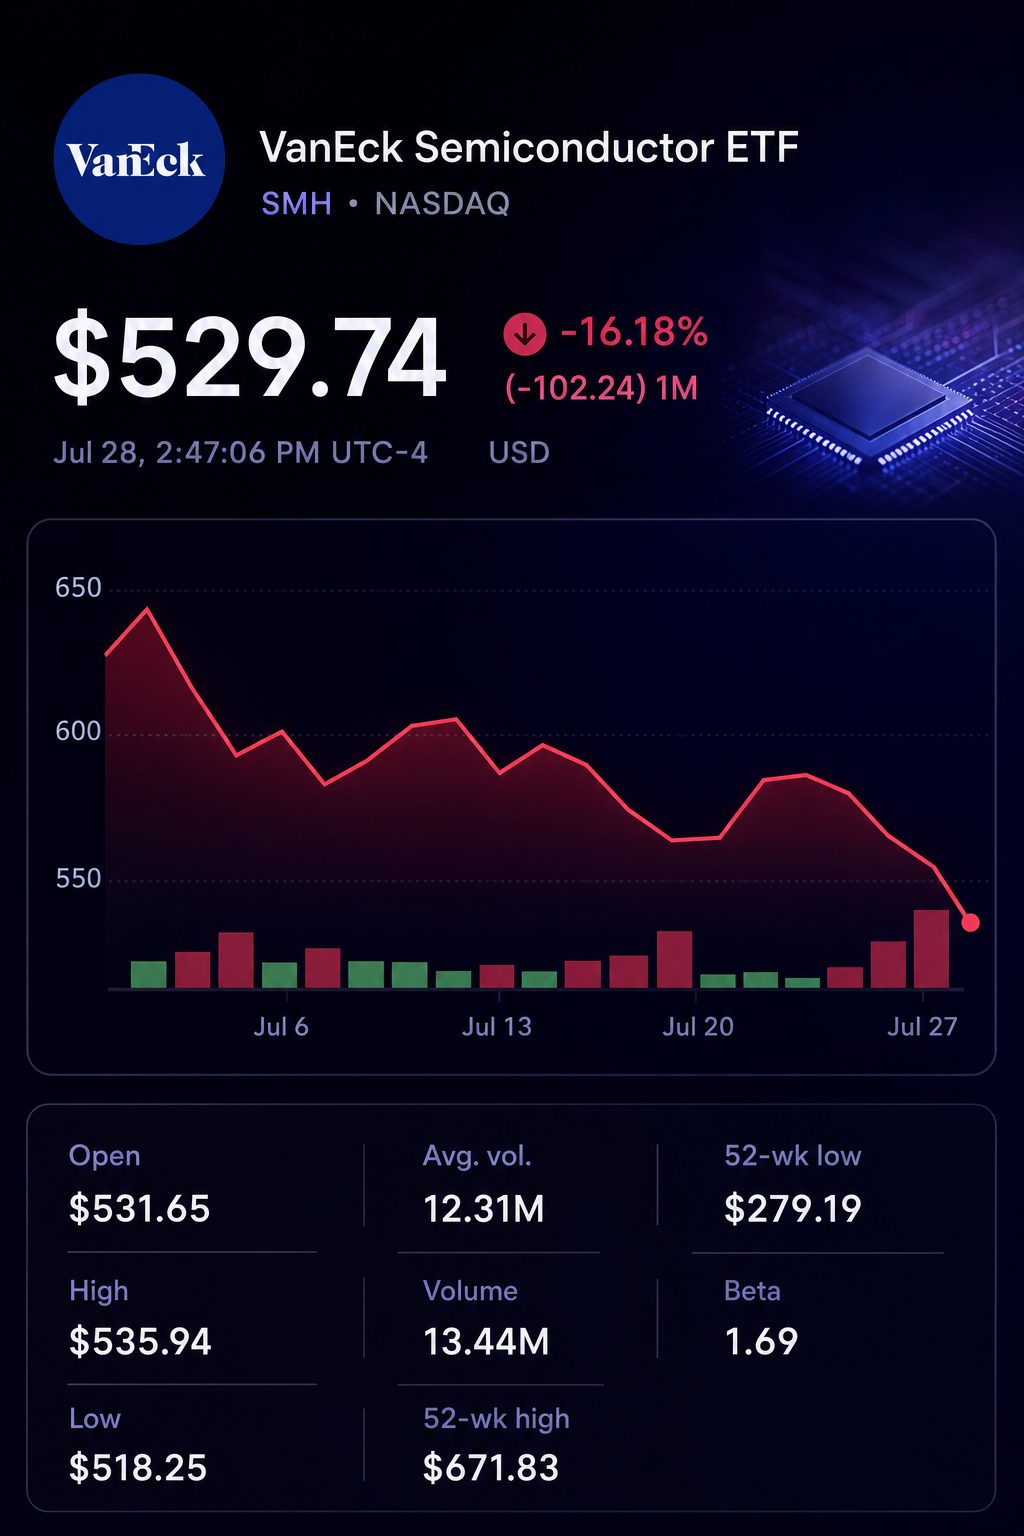
The VanEck Semiconductor ETF declined to $529.23 on Tuesday. However, its concentrated holdings helped cushion the wider downturn in chip stocks. The iShares Semiconductor ETF slid an additional 1.26 percentage points.
The difference is important as the return ranking for 2026 reverses direction. SMH lagged behind SOXX by 19.3 percentage points as of Monday.

Stock chart for NASDAQ:SMH

Investors are deciding which segment of the cycle should be at the forefront, rather than selecting between similar groups of chips.

MeasureSMHSOXX
Intraday percentage change-3.5%-4.8%
Issuer-stated year-to-date performance through July 27+52.2%+71.5%
Nvidia portfolio share20.62%8.56%
Advanced Micro Devices portfolio share5.75%8.84%
Micron Technology portfolio share5.31%8.29%
Total securities in fund2630
Annual expense fee0.35%0.34%

Live updates were logged at about 1:44 p.m. EDT. SMH positions reflected data from July 27, while SOXX positions reflected July 24.

Nvidia gained 0.4%, offering one of the few areas of support. Shares of AMD declined 7.4%, with Micron losing 9.5%. Applied Materials was down 8.4%.

A preliminary estimate of contributions shows the impact of the construction. Differences in the weights of Nvidia, AMD, and Micron accounted for around 0.56 percentage point of SMH’s relative outperformance, making up nearly half of Tuesday’s gap.

The method applies portfolio weights from the previous close alongside real-time share price changes. It does not factor in trading expenses or shifts in weights during the trading session.

Previous advances had extended past Nvidia, according to analysis distributed by Yahoo. The documented returns indicate SOXX reflected a greater share of that expansion.

SMH’s guidelines allow for high concentration. MarketVector imposes a 20% cap on major holdings at each rebalance. Between those quarterly adjustments, weights may fluctuate. As of Monday, Nvidia’s weighting was 20.62%.

The fund’s largest five holdings made up 47.4% of total assets, with its top 10 holdings comprising 71% precisely.

The decline also brought SMH down to a key technical level, hitting $518.40 and moving into the $510-$520 support zone noted by Seeking Alpha. The ETF then rebounded to trade above $529.

The ETF stayed roughly 21% under its 52-week peak of $671.83, further extending the pullback noted in the Trefis analysis on Monday.

History provides evidence, though not reassurance. According to Trefis, SMH has fallen by 10% or more on 15 occasions since 2005. Thirteen of those instances were followed by gains within the next year. The median return posted was 21%.

Purchasers continued to face a median further drop of 12%. In these periods, the median peak advance was 32%.

Global chip markets continued their decline on Tuesday. Concerns surfaced among investors regarding Chinese rivals and the funding of artificial-intelligence expansion. South Korea’s Kospi slipped 10.8%.

Dorian Carrell, head of multi-asset income at Schroders , said: “It’s healthy that the market’s questioning these things.” Reuters

Risks persist in both directions. A decisive fall beneath $510 may intensify the downward move. Losses in Nvidia could eliminate support for SMH, while a recovery in memory may shift momentum back towards SOXX.

The range of investor options is more limited than the fund titles imply. SMH provides greater weight to a single main leader, while SOXX distributes more investment among the other parts of the cycle.

What is SMH’s performance today, and what is the magnitude of the move?

SMH last traded at $530.12, a decrease of $18.43, or 3.36%. The price moved between $518.40 and $539.00, with 12.66 million shares exchanged. SOXX dropped 4.75%, while QQQ slipped 0.80%, suggesting that pressure was concentrated in semiconductors rather than affecting the entire technology sector. The intraday readings were as of 1:43 p.m. Eastern.

What is causing SMH to decline even though Nvidia remains stable?

Selling pressure was widespread among memory, chip equipment, and several AI-related stocks. AMD dropped 7.42%, Micron declined 9.46%, Lam Research slipped 7.78%, and Arm fell 8.16%. While Nvidia rose 0.49%, this gain did not counterbalance losses in the sector. Reuters attributed the global selloff to concerns over valuations, AI funding, and competition from China. The exact combination of factors is still unclear. Multiple forces often drive market movement. Reuters

To what extent does SMH focus on its biggest holdings?

On July 27, SMH managed 26 holdings, including cash. Nvidia made up 20.62% of the portfolio, with TSMC accounting for 9.31%. Broadcom, AMD, and Micron contributed a further 17.46%. In total, the top five holdings comprised approximately 47.39% of total assets. The ten largest positions represented around 71.0%. While the fund shows some diversification, significant concentration risk persists. ETF & UCITS Fund Manager | VanEck

Does SMH remain firmly bullish for 2026 following today’s decline?

VanEck stated its year-to-date return was 52.22% as of July 27, with that performance measured before Tuesday’s intraday drop. On July 27, NAV was $548.18 and assets totaled $63.61 billion. A single-day decline of 3.36% would reduce the gain but not eliminate it. The full updated return awaits Tuesday’s closing NAV. ETF & UCITS Fund Manager | VanEck

What are the key earnings reports to watch in the coming week?

Qualcomm, Lam Research, and Arm are set to announce results following the close on July 29, with their combined weight in SMH at approximately 9.47%. AMD will post earnings after the close on August 4, pushing the projected earnings exposure to about 15.22%. Statements on AI demand, equipment budgets, and handset chip trends could influence SMH. These dates are confirmed, yet companies may alter their reporting times. Qualcomm Investor Relations

To what extent could actions by the Federal Reserve influence SMH over the week?

The FOMC is convening July 28–29, concluding on Wednesday. Reuters reported that the probability of a rate hike was priced at just about one in three by markets. MarketVector reported SMH’s key index trades at 48.64 times trailing earnings, excluding companies reporting losses. An unexpected rate rise may reduce that valuation and weigh on semiconductor stocks. However, even a pause could underwhelm if policymakers adopt a more hawkish tone than anticipated. This event is expected to drive significant volatility. Federal Reserve

Does SMH still appear costly following the recent decline?

MarketVector reported its trailing P/E at 48.64, excluding companies with losses. When including firms with negative earnings, the P/E rose to 51.90. The price-to-book ratio was 13.38, and the dividend yield was 0.43%. VanEck imposes a 0.35% annual expense ratio. Justification for that valuation hinges on future earnings growth, which remains unclear. MarketVector Indexes

Which price points are important for investors to monitor heading into next week?

SMH hit an intraday low of $518.40 and a high of $539.00 on Tuesday. The previous session closed at $548.55, serving as a rebound reference point. By the latest trade, SMH had climbed roughly 2.26% from the day’s low, but that gain was limited compared to a 3.36% drop for the session. A decline under $518.40 would indicate new downside. These figures are reference points and do not guarantee support or resistance levels.

Michał Rogucki is a senior markets reporter at TS2.tech, specializing in stocks, technology and macroeconomic developments. A graduate of Humboldt University of Berlin, he previously worked in investment research and market analysis before transitioning to financial journalism. He covers the trends and events that matter most to investors worldwide.

Google Preferred Source

TS2 Tech on Google
Follow TS2 Tech

Choose TS2 Tech as a preferred source or open our publication in Google News.

Stock Market Today

  • Desjardins Lifts TFI International (TSE:TFII) Price Target to C$245.00
    July 28, 2026, 3:49 PM EDT. Desjardins has raised its price target on TFI International to C$245.00 from C$221.00 while maintaining a "buy" rating, suggesting a 15.35% potential gain. Other brokerages posted varied targets: National Bank Financial reduced its estimate to C$160.00, Citigroup increased to C$144.00, and Scotiabank upgraded to "sector outperform" with a C$260.00 target. Shares of TFII recently traded at C$212.40, valuing the company at C$17.46B, with a price-to-earnings ratio of 59.16 and earnings per share of C$2.63 on C$3.25B in revenue.
Dell (NYSE:DELL) stock slides as AI-server customer concentration comes into focus
Previous Story

Dell (NYSE:DELL) stock slides as AI-server customer concentration comes into focus

JetBlue (NASDAQ:JBLU) Shares Rise as 2028 Profit Goal Hinges on Lower Fuel Costs
Next Story

JetBlue (NASDAQ:JBLU) Shares Rise as 2028 Profit Goal Hinges on Lower Fuel Costs