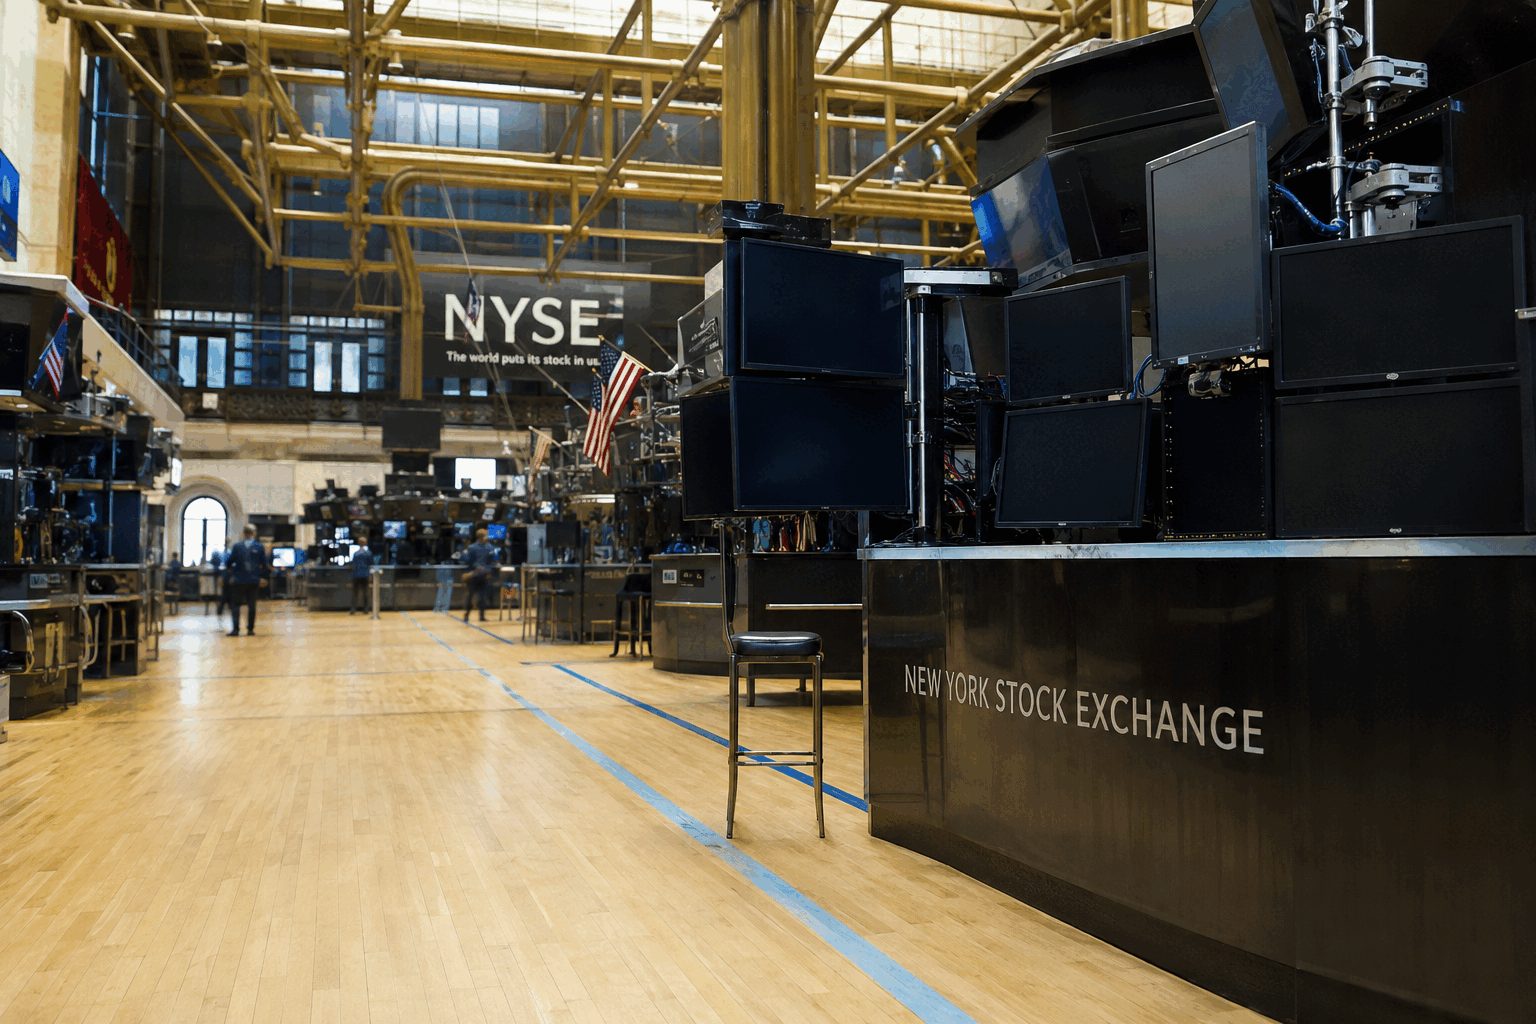

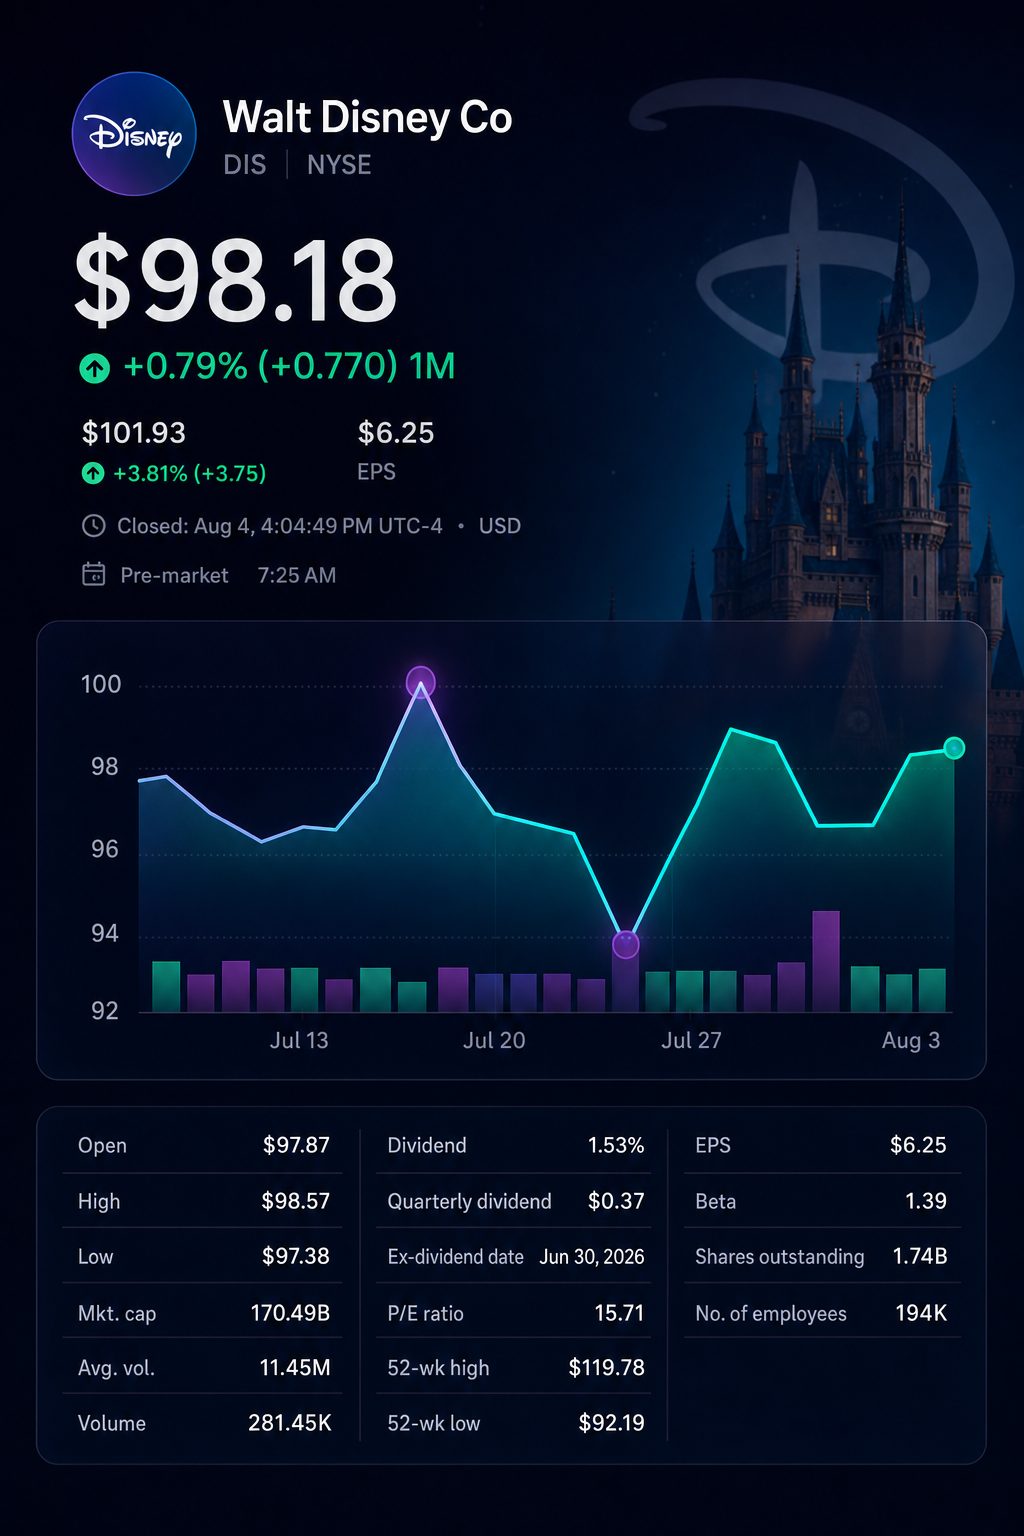
NEW YORK, August 5, 2026, 07:17 EDT — U.S. stocks saw pre-market activity ahead of the New York Stock Exchange’s 09:30 core open.
- Adjusted earnings per share surpassed consensus estimates by 10.8%, while revenue came in roughly 0.6% below expectations.
- Domestic Parks & Experiences along with SVOD contributed $821 million, accounting for 84% of the growth in segment profit.
- At 07:13 EDT, shares were seen up 3.3%. The premarket jump was initial and delayed.
Walt Disney Co. NYSE:DIS saw its stock climb as adjusted earnings surpassed analyst expectations. Revenue missed estimates by a small margin, putting focus on the stronger profit mix.
Disney saw $821 million of its $980 million segment operating income rise come from Domestic Parks & Experiences and subscription video, accounting for 83.8% according to the company’s reported divisional data. This growth offset softness in both Sports and international parks.
Results snapshot
| Metric | Q3 fiscal 2026 | Comparator | Result |
|---|---|---|---|
| Revenue | $25.248 billion | $25.4 billion LSEG estimate | 0.6% short |
| Adjusted EPS | $2.06 | $1.86 LSEG estimate | 10.8% higher |
| GAAP diluted EPS | $1.51 | $2.92 year earlier | Decreased 48% |
| Total segment operating income | $5.555 billion | $4.575 billion year earlier | Increased 21% |
| Free cash flow | $3.072 billion | $1.889 billion year earlier | Higher by 63% |
Comparisons to consensus are shown as result percentages. Disney identifies adjusted EPS, total segment operating income, and free cash flow as non-GAAP metrics.
The quarter demonstrated significant operating leverage throughout the reported divisions. Revenue gained 7% and segment operating income jumped 21%. Free cash flow surged 63%.
Comparison of segments
| Segment | Revenue | Revenue growth | Operating income | OI growth | OI margin | Margin change |
|---|---|---|---|---|---|---|
| Entertainment | $11.345 billion | 6% | $1.680 billion | 64% | 14.8% | up 5.3 points |
| Sports | $4.500 billion | 4% | $858 million | -17% | 19.1% | down 5.0 points |
| Experiences | $9.968 billion | 10% | $3.017 billion | 20% | 30.3% | up 2.6 points |
Disney’s published results were used to determine margins and any adjustments to them.
Attendance at domestic parks climbed by 3%, while per-guest spending saw a 4% rise. The introduction of two additional cruise ships boosted stateroom capacity by approximately 50%. International visitor numbers at U.S. parks continued to weigh on results but showed some improvement.
Experiences was also granted a $100 million tariff refund, which Disney reported contributed roughly four percentage points to operating income growth for the segment.
Disney and Universal theme parks
| Business | Revenue | Revenue growth | Profit measure | Profit growth | Current margin | Margin change |
|---|---|---|---|---|---|---|
| Disney Domestic Parks & Experiences | $7.116 billion | 11% | $2.088 billion OI | 27% | 29.3% | up 3.6 points |
| Comcast NASDAQ:CMCSA Theme Parks | $2.413 billion | 2.7% | $609 million adjusted EBITDA | down 5.1% | 25.2% | down 2.1 points |
Disney’s domestic figure takes into account cruise activities. Comcast discloses adjusted EBITDA instead of operating income, so the comparison is indicative rather than strictly equivalent.
Peer comparison indicates an alternate margin trend. Universal’s revenue increased by 2.7%, with Epic Universe contributing to growth. However, park EBITDA fell 5.1% due to higher operating expenses.
Disney reported an 11% increase in SVOD revenue to $5.532 billion. Operating income surged to $712 million, more than twice the previous figure. The margin was reported at 12.9%, up from a calculated 6.6% a year earlier.
Subscription growth contributed nine percentage points to the increase in subscription fees, while increased rates accounted for a three-point boost. Advertising revenue climbed 3%, with greater impressions counterbalanced by reduced pricing.
How Disney’s segment profits rose by $980 million
| Driver | Year-on-year OI change | Share of total increase |
|---|---|---|
| Domestic Parks & Experiences | +$438 million | 44.7% |
| SVOD | +$383 million | 39.1% |
| Subtotal for Domestic Experiences and SVOD | +$821 million | 83.8% |
| Other Entertainment, residual | +$275 million | 28.1% |
| Consumer Products | +$116 million | 11.8% |
| International Parks & Experiences | -$53 million | -5.4% |
| Sports | -$179 million | -18.3% |
| Total, except for subtotal row | +$980 million | 100% |
The bridge uses reported segment data and additional figures. SVOD operating income and total segment operating income are reported as non-GAAP measures.
Sports continued to weigh on results, even as revenue increased by 4%. Operating income dropped by 17% to $858 million. Disney pointed to four NBA playoff sweeps and an ongoing carriage dispute as factors.
Toy Story 5 has surpassed $1 billion in worldwide box office sales. Disney reported that the film’s launch boosted merchandise sales and increased Disney+ activity. The movie also influenced demand at Disney’s theme parks. The series has generated more than $4 billion at the box office to date.
The TikTok agreement brings this approach to short-form video content. Financial details remain undisclosed. Disney’s marketing chief Asad Ayaz commented, “The best storytellers are fans first.” Reuters
CEO Josh D’Amaro and CFO Hugh Johnston said, “We believe our shares are undervalued.” Disney aims for buybacks of no less than $9 billion in fiscal 2026. Proceeds from the anticipated $1.2 billion A+E divestment will provide funding for these repurchases. Disney posted an $812 million impairment on the holding. Q4 Capital
Company forecast
| Measure | Disney guidance |
|---|---|
| Fiscal 2026 adjusted EPS increase | Roughly 12%, not counting the 53rd week |
| Fiscal 2026 adjusted EPS increase | Approximately 16%, factoring in the 53rd week |
| Q4 segment operating income total | Near $4.9 billion |
| Q4 benefit from 53rd week | Estimated $600 million |
| Fiscal 2026 operating cash generated | No less than $19 billion |
| Fiscal 2026 capital spending | Around $9 billion |
| Fiscal 2026 buybacks | Minimum of $9 billion |
| Fiscal 2027 adjusted EPS increase | Double-digit, excluding impact of the 53rd week |
This table presents the company’s forward guidance. Both adjusted EPS and total segment operating income are non-GAAP metrics.
Disney had fallen 13.7% for the year before the report. Gains ahead of the market open offset just a portion of that decline. The quote was still delayed and regarded as preliminary.
Risks: Tariff refunds supported the parks beat. Continued softness at Asia parks is likely through Q4. Moana underperformed at the box office, and domestic SVOD ad revenues declined. The additional 53rd week is expected to contribute around $600 million to Q4 segment profit.
Disney’s earnings call was set for 08:30 EDT, after this dateline. The outlook and remarks from executives cited above were taken from the company’s published shareholder letter.
Related articles: NYSE:DIS