
AUSTIN, Minnesota, August 27, 2026, 11:30 (EDT) — Hormel (HRL) stock fell 9.2% as the company reported a 9% drop in retail volume and revised its sales guidance downward.
- Hormel stock dropped 9.2% to $21.52 as of 11:16 a.m. EDT.
- Retail volume declined by 9%, more than offsetting continued growth in foodservice for another quarter.
- The midpoint for fiscal-year sales dropped by $200 million to $12.15 billion.
- Adjusted EPS outlook narrowed higher to a range of $1.45-$1.51.
Hormel Foods stock dropped 9.2% following a decline in retail volume that led to a reset in sales outlook. The fall wiped out roughly $1.2 billion from its quoted market capitalization. The results indicated improved margins were insufficient to balance out softer demand in the grocery sector.
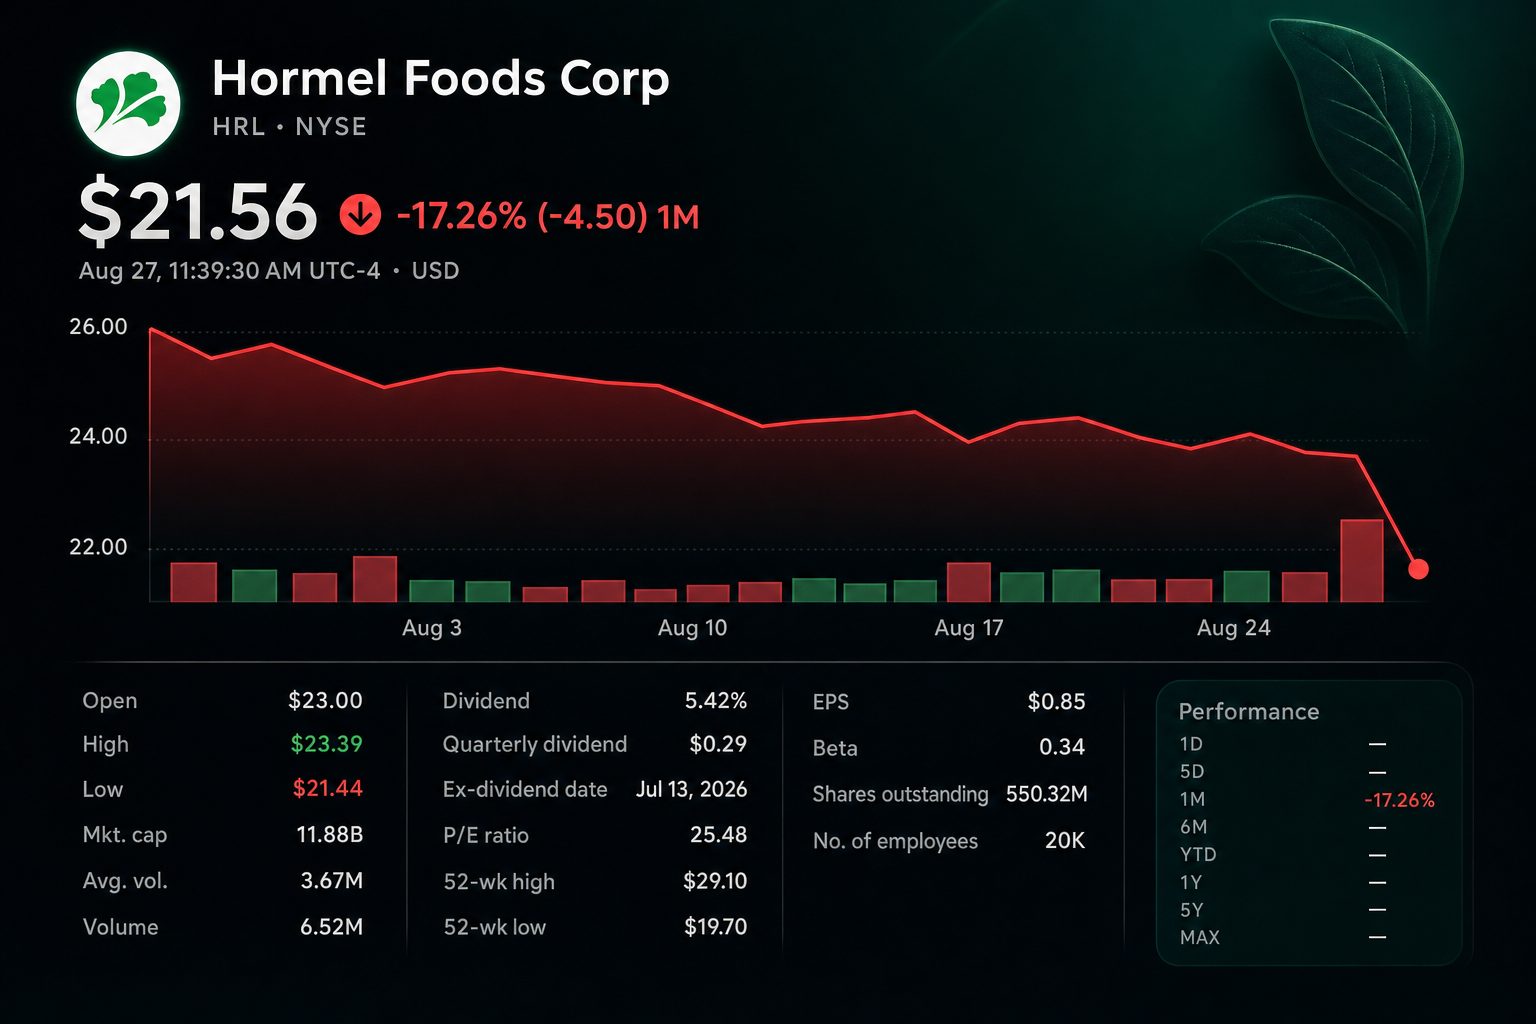
Hormel Foods (NYSE:HRL) was quoted at $21.52 as of 11:16 a.m. EDT. The stock saw volume of 6.05 million shares, roughly 28% higher than its three-month daily average. Shares hit a low of $21.45, approaching the bottom of Thursday’s range.
The packaged-food firm lowered its full-year net sales forecast to a range of $12.1 billion to $12.2 billion, compared with its earlier outlook of $12.2 billion to $12.5 billion. The midpoint declined by $200 million, or 1.6% company results.
Retail lagged behind other segments. Volume dropped 9% while sales were down 4%. The quarter was impacted by private-label snack nuts and commodity turkey. Planters, SPAM and Applegate continued to show growth in some areas.
| Metric | Q3 FY2026 | Q3 FY2025 | Change |
|---|---|---|---|
| Net sales | $2.961bn | $3.033bn | -2.4% |
| Adjusted operating income | $266m | $254m | +4.7% |
| Adjusted operating margin | 9.0% | 8.4% | +0.6 pt |
| Adjusted EPS | $0.37 | $0.35 | +5.7% |
| Operating cash flow | $241m | $157m | +54% |
Foodservice offset declines elsewhere. Sales climbed 2%, while profit for the segment grew 3%. This was the division’s twelfth consecutive quarter posting organic sales gains. Demand was strongest for premium prepared proteins and its branded pepperoni.
Scale is the issue. Retail accounted for $1.78 billion and made up 60% of sales this quarter. Foodservice brought in $1.00 billion. The more robust channel could not offset the drop in retail volumes.
Adjusted profitability increased even as sales faced pressure. The adjusted operating margin climbed to 9.0% from 8.4%. Adjusted earnings were 37 cents per share, up two cents compared to the previous year.
Management increased the lower end of its adjusted EPS outlook by two cents, setting the updated range at $1.45-$1.51. Adjusted operating income guidance was also lifted and now stands at $1.08 billion-$1.12 billion.
GAAP figures were softer, with operating income down 54% to $111 million. Hormel booked a $56 million loss from its Brazil divestiture, a $48 million impairment, and a $38 million settlement.
Cash generation stayed strong. Operating cash flow increased by 54% to $241 million. Hormel distributed $161 million via dividends. Cash, not including assets up for sale, stood at $840 million.
The decline pushed down the forward valuation. Hormel, at $21.52, is trading at roughly 14.5 times the midpoint of its adjusted EPS guidance. The trailing GAAP price-earnings ratio stood at approximately 25.3 times.
Analysts are maintaining a cautious stance. Of 13 tracked recommendations, the average rating is Hold, and the consensus target price is $27.25. This target is about 27% higher than Thursday’s closing price analyst estimates.
Risks: Shoppers could keep opting for cheaper options or reducing purchases. Volatility persists in beef, nuts, fuel, and logistics expenses. Portfolio divestments may also obscure organic growth comparisons.
Hormel maintained its earnings outlook for the quarter, though sales declined. Investors are watching for a recovery in retail volumes. In the meantime, foodservice gains and managing expenses remain crucial for the forecast Reuters.