
NEW YORK, August 7, 2026, 04:33 EDT
- Shares of Restaurant Brands ended Thursday at $72.92, falling 2.1%, even though Burger King’s U.S. comparable sales climbed 8.5%.
- Burger King surpassed the market forecast by 5.0 percentage points, while Tim Hortons Canada fell short by 1.4 points.
- Burger King and International accounted for 101.9% of the nominal system-sales growth at RBI. The remaining three segments together posted a loss of $16 million.
Shares of Restaurant Brands International dropped as Burger King posted its first U.S. comparable-sales quarter above 8% since mid-2023. The market response moved focus from turnaround evidence to concerns over growth concentration.
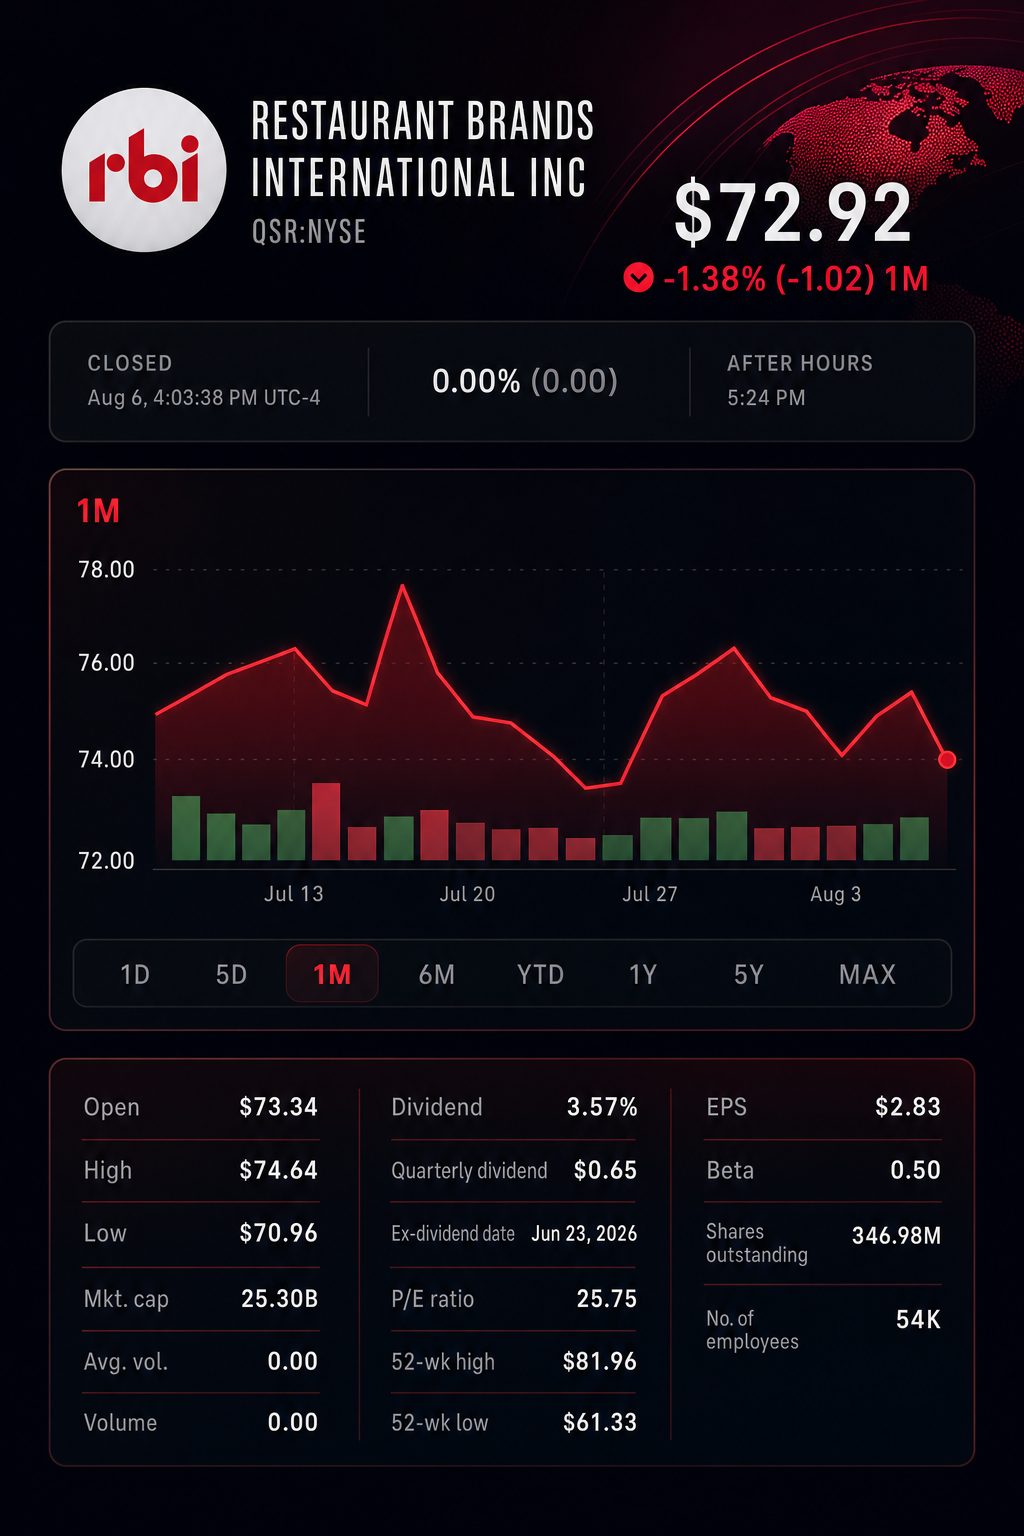
Segment data from RBI reveals the reason. Burger King and International contributed $865 million in system sales at nominal value. Overall company growth reached just $849 million. Tim Hortons, Popeyes and Firehouse Subs together reduced the total by $16 million.
The concentration of earnings is significant. Tim Hortons accounts for approximately 41% of operating income, and Popeyes has seen U.S. sales fall in seven out of the last eight quarters.
Second quarter earnings report card
| Metric | Reported | Market estimate | Year earlier | Beat/(miss) |
|---|---|---|---|---|
| Revenue | $2.52 billion | $2.53 billion | $2.41 billion | $(10) million |
| Adjusted EPS | $1.07 | $1.04 | $0.94 | 2.9% |
| Global comparable sales | 3.8% | 3.0% | 2.4% | 0.8 pp |
| Burger King U.S. comparable sales | 8.5% | 3.5% | 1.5% | 5.0 pp |
| Tim Hortons Canada comparable sales | 0.1% | 1.5% | 3.6% | (1.4) pp |
Figures for revenue and sales come from LSEG LON:LSEG and are cited by Reuters. The market consensus EPS refers to the stated estimate. “pp” indicates percentage points. Reuters
Adjusted earnings climbed 12.9%, with revenue up by 4.6%. Organic adjusted operating income posted a 6.7% rise for the quarter. Growth in the first half was higher, at 8.5%.
Burger King reported increased traction among its drivers. Promotional deals featured two products for $5 as well as three for $7. The chain’s management also refreshed the Whopper’s bun, mayonnaise and packaging. Whopper sales climbed nearly 20%, CEO Josh Kobza said.
Executive Chairman Patrick Doyle stated, “There are still meaningful parts of the business we haven’t yet transformed.” By June, RBI had contributed $194 million toward its intended $550 million Royal Reset investment. Restaurant Dive
Sources of system sales growth for RBI
| Reported segment | Q2 2026 system sales | Q2 2025 | Nominal change | Comparable sales |
|---|---|---|---|---|
| Tim Hortons | $2.003 billion | $1.995 billion | +$8 million | +0.1% |
| Burger King | $3.193 billion | $2.952 billion | +$241 million | +8.6% |
| Popeyes | $1.529 billion | $1.578 billion | $(49) million | (5.1)% |
| Firehouse Subs | $361 million | $336 million | +$25 million | +0.4% |
| International | $5.616 billion | $4.992 billion | +$624 million | +5.5% |
| Total | $12.702 billion | $11.853 billion | +$849 million | +3.8% |
RBI’s stated segment figures serve as the basis for nominal changes. System-sales growth from RBI is disclosed independently, measured using constant-currency terms.
Burger King’s number of restaurants in its home market fell by 0.8%, while locations abroad rose 5.1%. These figures indicate that recent gains for Burger King were driven by better performance at existing stores, rather than by expanding domestically.
Popeyes continued to be a drag, with U.S. comparable sales down 5.2%. This marked an improvement from the 6.5% decrease seen in the first quarter. Firehouse reported a 7.5% rise in system sales, while comparable sales edged up 0.4%. The majority of this growth came from new store openings.
Burger King further increased its advantage over McDonald’s NYSE:MCD in the quarter. Comparable sales at McDonald’s U.S. stores grew by only 0.8%, missing the market forecast of 1.06%.
The benchmark for U.S. burgers
| Q2 measure | Burger King U.S. | McDonald’s U.S. |
|---|---|---|
| 2026 same-store sales increase | 8.5% | 0.8% |
| 2025 same-store sales increase | 1.5% | 2.5% |
| Year-on-year difference | +7.0 pp | (1.7) pp |
| Analyst forecast | 3.5% | 1.06% |
| Performance against forecast | +5.0 pp | (0.26) pp |
Sources: RBI, McDonald’s, Reuters. The companies use differing restaurant systems and reporting standards.
The gap does not represent a permanent shift in market share. It indicates Burger King’s approach to menu and value is delivering results, as McDonald’s reported challenges with U.S. promotion execution.
RBI reiterated its forecast for roughly 8% organic adjusted operating-income growth in 2026. In the quarter, the company distributed $435 million via dividends and share buybacks. As of July 31, $794 million remained on its buyback authorization.
Royal Bank of Canada NYSE:RY, Morgan Stanley NYSE:MS and Deutsche Bank NYSE:DB provided the most recent confirmed preliminary results calls. While targets continue to point to potential gains, ratings reflect contrasting perspectives on execution risk.
Analyst ratings
| Research firm | Date | Recommendation | Price target | Upside from $72.92 |
|---|---|---|---|---|
| RBC Capital Markets | July 28 | Outperform | $85 | 16.6% |
| Morgan Stanley | July 15 | Equal Weight | $79 | 8.3% |
| Deutsche Bank | July 9 | Buy | $85 | 16.6% |
| MarketBeat consensus, 23 analysts | Current | Moderate Buy | $83.86 | 15.0% |
The measures by the firm occurred before RBI’s Q2 report was issued. No confirmed updates to targets following results have been reported.
Morgan Stanley analyst Brian Harbour said restaurant industry trends remain “fine broadly” though there are “masking signs of strain.” The drop on Thursday indicates investors continue to differentiate between a single leading brand and a diversified portfolio. TipRanks
The NYSE main trading session ended at the dateline and will resume at 09:30 EDT. RBI shares rose 2.1% for the week to July 31 before declining 1.5% through Thursday.
Wendy’s NASDAQ:WEN is the next burger chain scheduled to report results, with earnings expected before the opening bell on Friday. Its conference call will begin at 08:30 EDT. Upcoming economic data includes July consumer inflation on August 12, followed by U.S. retail sales figures on August 14.
Risks: Beef accounts for approximately a quarter of RBI’s food basket, increasing vulnerability to commodity price rises for restaurant operations. Burger King is up against more challenging comparables, while both Popeyes and Tim Hortons continue to require persistent gains in customer traffic.
Further analysis
What stock allows investors to gain exposure to Burger King and the Whopper?
The Whopper is a menu item rather than a traded security. Burger King is owned by Restaurant Brands International, which operates under the ticker QSR. Shares ended the session on August 6 at $72.92, representing a 2.1% decline. The company’s market capitalization stood at approximately $33.5 billion.
Is Burger King’s Whopper-focused recovery truly accelerating?
Burger King reported an 8.5% increase in U.S. comparable sales for the second quarter, up from a 1.5% rise in the same period the prior year. Analysts were looking for growth of about 3.5%. Sales of the Whopper per location have climbed over 20% since the brand’s elevation campaign was launched. This is strong evidence, but not conclusive.
Is the increase being driven by improved food quality or deeper discounts?
Both elements played a role. Demand rose on Whopper enhancements, better service and restaurant investments. Value-focused buyers were drawn by $5 Duos and $7 Trios. Management maintained menu price hikes at low single digits. Sustained customer traffic is now more important than launching another deal.
Are franchisees able to cover additional remodeling expenses with elevated beef prices?
Beef prices hit all-time highs in the quarter, weighing on restaurant margins. RBI has deployed $194 million of its planned $550 million Royal Reset investment. Executives anticipate that remodel activity will pick up pace more noticeably during 2027, with that outlook partly dependent on a decline in beef prices.
What caused QSR shares to decline even as Burger King posted strong quarterly results?
The broader portfolio showed mixed performance. Adjusted earnings increased by 12.9% to $1.07 per share. Revenue reached $2.52 billion, just below analyst expectations of $2.53 billion. Tim Hortons Canada posted growth of only 0.1%. Popeyes U.S. sales declined by 5.2%. Investors were attentive to these areas of weakness.
![Australia Stock Market Today 28/08/2026 [UPDATE: 10:37 AEST] [ASX Rebounds as Tech and Energy Offset Bank Weakness]](https://ts2.tech/wp-content/uploads/2026/08/AU-market-dashboard-2026-08-28-1034-480x384.jpg "Australia Stock Market Today 28/08/2026 [UPDATE: 10:37 AEST] [ASX Rebounds as Tech and Energy Offset Bank Weakness]")