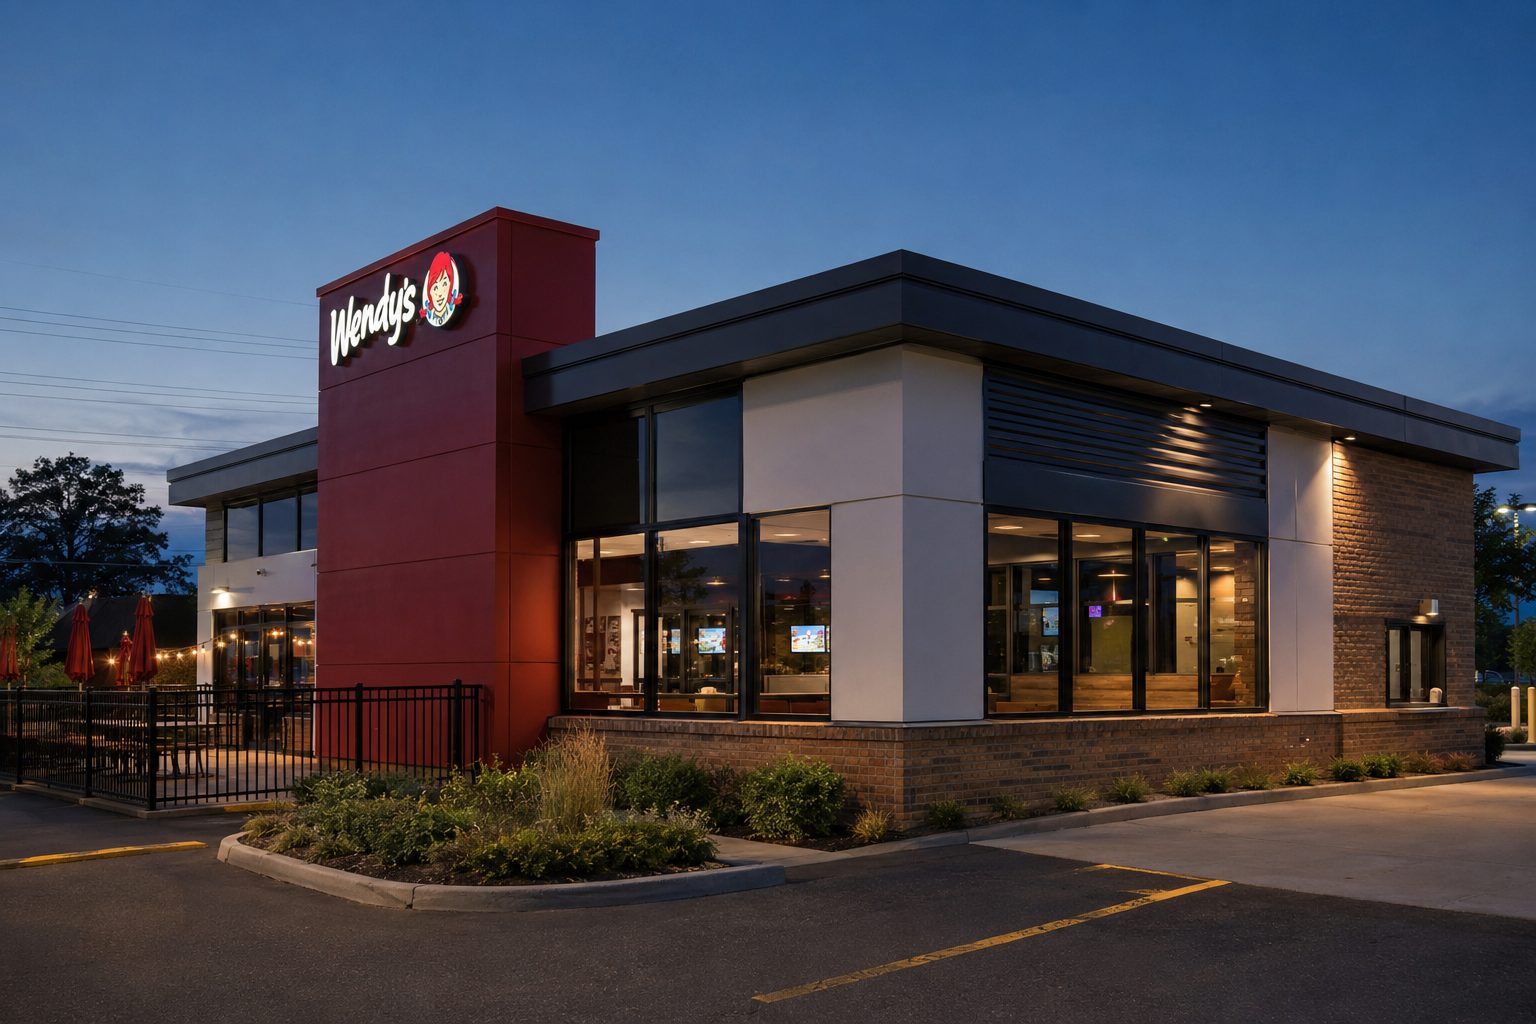
Wendy's stock dropped 12.9% after its top shareholder withdrew from a potential acquisition. The decline wiped out nearly the entire bid-fueled surge seen in August. The restaurant group is once again being valued based on its individual recovery prospects.
| Previous close | $9.04 |
| Open | $7.88 |
| Intraday high | $7.98 |
| Intraday low | $7.68 |
| Volume | 11.35m |
| Average volume | 8.96m |
| Relative volume | 1.27× |
| Trailing P/E | 11.9× |
| Annualized dividend yield | 3.6% |
| Q2 2026 | Current | YoY |
|---|---|---|
| Global systemwide sales | $3.423bn | −6.5% |
| U.S. systemwide sales | $2.876bn | −8.2% |
| Adjusted EBITDA | $124.1m | −15.4% |
| Net income | $32.6m | −40.8% |
| Adjusted EPS | $0.18 | −37.9% |
| Measure | Before | Now |
|---|---|---|
| Quarterly dividend | $0.14 | $0.07 |
| Annualized payout | $0.56 | $0.28 |
| 2026 outlook | Issued | Withdrawn |
| Q2 repurchases | — | $0 |
The bid premium is gone. Wendy's valuation now depends on five operational levers: menu quality, value, marketing, execution and digital frequency. Revenue growth is less useful while franchise royalties, traffic and restaurant margins fall.
● Trian could revisit a bid, creating sharp volatility.
● Traffic losses directly reduce franchise royalties.
● Higher turnaround spending can delay margin recovery.
● International growth may not offset U.S. weakness.
| Metric | Result | Year over year |
|---|---|---|
| Revenue | $570.6M | +1.7% |
| U.S. same-restaurant sales | — | −7.0% |
| U.S. systemwide sales | $2.88B | −8.2% |
| U.S. restaurant margin | 13.8% | −240 bps |
| Operating profit | $79.3M | −24.0% |
| Net income | $32.6M | −40.8% |
| H1 free cash flow | $120.3M | +9.9% |
FactSet current estimates on Aug. 26. One month earlier: $0.14, $0.57 and $0.64, respectively.
| Company | P/E | Consensus |
|---|---|---|
| Wendy’s | 13.7x | Hold |
| Restaurant Brands | 21.4x | Buy |
| Yum! Brands | 19.5x | Buy |