
NEW YORK, August 7, 2026, 10:06 EDT — U.S. regular trading has begun.
- Wendy’s retracted its 2026 guidance and reduced its quarterly dividend by half to seven cents.
- Same-restaurant sales in the U.S. dropped 7%, steeper than the anticipated 4.7% decrease.
- The dividend adjustment is expected to preserve around $53.4 million each year.
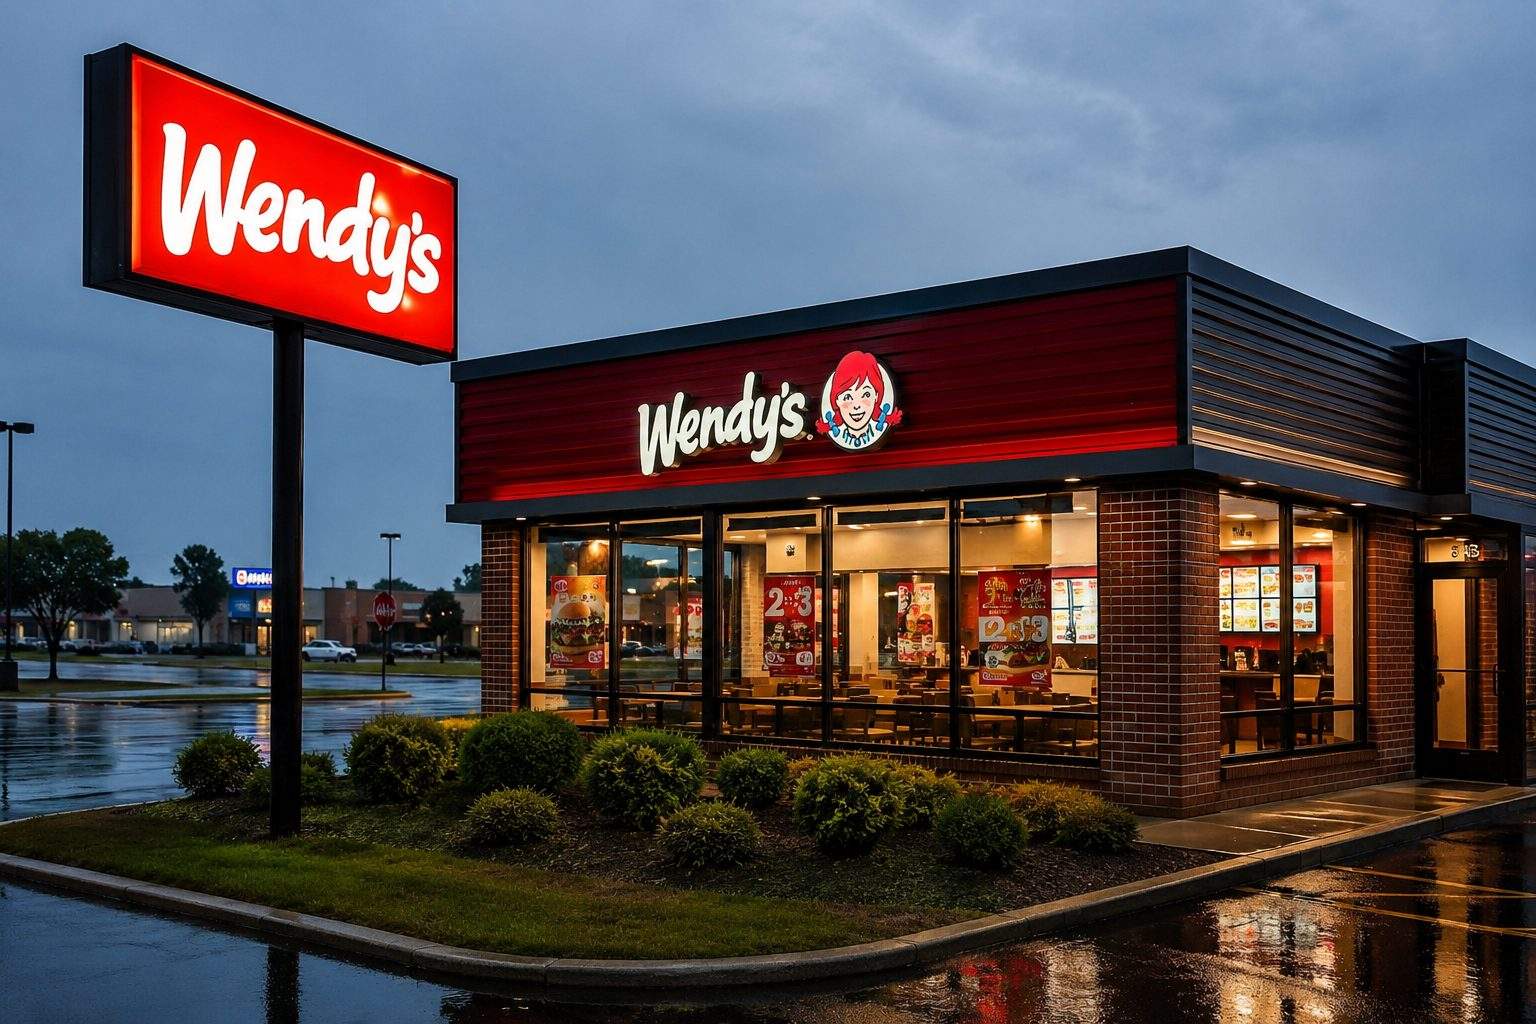
Wendy’s Company NASDAQ:WEN withdrew its outlook for 2026 on Friday and reduced its quarterly dividend by 50% to seven cents. The decision prioritizes cash retention over payouts to income investors as U.S. customer traffic declines. The stock was little changed at $7.39 by 9:50 a.m. EDT, after starting the session at $7.08.
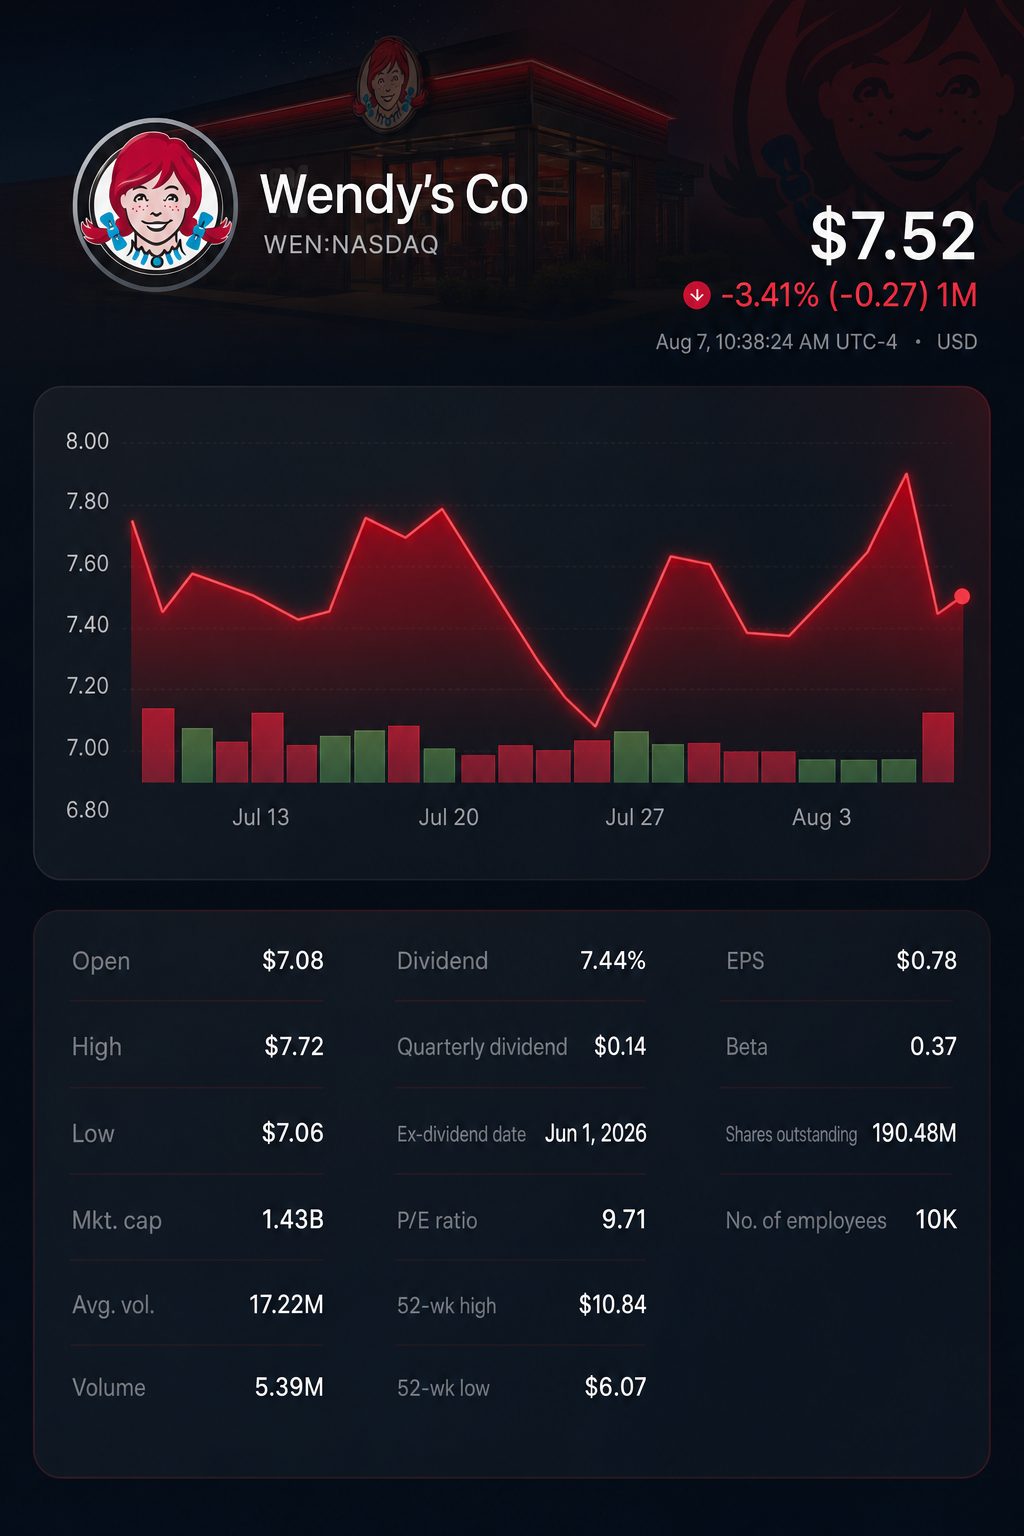
The reduction is expected to preserve approximately $53.4 million each year, using shares outstanding at the end of the quarter. That amount is close to the $55.3 million Wendy’s reported earning in the first half. The basis for investment has changed, focusing now on performance rather than returns.
Headline earnings surpassed expectations. Adjusted profit came in at 18 cents per share, above the forecast of 16 cents. Revenue totaled $570.6 million, topping the $557.1 million estimate. Still, U.S. same-restaurant sales were 2.3 percentage points below consensus.
| Metric | Q2 2026 | Q2 2025 | Consensus | Investor read-through |
|---|---|---|---|---|
| Revenue | $570.6m | $560.9m | $557.1m | 2.4% above |
| Adjusted EPS | $0.18 | $0.29 | $0.16 | 12.5% above |
| U.S. same-restaurant sales | -7.0% | -3.6% | -4.7% | 2.3 percentage points lower |
| Adjusted EBITDA | $124.1m | $146.6m | — | Decreased 15.4% |
| U.S. company-operated margin | 13.8% | 16.2% | — | Fell by 240 basis points |
Sources: Wendy’s company figures and consensus projections. Percentage surprises reflect calculations based on reported numbers.
The revenue outperformance lacked strength. While reported revenue increased by 1.7%, adjusted revenue declined by 1.4%. Wendy’s attributed the reported sales growth to advertising-fund reallocation, vendor incentives and restaurant acquisitions. Income from franchise royalties and rent decreased.
Chief Executive Bob Wright stated, “Today we are clearly not performing at our potential.” He listed menu value, marketing, operations, digital frequency and restaurants as the company’s five main areas for improvement. Irv Wendy’s
Capital allocation presents an immediate option. The prior annual dividend of 56 cents amounted to approximately $106.8 million. At the revised rate of 28 cents, the cost falls to around $53.4 million. These initial reporter calculations are based on 190.639 million shares in circulation.
| Dividend and cash measure | Previous policy | New policy | Effect |
|---|---|---|---|
| Quarterly dividend per share | $0.14 | $0.07 | down 50% |
| Annualised dividend per share | $0.56 | $0.28 | down 50% |
| Approximate annual cash outlay | $106.8m | $53.4m | $53.4m kept |
| Implied yield at $7.39 | 7.6% | 3.8% | down 3.8 points |
| Annual cash retained versus H1 free cash flow | — | — | 44.4% |
Calculations by the reporter are based on Wendy’s present share price, the number of shares reported by the company, and free cash flow of $120.3 million for the first half.
The sales issue appears to be driven by competition rather than just regular fluctuations. Wendy’s lagged McDonald’s Corp NYSE:MCD by 7.8 percentage points and was 15.5 points behind Burger King U.S., owned by Restaurant Brands International NYSE:QSR.
| U.S. brand | Q2 2026 comparable sales | Gap versus Wendy’s |
|---|---|---|
| Wendy’s | -7.0% | — |
| McDonald’s | +0.8% | -7.8 points |
| Burger King U.S. | +8.5% | -15.5 points |
Data from the quarterly disclosures of Wendy’s, McDonald’s, and Restaurant Brands International.
Profit also declined as traffic slipped. The U.S. company-operated margin decreased by 240 basis points to 13.8%. Operating profit slid 24%, and adjusted EBITDA was down 15.4%. Wendy’s pointed to commodity inflation, reduced guest counts and rising labor costs.
Closures contributed further pressure. Wendy’s finished the quarter operating 5,724 U.S. restaurants, a decrease of 243 locations from a year ago. Net closures in the U.S. totaled 81 for the quarter. International systemwide sales increased by 3.4%, while comparable sales declined by 2.3%.
Analysts maintained a cautious stance ahead of Friday’s report. According to MarketBeat’s 12-month data, the outlook comprised six sell ratings, 13 holds and three buys. The average target price was $8.04, with the most recent forecasts between $6 and $12.
| Date | Brokerage and analyst | Action | Recommendation | Target |
|---|---|---|---|---|
| July 28 | Citigroup Inc. NYSE:C, Jon Tower | Target cut | Neutral | $7.25 |
| June 23 | Stephens, Jim Salera | Maintained | Equal Weight | $8.00 |
| May 13 | Argus Research, Christine Dooley | Upgraded | Buy | $12.00 |
| May 11 | JPMorgan Chase & Co. NYSE:JPM, Rahul Krotthapalli | Downgraded | Underweight | $6.00 |
These suggestions were made prior to the second-quarter report and could be updated.
Wendy’s was valued at roughly 9.5 times its trailing earnings. McDonald’s traded at approximately 22.7 times, and Restaurant Brands at about 19.7 times. This represents a significant discount. Assessing whether this is appropriate is complicated due to the withdrawn outlook.
The next driver is Wright’s comprehensive turnaround strategy. Investors want to see clear spending targets, franchisee return benchmarks, and specific measures to boost U.S. traffic into positive territory. While savings from the dividend provide resources, they do not guarantee success.
Risks: Ongoing traffic declines, rising beef prices, and higher labor expenses may postpone a margin rebound. Accelerated progress from competing burger chains could increase pressure on franchise holders. A swift comeback driven by value offers would test bearish expectations.
The investor assessment is straightforward. Wendy’s has secured roughly $53 million in yearly flexibility. The company needs to turn that cash into increased customer traffic before the difference with competitors becomes permanent.
Related articles: NASDAQ:WEN



![Asia Stock Market Today 28/08/2026 [UPDATE: 00:51 SGT] [Salesforce Leads KASE Global Into Final Minutes After Asia’s Split Close]](https://ts2.tech/wp-content/uploads/2026/08/Asia-market-dashboard-2026-08-28-0051-480x384.jpg "Asia Stock Market Today 28/08/2026 [UPDATE: 00:51 SGT] [Salesforce Leads KASE Global Into Final Minutes After Asia’s Split Close]")