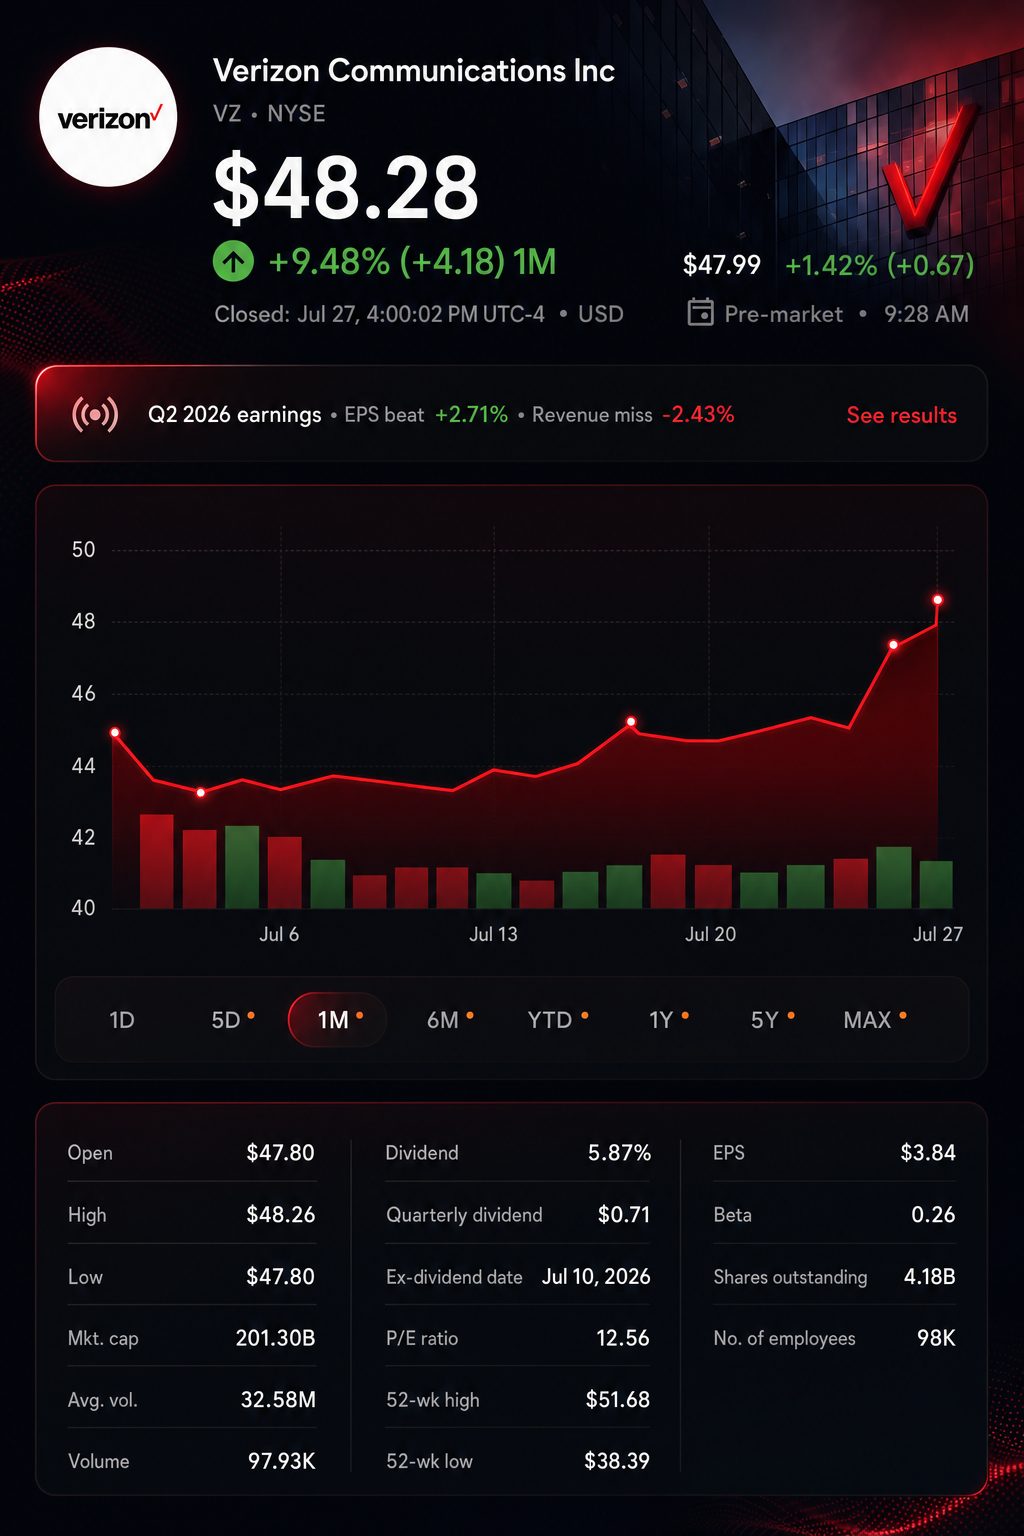
Verizon was at $47.89 in early premarket trading, rising 1.2%, according to preliminary data.
Verizon reported 239,000 phone additions in the first half, making the remaining second-half target challenging.
Verizon reported a 24.4% increase in second-quarter free cash flow to $6.4 billion.
Verizon Communications Inc. NYSE:VZ gained 1.2% to reach $47.89 in early premarket action Tuesday. The move followed an 8.0% increase recorded over Friday and Monday sessions. U.S. cash markets had yet to open.
At this level, Verizon was up 9.3% from Thursday’s closing price before results. This is notable since wireless growth continues to lag behind the leading rival. Investors, however, are favouring improved cash flow and decreased customer expenses.
The main challenge lies in second-half calculations. Verizon saw an increase of 55,000 postpaid phone additions in the first quarter, followed by another 184,000 in the second quarter. This brought the total for the first half to 239,000.
The company projects full-year net additions to reach the upper range of its 750,000–1 million outlook, suggesting guidance between 875,000 and 1 million. As a result, Verizon will require 636,000–761,000 new additions in the second half.
Investor test
Reported result
Implied requirement or comparison
First-half postpaid phone net adds
239,000
636,000–761,000 required in H2
Phone net adds, quarterly
184,000 for Q2
Average of 318,000–381,000 needed in Q3 and Q4
Free cash flow, Q2
$6.4 billion
Increase of 24.4% from prior year
Capital returned, first half
$9.4 billion
Represents 92% of $10.2 billion free cash flow
The second-half numbers and 92% proportion are derived from company disclosures. The required quarterly subscriber growth rate is between 73% and 107% higher than in the previous quarter. Cash flow has given executives additional breathing room but has not eliminated the challenge in reaching required volumes.
Chief Executive Dan Schulman said, “We are accelerating across our key metrics.” He attributed the progress to simpler plans, loyalty programs and bundled offerings. Verizon
Verizon reported a stronger financial profile despite a 0.7% decrease in overall revenue. Service revenue from mobility and broadband increased by 2.8% to $23.4 billion. Adjusted EBITDA rose 7.2% to $13.7 billion, pushing the margin to a record 40.1% for the company.
Equipment sales declined by almost 20%, amounting to a drop of over $1.2 billion. Fewer customers upgraded their phones, and Verizon cut back on device subsidies. As a result, the smaller sales figure had a more favorable economic profile.
Free cash flow totaled $6.4 billion, a 24.4% increase. For the first half, free cash flow amounted to $10.2 billion. Verizon distributed $9.4 billion via dividends and share repurchases, which featured $3.5 billion in buybacks.
Management increased its adjusted earnings outlook to a range of $4.99 to $5.04 per share. The company forecasts free-cash-flow growth between 9% and 10%. Mobility and broadband service revenues are projected to rise by 2.5% to 3.0%.
Rival activity is still higher. AT&T Inc. NYSE:T reported 432,000 net postpaid phone adds for the quarter. T-Mobile US Inc. NASDAQ:TMUS posted 277,000 postpaid account adds. T-Mobile has stopped disclosing specific phone net adds, so direct comparisons are not exact.
Verizon reached a fiber deal valued at over $1 billion with Alphabet Inc.’s NASDAQ:GOOGL Google. Schulman stated that additional deals could bring in billions more in the coming years. While this offers a new route for growth, it does not deliver short-term wireless support.
Risks: Shares have risen 9.3% since Thursday’s close. Verizon continues to hold $128.7 billion in net unsecured debt. Failing to reach the anticipated subscriber increase may challenge the revised valuation.
The third quarter marks the next milestone. Management anticipates service growth of close to 3%, followed by a rise to around 4% in the fourth quarter. Investors are also monitoring whether phone additions are tracking close to the necessary rate.
Following the earnings rally, where is Verizon stock currently trading?
Verizon finished Monday at $47.32, gaining 2.0% for a second day in a row. The stock stayed 8.4% under its March 24 peak of $51.68. MarketWatch Based on that close, shares are valued at around 9.4 times the midpoint of management’s projected 2026 adjusted earnings per share. The annual dividend of $2.83 equates to a yield near 6.0%.
Did Verizon surpass forecasts for the second quarter?
Adjusted earnings came in at $1.30 per share, surpassing LSEG’s consensus of $1.27. Overall revenue was $34.3 billion, falling short of the $35.16 billion analyst estimate. Verizon posted a net addition of 184,000 postpaid phone customers, higher than FactSet’s prediction of 103,900. The quarter topped forecasts for profit and subscriber growth, though total revenue lagged expectations.
Will the improvement in wireless customer numbers last?
Verizon added 184,000 postpaid phone subscribers, marking its strongest second-quarter performance for consumer lines in five years. Verizon Overall postpaid phone churn declined by five basis points from a year earlier, reaching 0.92%. Phone net additions for the first half amounted to 239,000. Hitting the upper range of guidance will require 636,000 to 761,000 new additions in the second half, a significantly quicker pace. Delivery in the third quarter is now key.
What caused a drop in revenue even as subscriber numbers improved?
Total revenue slipped 0.7% as equipment sales dropped almost 20%. Equipment revenue was down $1.23 billion due to a decrease in the upgrade rate, falling to 2.6% from 3.6%. Customers held onto devices for longer periods, and Verizon scaled back on phone subsidy outlays. Mobility and broadband service revenue increased 2.8% to $23.4 billion. This combination lifted adjusted EBITDA margin to a record high of 40.1%.
What caused reported profit to decline as adjusted earnings increased?
Verizon’s GAAP net income declined 22.9% to $3.9 billion, even as core business performance improved. The company recorded $1.8 billion in pretax special items for the quarter, including a $746 million loss on disposition and a $397 million severance expense. Adjusted earnings per share climbed 6.6%, and adjusted EBITDA rose 7.2% to $13.7 billion. The discrepancy is mainly due to restructuring-related accounting, though associated cash outflows remain significant.
What are the conditions for achieving the upgraded 2026 guidance?
Verizon projects 2026 adjusted EPS in the range of $4.99 to $5.04. Verizon Adjusted EPS in the first half was $2.58, which implies $2.41 to $2.46 for the second half. Verizon Guidance for free cash flow indicates approximately $21.9 billion to $22.1 billion in 2026. With free cash flow at $10.2 billion as of June, Verizon must generate $11.7 billion to $11.9 billion more. Management anticipates combined service revenue growth close to 3% for Q3 and 4% for Q4.
Is Verizon able to support dividends, share repurchases and lower its debt?
Verizon pays a quarterly dividend of 70.75 cents, totaling $2.83 per share per year. Verizon Free cash flow in the first half stood at $10.2 billion, covering $5.9 billion in dividends by 1.7 times. Verizon repurchased $3.5 billion of shares and increased its full-year buyback target to $4.5 billion. Net unsecured debt dropped by $1.4 billion in Q2 to $128.7 billion. Dividend coverage appears strong for now, though future payouts are not assured.
Does Frontier provide sufficient support to warrant the increased leverage?
Verizon finalized the Frontier deal on January 20 with a cash payment of about $9.4 billion and took on around $12.9 billion in Frontier's debt. SEC Fiber connections totaled 10.9 million, increasing by 155,000 during Q2. Net unsecured debt was $128.7 billion, equal to 2.5 times adjusted EBITDA. The company aims for annual run-rate synergies above $1 billion by 2028, though this remains a projection. Integration benefits have yet to be demonstrated.
What is the significance of the Google AI-fiber agreement?
Verizon places the value of its Google dark-fiber agreement at over $1 billion. Further anticipated contracts may generate billions of dollars in revenue over several years. Reuters The company expects AI Connect revenue to begin impacting results as of 2027, and targets margins at or above the company’s current structure. Verizon has not fully disclosed details on annual revenue pacing, customer concentration or required capital.
Jerzy Lewandowski is a senior markets editor at TS2.tech. His coverage ranges from stocks and semiconductors to AI and the broader global markets. He studied economics at the University of Warsaw and worked in investment analysis before becoming a financial journalist. Follow Jerzy Lewandowski on Google News.
A figure above or below the 12.0 consensus could impact Treasury yields, the dollar, and cyclical stocks by influencing short-term growth outlooks.
#2
NAHB Housing Sentiment
A reading above or below 33 will influence expectations for housing demand, mortgage rate trends, and homebuilder stocks.
#3
Fabrinet After the Close
Investors are focusing on revenue, margins, and comments on datacom as key factors for companies involved in optical networking and AI infrastructure supply chains.