
ISSAQUAH, Washington, August 17, 2026, 08:55 PDT — U.S. cash trading has commenced.
- Costco stock fell 0.7% to $947.85, putting the retailer’s valuation at around $420 billion.
- During the initial 36 weeks of fiscal 2026, membership fees accounted for 51.5% of operating income.
- The consensus price target implies a 13.6% potential gain, although Costco is valued at almost 48 times its trailing earnings.
Shares of Costco Wholesale Corporation NASDAQ:COST declined by 0.7% to $947.85 on Monday, placing its market capitalization at approximately $420.35 billion. The stock continued to trade at around 48 times trailing earnings.
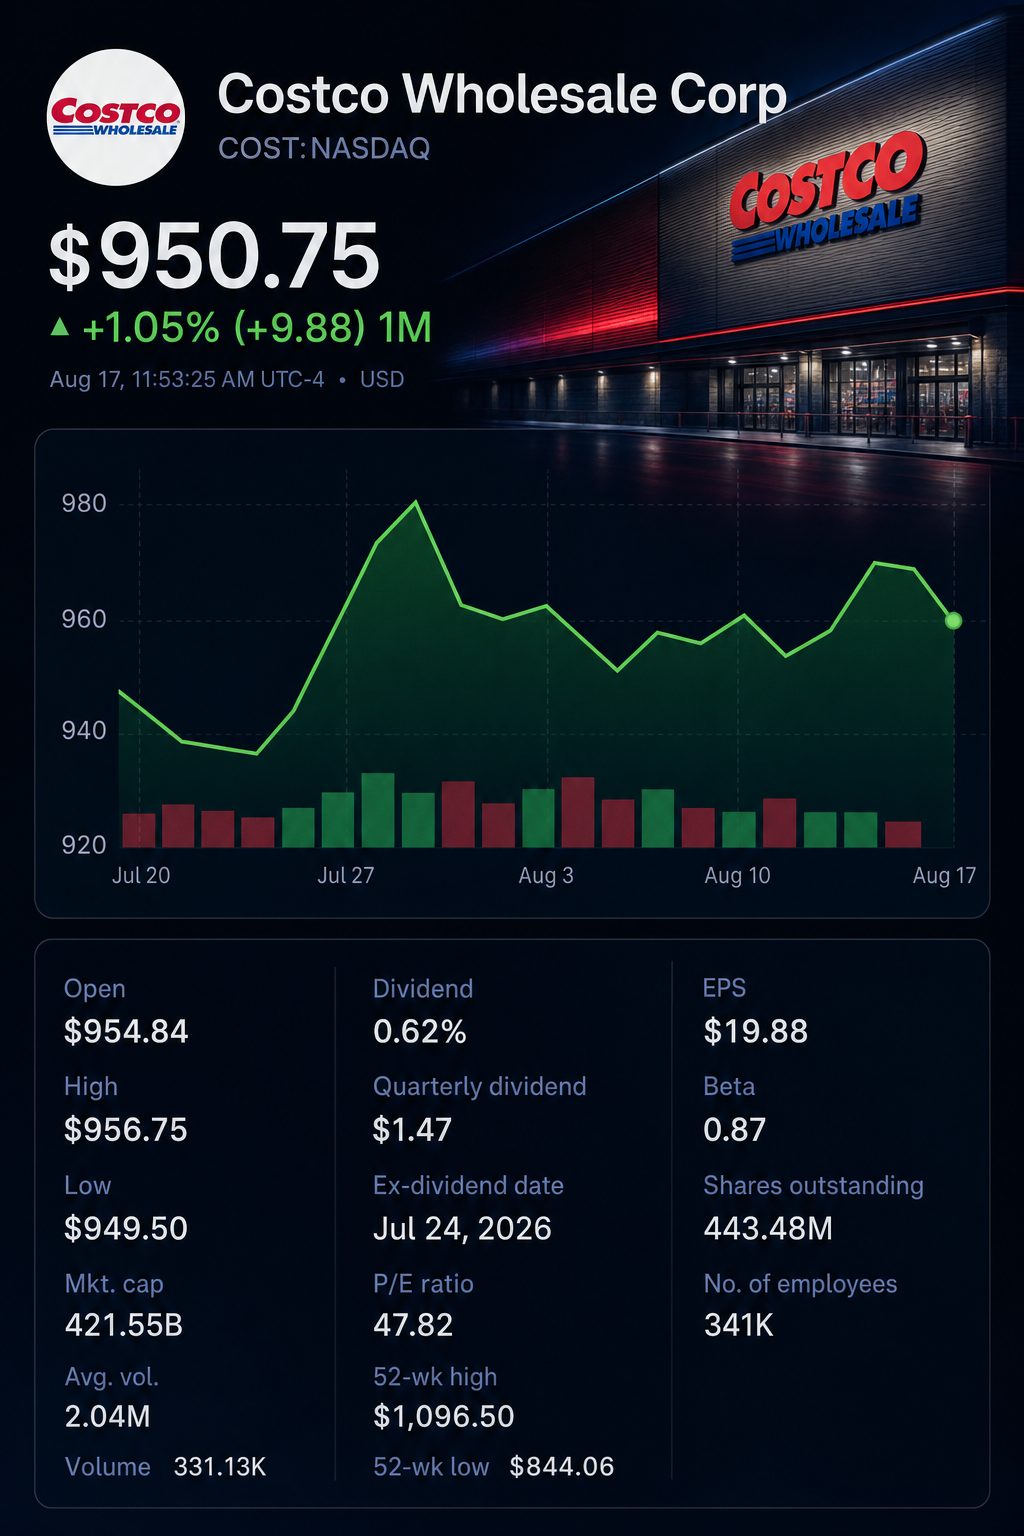
The valuation relies heavily on the economics of membership at that price. While sales far outpace fee revenue, fees account for roughly half of operating profit. As a result, investors require consistently resilient trends in renewal, upgrades and member growth.
| Costco market snapshot | Latest figure | Investor reading |
|---|---|---|
| Share price | $947.85 | Fell 0.7% Monday |
| Market value | $420.35 billion | Global retailer with mega-cap status |
| Trailing P/E | 47.9 times | Valuation at a premium |
| Forward P/E | 42.0 times | Reflects continued robust growth expectations |
| Average analyst target | $1,076.91 | 13.6% potential upside seen |
The valuation remains elevated even for defensive retail. In July, Costco was trading at approximately 46 times earnings. Walmart Inc. NYSE:WMT was near 39 times, and BJ’s Wholesale Club Holdings Inc. NYSE:BJ was around 20 times.
| Warehouse-retail valuation | Approximate trailing P/E | Discount to Costco |
|---|---|---|
| Costco | 46 times | — |
| Walmart | 39 times | 15% |
| BJ’s Wholesale | 20 times | 57% |
The premium provides operating backing. Net sales for the fiscal third quarter increased by 11.6% to $69.15 billion. Adjusted comparable sales rose by 6.6%, with a 20.8% jump in digitally enabled sales. Net income grew 15.2% to $2.19 billion.
| Fiscal Q3 operating measure | 2026 result | Year-on-year change |
|---|---|---|
| Net sales | $69.15 billion | up 11.6% |
| Adjusted comparable sales | — | increased 6.6% |
| Digitally enabled comparable sales | — | rose 20.8% |
| Membership fees | $1.37 billion | up 10.7% |
| Net income | $2.19 billion | grew 15.2% |
The profit bridge offers greater insight. Membership fees totaled $4.06 billion over 36 weeks. Operating income was $7.88 billion. As a result, fees represented 51.5% of operating income, an increase from 51.1% the previous year.
| Membership economics, 36 weeks | Fiscal 2026 | Fiscal 2025 | Change |
|---|---|---|---|
| Membership fees | $4.057 billion | $3.599 billion | +12.7% |
| Operating income | $7.884 billion | $7.042 billion | +12.0% |
| Fees as portion of operating income | 51.5% | 51.1% | +0.4 point |
Core sales are still robust, but growth has slowed. Net sales in June increased by 10.6% to $29.24 billion. Adjusted comparable sales for the company were up 7.0%, with digital comparable sales rising 21.5%. In May, headline growth had been higher.
Macroeconomic factors on Monday set a higher bar. U.S. retail sales declined 0.6% in July, missing forecasts that called for a modest increase. Control-group sales slipped 0.4%. Costco’s draw could help maintain shopper flows, but softer consumer demand might limit growth in average transaction size.
Management has leveraged fuel pricing to emphasize value for members. “We’ve widened our gaps in terms of price,” Chief Financial Officer Gary Millerchip stated following the May quarter. He noted that fuel savings continued to be a major concern for members. Reuters
The approach can strengthen ties with customers. Chief Executive Ron Vachris noted that those who purchase fuel tend to increase their in-warehouse spending. He also mentioned average U.S. same-day delivery times remained under 45 minutes. Digital expansion is emerging as a secondary retention strategy.
| Analyst | Date | Recommendation | Price target | Upside from $947.85 |
|---|---|---|---|---|
| JPMorgan | July 9 | Overweight | $1,100 | 16.1% |
| RBC Capital | July 13 | Sector Perform | $1,000 | 5.5% |
| Telsey Advisory | April 9 | Outperform | $1,135 | 19.7% |
| BMO Capital | March 6 | Outperform | $1,315 | 38.7% |
Wall Street’s outlook stays upbeat, though price targets vary significantly. Among analysts, there are 23 buy recommendations, 14 hold and two sell ratings. The average target price of $1,076.91 suggests a potential gain of 13.6%.
RBC’s baseline scenario highlights the ongoing uncertainty. The firm assigns Costco a valuation near 40 times projected fiscal 2028 earnings, exceeding its ten-year median multiple of 33.4. RBC anticipates continued growth from digital economics and retail media, but noted many advantages are already factored in.
Risks: A slowdown in membership growth, reduced renewal rates or slimmer merchandise margins could pressure the multiple. Tariffs, fuel expenses and competitive pricing from peers increase uncertainty.
The immediate issue is straightforward. Costco needs to transform member loyalty into profit growth in the double digits. With a 48-times multiple, there is limited tolerance for any slowdown.
Related articles: NASDAQ:COST