Costco (NASDAQ:COST) Shares Gain With Staples Surge, but Valuation Tops 50-Times Earnings

NEW YORK, July 28, 2026, 11:01 EDT (U.S. markets open)

  • Costco shares were up 3.6% at $986.08 shortly after 10:46 a.m. EDT.
  • The Consumer Staples Select Sector SPDR Fund (NYSEARCA:XLP) climbed 3.9%. Three major retail rivals saw an average increase of 3.8%.
  • Costco reported a 7.0% increase in adjusted comparable sales for June, with digitally enabled sales up 21.5%.

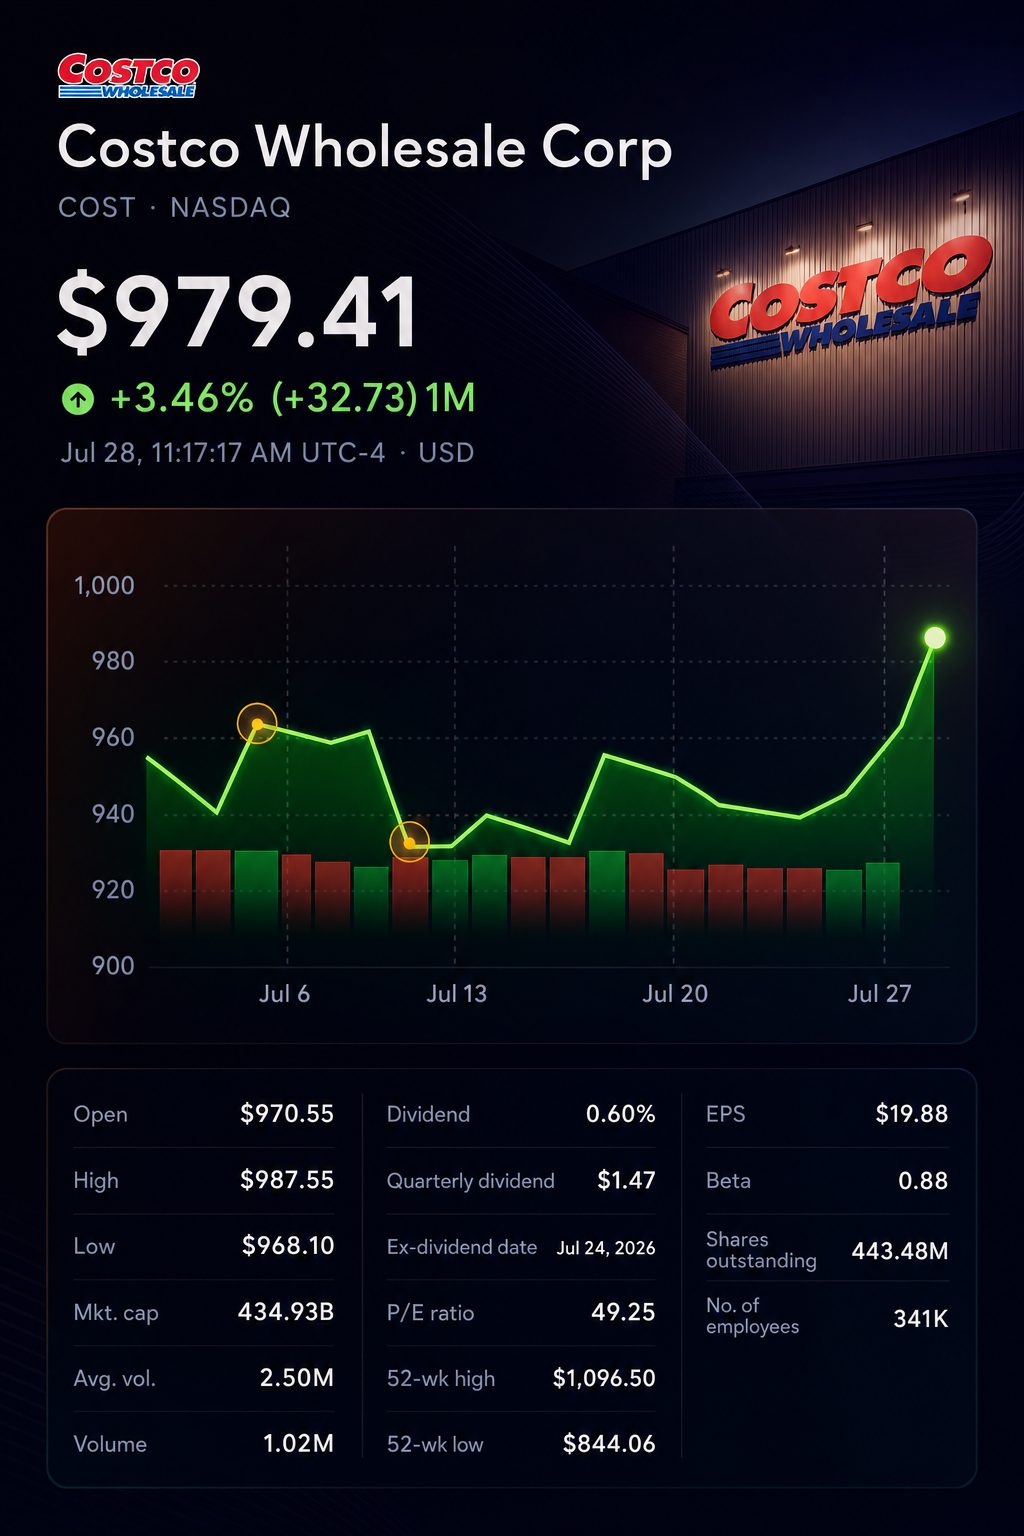
Costco shares rose 3.6% to $986.08 early Tuesday. The gain appeared driven by sector rotation rather than a new re-rating.
Stock chart for NASDAQ:COST

The consumer-staples fund gained 3.9%. As of 9:49 a.m. EDT, the sector index advanced 3.1%, while technology slipped 1.9%. Semiconductor stocks declined due to worries over AI investment and rivalry from China.

Costco did not take the leading position.

CompanyIntraday moveTrailing P/ECostco P/E premium
Costco Wholesale up 3.6%49.6x
Walmart up 3.6%40.6x22%
BJ’s Wholesale Club up 4.0%22.6x119%
Target up 3.7%19.2x158%

Market update as of around 10:46 a.m. EDT. Premiums reflect how Costco’s trailing multiple stacks up against each peer.

The trio of peers posted an average rise of 3.8%, roughly 0.2 percentage point higher than Costco. This trend undercuts the idea that Tuesday’s climb was driven by company-specific factors.

Costco shares trade at $986.08, giving the stock a trailing earnings multiple of 49.6. If the share price remains the same, earnings per share would need to climb to $24.27 for Costco to trade at Walmart’s price-to-earnings ratio of 40.6. That represents a 22% increase over Costco’s trailing EPS of $19.88. This calculation serves as an illustration and is not a projection.

The threshold is also 7% above the consensus for fiscal 2027, and is close to the fiscal 2028 projection of $24.97. According to the peer-multiple comparison, the share price already reflects a substantial portion of anticipated earnings growth over the next two years.

Recent earnings point to ongoing expansion, though not as quickly. Net income for the third quarter increased 15% to $2.19 billion. Net sales were up 11.6% at $69.15 billion.

Operational momentum continues to be strong. Net sales for June increased by 10.6% to reach $29.24 billion. Adjusted comparable sales climbed 7.0%, and digital sales rose by 21.5%.

Membership continues to provide the strongest valuation backing. The number of paid members increased by 4.1% to 82.9 million, with executive memberships up by 9.6%. Renewal rates in the U.S. and Canada hit 92.2%. Revenue from membership fees climbed 10.7%.

Costco has relied on pricing as a tool to maintain strong customer loyalty. “We’ve widened our gaps in terms of price,” said CFO Gary Millerchip in May. Zacks strategist Bryan Hayes described this move as “classic Costco,” but also noted the potential for short-term margin challenges. Reuters

The company’s lengthy track record helps justify investor patience. Costco shares climbed 459.6% over the past decade through July 17, compared with a 244.7% gain for the S&P 500 in the same timeframe. However, the stock’s current price-to-earnings ratio is 34% higher than Costco’s 10-year median of 37.

Valuation models show a wide divergence. GuruFocus calculates $421.23 based on earnings and $559.77 based on free cash flow. Tuesday’s price stands 76% to 134% higher than these model values. These figures are model projections, not consensus forecasts. The publisher also highlights low predictability and the impact of changes to discount rates.

The most recent analyst poll showed a less negative outlook, recording 24 Buy or Overweight recommendations and 17 lower ratings. The consensus stayed at Overweight, and the median price target was $1,100. This suggests an approximate 12% potential gain from Tuesday’s closing price.

Costco operated 933 warehouses as of early July. The company aims to open over 30 net new locations each year in the years ahead. For fiscal 2026, guidance was trimmed to 26 due to delays affecting some projects. Fourth-quarter earnings are set to be released on September 24.

Risks: A slowdown in traffic, pressure on food margins, fluctuations in fuel prices and currency shifts may limit earnings. Rising interest rates may further squeeze Costco’s premium valuation multiple.

Tuesday’s rally is primarily driven by shifts in portfolio allocation rather than fresh data on Costco. The September report will be key to demonstrate if earnings are catching up to the current valuation.

TS2 TECH • EXTENDED COVERAGE

Further analysis

Why is Costco stock jumping today?
At 14:45 UTC Tuesday, Costco traded at $985.42, gaining 3.56%. The consumer-staples ETF XLP was up 3.85% around the same time. Costco’s latest official operating release remains its July 8 sales update. Today’s rise therefore appears sector-led, though no single catalyst is confirmed. The move remains intraday and can reverse before Tuesday’s close.
How close is COST to its 52-week high?
At $985.42, shares were 10.1% below the $1,096.50 52-week high. They stood 16.7% above the $844.06 52-week low. MarketWatch showed five-day gains of 5.9% and year-to-date gains of 14.1%. The three-month return remained about 1.0% negative, so recovery is incomplete.
What is the next scheduled catalyst?
Costco will report July sales on August 5 at 1:15 p.m. Pacific. Investors will compare adjusted total comps with June’s 7.0% pace. The U.S. adjusted comp was 7.6%, while digital reached 21.5%. May’s adjusted total comp was stronger at 8.0%. The key question is whether June’s slowdown continued or stabilized. Fiscal fourth-quarter earnings follow on September 24.
Did June sales really weaken?
June net sales rose 10.6% year over year to $29.24 billion. Headline comparable sales increased 8.8%, while adjusted comps rose 7.0%. Digitally enabled adjusted comps grew 21.5%, maintaining strong online momentum. Forty-four-week net sales reached $250.43 billion, up 10.1% from last year. The slowdown from May helps explain sensitivity around Costco’s premium valuation.
How strong were Costco’s latest quarterly results?
Fiscal third-quarter net sales rose 11.6% year over year to $69.15 billion. Quarterly net income increased to $2.19 billion from $1.90 billion. Diluted EPS climbed to $4.93 from $4.28, an increase near 15%. Adjusted company comps grew 6.6%, while digital comps gained 20.8%. Operating income reached $2.82 billion, up from $2.53 billion.
What drove third-quarter sales growth?
Costco said comparable sales benefited from roughly 7% higher average ticket. Shopping frequency increased approximately 2% from the prior-year quarter. Gasoline volume rose 10%, while average fuel prices increased 20%. Higher gasoline prices alone added 221 basis points to quarterly net sales. Foreign exchange added another 104 basis points.
Are membership trends still healthy?
Third-quarter membership fee revenue increased 11% year over year to $1.373 billion. Paid memberships reached 82.9 million, up from 79.6 million one year earlier. Total cardholders climbed to 148.5 million from 142.8 million. Renewal rates were 92.2% in the U.S. and Canada, and 89.7% worldwide. Costco said lower-renewing online promotions created modest pressure on those rates.
Are margins holding under pricing pressure?
Reported gross margin fell 21 basis points year over year to 11.04%. Excluding gasoline-price inflation, margin rose one basis point to 11.26%. Core merchandise reduced margin by 29 basis points during the quarter. Pharmacy, e-commerce and a smaller LIFO charge partly offset that pressure. SG&A declined 20 basis points, reaching 8.96% of net sales.
How demanding is Costco’s valuation now?
At $985.42, Costco’s equity market value was approximately $437.8 billion. The shares traded near 49.5 times trailing earnings of $19.88 per share. Third-quarter EPS still grew roughly 15% from the prior-year quarter. That growth is strong, but the valuation leaves little room for misses. The regular dividend totals $5.88 annually, yielding only about 0.60%.
Mateusz Kaczmarek

Mateusz Kaczmarek is a financial and technology journalist at TS2.tech. His coverage ranges from stocks and artificial intelligence to semiconductors and developments across global markets. He graduated from the Poznań University of Economics and Business and worked in financial analysis before becoming a business journalist. Follow Mateusz Kaczmarek on Google News.

AI PORTFOLIO

Top Stock Picks

Today’s highest-ranked model selections.

#1 Buy

Alphabet

Alphabet (NASDAQ:GOOGL) 92/100 ★★★★★
#2 Buy

Amazon

Amazon (NASDAQ:AMZN) 90/100 ★★★★★
#3 Accumulate

NVIDIA

Nvidia (NASDAQ:NVDA) 89/100 ★★★★½
#4 Accumulate

Microsoft

Microsoft (NASDAQ:MSFT) 86/100 ★★★★☆
#5 Selective buy

Meta Platforms

Meta Platforms (NASDAQ:META) 84/100 ★★★★☆
View full portfolio
Editorial model selection. Not personalised advice.
MARKET CALENDAR

Key Events Today

The catalysts most likely to move markets.

#1

Empire State Manufacturing

A figure above or below the 12.0 consensus could impact Treasury yields, the dollar, and cyclical stocks by influencing short-term growth outlooks.

#2

NAHB Housing Sentiment

A reading above or below 33 will influence expectations for housing demand, mortgage rate trends, and homebuilder stocks.

#3

Fabrinet After the Close

Investors are focusing on revenue, margins, and comments on datacom as key factors for companies involved in optical networking and AI infrastructure supply chains.

View full calendar
Times and estimates may change. Verify before trading.
S&P Global shares fall 5% as ratings and index businesses account for 77% of growth following spin-off
Previous Story

S&P Global shares fall 5% as ratings and index businesses account for 77% of growth following spin-off

IKEA Experiments With Compact Store Format in Cleveland Amid Growing Digital Sales
Next Story

IKEA Experiments With Compact Store Format in Cleveland Amid Growing Digital Sales