
New York, August 3, 2026, 12:15 (EDT)
- Costco was trading around $951 at midday, putting its valuation close to $422.8 billion.
- To reach a $1 trillion valuation, an increase of 136.5% from that point is needed.
- Costco is set to report July sales on Wednesday after posting a 7.0% increase in adjusted comparable sales for June.
Costco Wholesale NASDAQ:COST traded almost unchanged at midday Monday, with U.S. markets in session. The company’s market capitalisation hovered near $423 billion, putting it $577 billion short of the $1 trillion mark.
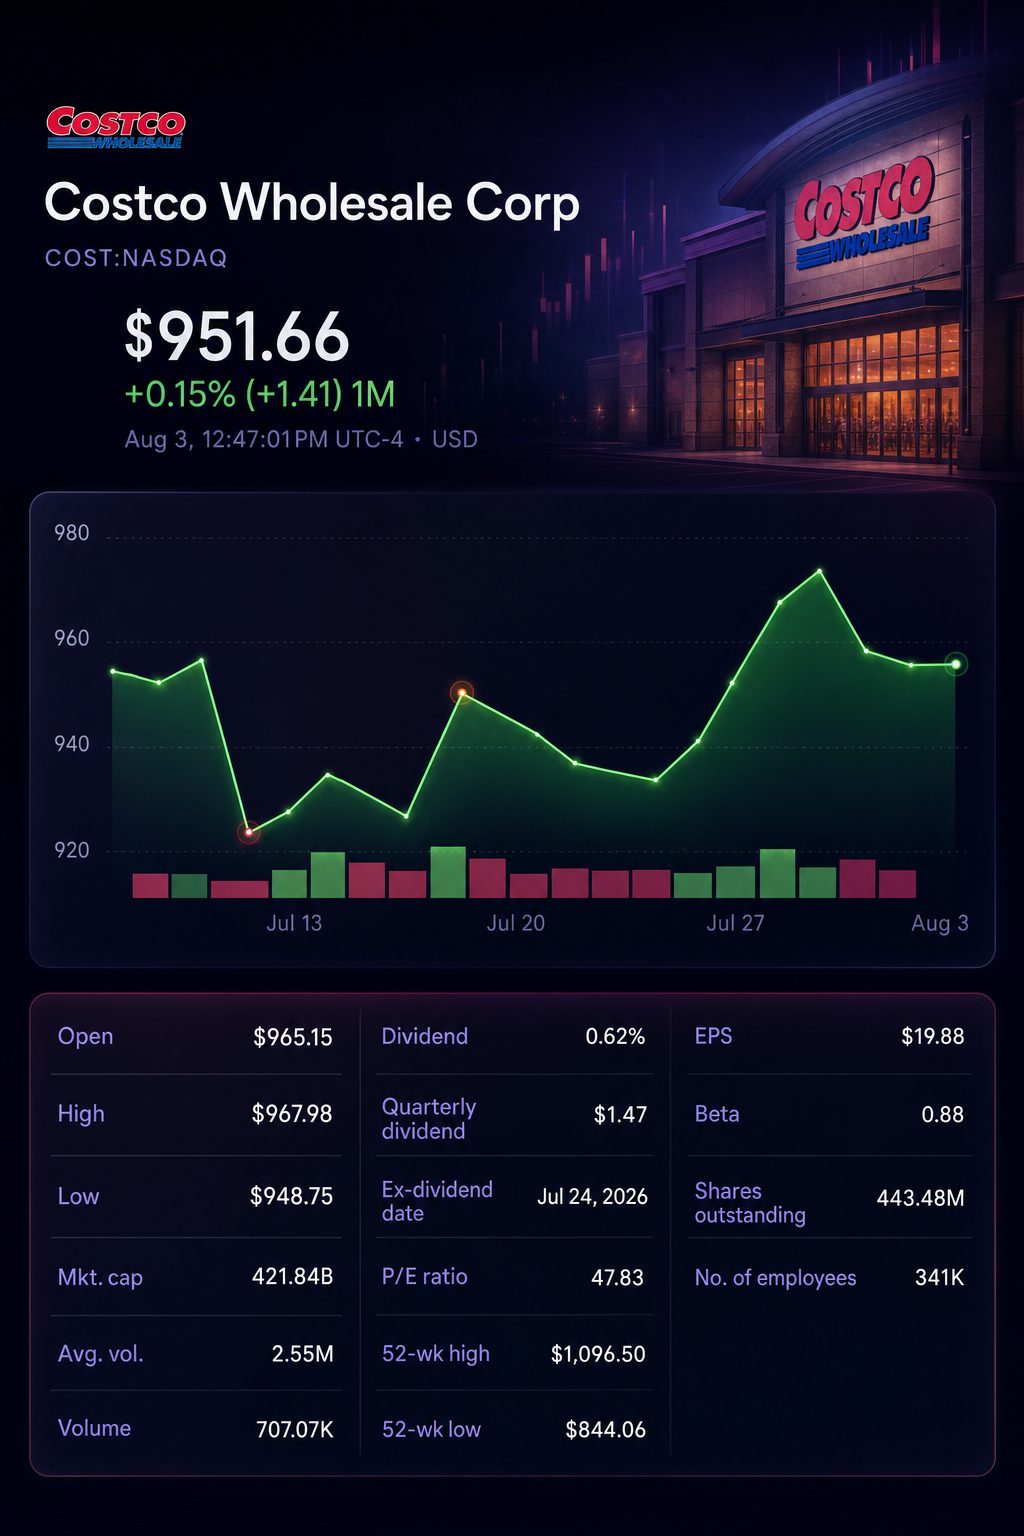
The trajectory chiefly relies on valuation. With 444.43 million diluted shares outstanding, a $1 trillion valuation translates into approximately $2,250 per share. This implies, at a price-to-earnings ratio of 47.9, that yearly EPS would need to reach around $47.0. The most recent trailing EPS stands at $19.88.
An initial projection with 10% yearly EPS growth achieves that milestone within nine years. This aligns with the current trillion-dollar argument. However, the timeline extends significantly should Costco’s multiple decrease.
Walmart Inc. NASDAQ:WMT currently has a price-to-earnings ratio of 38.8. BJ’s Wholesale Club Holdings, Inc. NYSE:BJ is valued at 22.5 times earnings. Costco’s premium is 23% greater than Walmart’s and stands 113% higher than BJ’s.
| Company | Share price | Market value | Trailing P/E | Monday move |
|---|---|---|---|---|
| Costco | $951.28 | $422.8 billion | 47.9x | down 0.1% |
| Walmart | $110.45 | $883.5 billion | 38.8x | fell 0.7% |
| BJ’s Wholesale | $97.69 | $12.6 billion | 22.5x | off 0.1% |
Data on prices and valuations was collected at midday in New York.
Walmart briefly surpassed the $1 trillion mark in February before retreating below that level, with its market capitalisation now around $883 billion. The milestone may not last. Costco still requires consistent profits and sustained valuation.
Over the past ten years, Costco stock advanced 459.6% as of July 17. The price-to-earnings ratio climbed from 37 to 47. Initial estimates indicate earnings per share rose around 341%, averaging close to 16% per year.
| Ten-year component | Change |
|---|---|
| Increase in share price | 459.6% |
| P/E ratio | 37x to 47x |
| Initial indicated EPS growth | 340.5% |
| Initial indicated EPS CAGR | 16.0% |
Valuation multiple growth pushed the closing price roughly 27% higher than if it had maintained a steady 37-times trajectory. The underlying numbers were approximated.
Nasdaq, Inc. NASDAQ:NDAQ characterized Costco as functioning “more like a subscription business than a retailer.” In a July report, Nasdaq highlighted renewal rates over 90%. According to its analysis, membership fees account for about three-quarters of the company’s operating income. Nasdaq
The figure is based on analysis rather than disclosed segment data. Costco recorded $4.06 billion from membership fees over 36 weeks, with operating income at $7.88 billion. This puts fee revenue at 51.5% of operating income before accounting for costs.
Operations remain strong. Net sales for June climbed 10.6%. Adjusted comparable sales for the company reached 7.0%, up from 6.6% in the fiscal third quarter. Adjusted digital sales rose as well.
| Operating measure | Fiscal Q3 2026 | June retail month |
|---|---|---|
| Net sales rose | 11.6% | 10.6% |
| Company same-store sales, reported | 9.8% | 8.8% |
| Company same-store sales, adjusted | 6.6% | 7.0% |
| Digital same-store sales, adjusted | 20.8% | 21.5% |
| Difference, reported minus adjusted | 3.2 points | 1.8 points |
The spread highlights the impact of both currency movements and gasoline prices on the growth figures reported.
Chief Financial Officer Gary Millerchip stated gas prices “had a major impact on the quarter.” Growth in comparable sales reported for June lost momentum while the adjusted figure saw gains. The combination indicates stable core demand. Fortune
In July, Bernstein analyst Zhihan Ma stated: “We expect Costco to generate about 6-7% comparable sales growth, excluding gas and foreign exchange.” June’s performance reached the upper end of that estimate. TheStreet
The timeline to reach a trillion-dollar valuation varies significantly based on different multiples. This initial projection calculates with 444.43 million shares in mind and factors in an annual EPS growth rate of 10% from a starting point of $19.88.
| Valuation benchmark | Assumed terminal P/E | EPS needed at $1 trillion | Years at 10% EPS growth |
|---|---|---|---|
| Present Costco ratio | 47.9x | $47.0 | 9.0 |
| Present Walmart ratio | 38.8x | $58.1 | 11.2 |
| Costco’s median over 10 years | 37.0x | $60.8 | 11.7 |
| Current BJ’s ratio | 22.5x | $100.2 | 17.0 |
The calculations reflect Monday’s market numbers, the most recent diluted share count for Costco, and the company’s stated 10-year median valuation.
Costco is set to announce its July sales figures on Wednesday, August 5, at 1:15 p.m. PT. Market participants are focused on adjusted comparable sales and online expansion. If results land under the 6%-7% band, it could challenge current valuation premiums.
Risks: Delays in renewals, rising commodity prices, and reduced consumer spending may impact EPS growth. Expanding abroad introduces execution challenges. A contraction in multiples could prolong the path to the $1 trillion target.
Costco has the potential to hit $1 trillion without altering its business approach. However, future gains will need to rely more heavily on profits. The next assessment comes on Wednesday.
Related articles: NASDAQ:COST