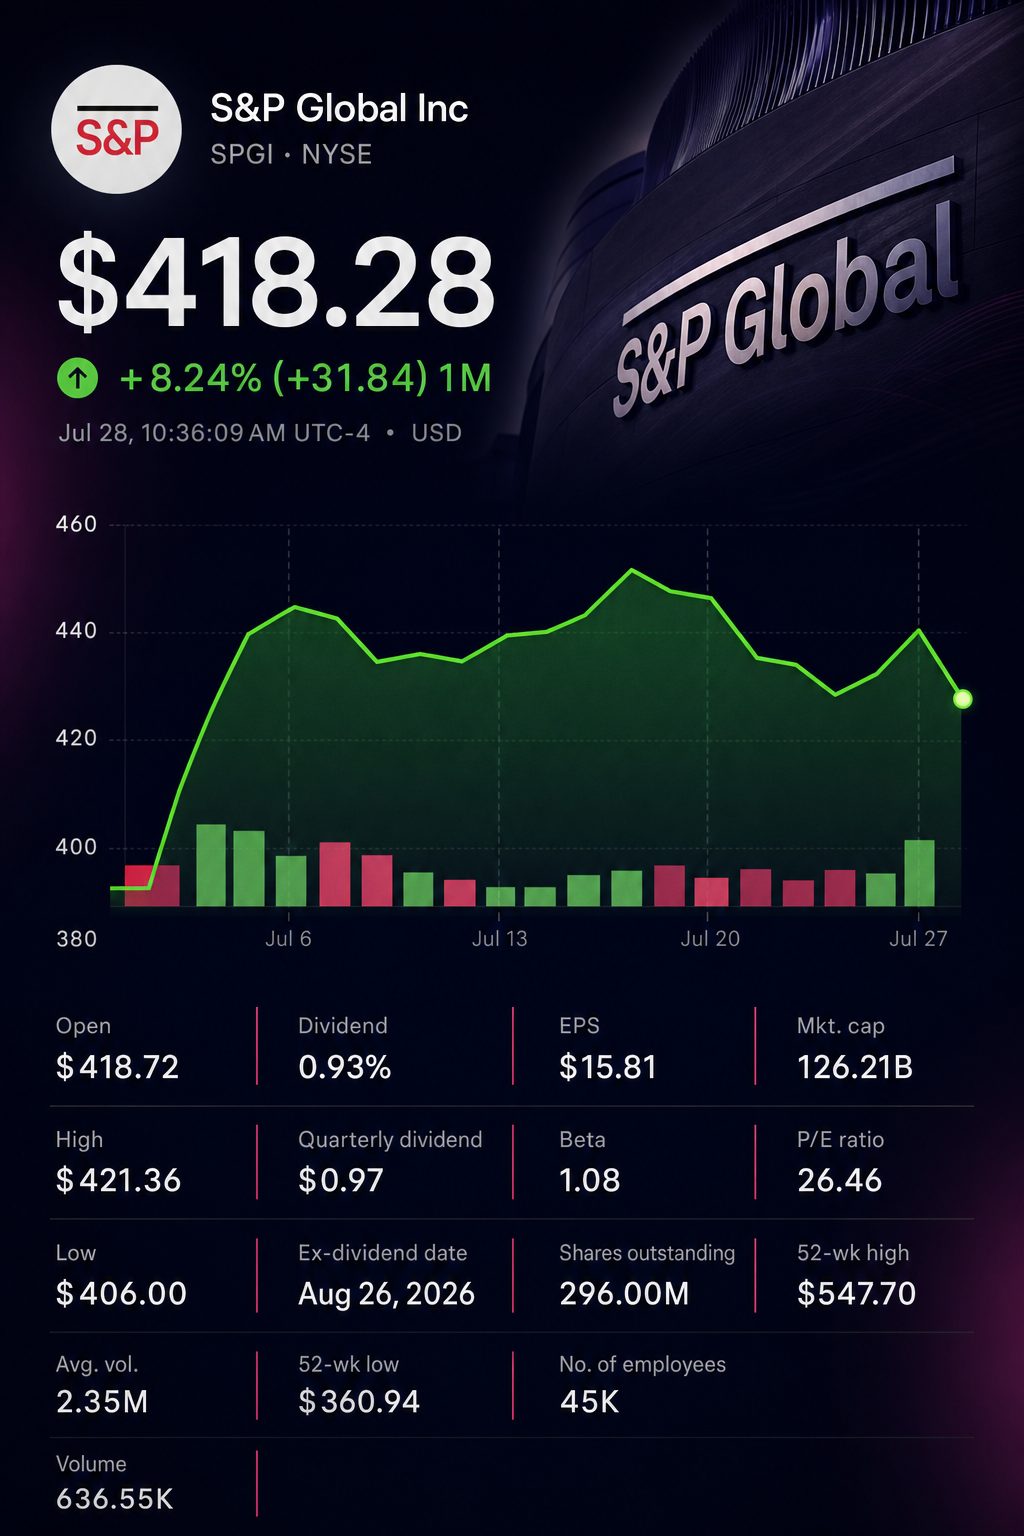
NEW YORK, July 28, 2026, 10:08 EDT — U.S. markets open with S&P Global stock down 5% after its ratings and indices segments contributed 77% of growth in the wake of its spin-off.
S&P Global Inc. NYSE:SPGI shares dropped 5.1% to $417.38 during morning trading. Delayed data indicated the stock touched an intraday low of $408.05.
The decline came after robust headline gains. Adjusted earnings climbed 23% to $4.83 per share. Reported revenue advanced 10% to $4.146 billion.
Initial consensus data indicated adjusted earnings expectations ranging from $4.95 to $5.02. Revenue consensus from one source stood at $4.11 billion, which was less than the actual reported amount.
Comparisons are complicated. Mobility Global (NYSE:MBGL) spun off on July 1. S&P Global’s revised guidance and pro forma numbers no longer include this unit.
The main issue lies within the composition. Ratings and Indices accounted for $279 million out of the $361 million rise in pro forma revenue, representing 77%, according to company figures.
Division
Q2 revenue
Year-on-year growth
Adjusted operating margin
Ratings
$1.339 billion
17%
68%
Indices
$534 million
20%
72%
Market Intelligence
$1.235 billion
6%
36%
Energy
$623 million
3%
48%
Data are presented on a pro forma basis or have been restated when relevant.
Out of the $286 million rise in adjusted operating profit across all four divisions, the same two accounted for $234 million, or 82%.
Ratings were the main driver for the quarter. Transaction revenue increased by 25% to $746 million, while nontransaction revenue climbed 8%.
Indexes tracked. Fees connected to assets increased by 22% to reach $348 million. Royalties from sales usage were also up 22%.
Market Intelligence contributed around one-third of the pro forma revenue, reporting 6% growth, slower than the benchmark segments. Energy segment growth was 3%.
The peer tape signals a reaction tied to individual companies. Shares of Moody’s Corp. NYSE:MCO fell 0.8%, as MSCI Inc. NYSE:MSCI gained 0.5%. S&P Global lagged behind the two.
Chief Executive Martina Cheung said, “Post spin, we have a sharper focus on our four core divisions.” She also highlighted record performances in Ratings and Indices. Securities and Exchange Commission
Revenue for the full year is projected to increase between 5.9% and 7.9%. Adjusted earnings per share are expected to range from $17.50 to $17.75. Management noted that the outlook cannot be directly compared with previous guidance.
Capital distributions are still significant. S&P Global projects buybacks for 2026 to surpass $7 billion. Based on Tuesday’s share price, that figure represents over 5.6% of the company’s present market capitalization.
The company has also consented to acquire datacenterHawk along with a controlling stake in Agusto & Co. The terms were not revealed. Both transactions are anticipated to complete in the latter half, pending necessary approvals. The company does not foresee a material impact on its results from either deal.
Risks continue to be clustered. Ratings and Indices remain influenced primarily by debt issuance and equity market activity. Increased competition in AI and customers reducing spending may impact data pricing. The Mobility separation introduces additional execution risk.
The following challenge is achieving balance. Accelerated growth in Market Intelligence could lessen dependence on issuance and asset-based fees. However, Tuesday’s results did not reflect this shift.
What is causing S&P Global shares to decline even with robust growth in the second quarter?
SPGI shares were down about 5.2% at around $417 early Tuesday. Moody’s slipped approximately 0.7%, while MSCI edged up by about 0.5%. S&P Global posted a 10% increase in revenue and 23% adjusted EPS growth. The move points to issue-specific pressures rather than a sector-wide decline. Focus remains on post-spin guidance and mixed results versus consensus, but the cause is still unclear.
Did the quarter surpass Wall Street forecasts?
Revenue reported was approximately $4.15 billion, up 10% from the same period a year earlier. Analyst estimates had projected revenue at around $4.11 billion, indicating a slight beat. Adjusted EPS came in at $4.83, showing a 23% increase over last year. Published EPS forecasts varied between $4.81 and roughly $5.02, so the result was a marginal beat or miss, depending on the estimate source.
What is the significance of the 2026 EPS guidance appearing lower for investors?
Updated adjusted EPS guidance stands at $17.50 to $17.75, indicating growth of 10%–12%. The previous range of $19.40 to $19.65 had factored in Mobility for the entire year. Mobility was spun off as a separate company on July 1. According to management, the revised outlook for continuing operations cannot be directly compared. The goal for organic constant-currency revenue growth remains at 6%–8%. Adjusted margin expansion guidance is set at 35–60 basis points.
Which segments contributed to the quarter's expansion?
Ratings revenue climbed 17% to $1.339 billion, achieving a margin of 68.5%. Indices revenue advanced 20% to $534 million, with a margin of 71.5%. Market Intelligence was up 6% to $1.235 billion, with a margin of 36.0%. Energy gained just 3% to $623 million, despite a slight improvement in margin. Ratings and Indices were the standout performers for the quarter.
Will the Ratings upswing persist until the end of the year?
Revenue from ratings transactions climbed 25%, and non-transaction revenue was up 8%. Issuance billed in the second quarter rose 25% to $1.268 trillion. Investment-grade issuance increased 25%, and high-yield issuance advanced 15%. Billed issuance tied to hyperscalers totaled $169 billion in the first half. Management projects full-year issuance growth in the mid-to-high single digits, pointing to tougher comparisons. Key variables remain rates, spreads, and potential geopolitical shocks.
To what extent does the Indices business depend on market levels?
Indices revenue climbed 20%, driven by higher asset-linked and derivatives fees. ETF-linked assets totaled $6.35 trillion, representing a 34% increase from a year earlier. Average daily volume for exchange-traded derivatives rose 19% for the quarter. Management projects equity appreciation and derivatives-volume growth both in the low teens in 2026. A market downturn would squeeze asset-based fee income and trading royalty revenues.
Does artificial intelligence pose a benefit or a risk to Market Intelligence?
Market Intelligence posted a 6% revenue rise, with adjusted margins up by 120 basis points. Annual contract value for AI clients climbed at a rate 1.6 times greater than that of non-AI clients. Over 500 customers engaged with or trialed the LLM-ready API. API call volume was up 5.4 times from the first quarter. However, customers continue to monitor token expenses and explore developing internal tools. While the signs are positive, the case is not definitive.
Are the two disclosed acquisitions expected to significantly impact earnings?
Completion of both deals is anticipated in the second half of 2026. Financial terms were not revealed. Neither transaction is projected to have a significant short-term effect. datacenterHawk will provide asset-level insights across data center, fiber, and power sectors. Agusto extends ratings coverage in Africa, with operations in Nigeria, Kenya, Rwanda, and Ghana, and has assigned over 4,000 ratings since starting. The strategic benefit is seen as potentially outweighing any immediate financial gain.
Can buybacks and valuation offer significant protection against downside risk?
S&P Global projects share repurchases exceeding $7 billion for 2026, with $1.5 billion already bought back as of the second-quarter update. Given a market capitalization of $124 billion, total buybacks would represent about 5.6%. Based on the midpoint of guidance, shares are valued at roughly 23.7 times adjusted earnings. The annualized dividend of $3.88 reflects a yield of just 0.9% at a $417 share price. While buybacks are significant, the current valuation depends on sustained growth.
Jerzy Lewandowski is a senior markets editor at TS2.tech. His coverage ranges from stocks and semiconductors to AI and the broader global markets. He studied economics at the University of Warsaw and worked in investment analysis before becoming a financial journalist. Follow Jerzy Lewandowski on Google News.
A figure above or below the 12.0 consensus could impact Treasury yields, the dollar, and cyclical stocks by influencing short-term growth outlooks.
#2
NAHB Housing Sentiment
A reading above or below 33 will influence expectations for housing demand, mortgage rate trends, and homebuilder stocks.
#3
Fabrinet After the Close
Investors are focusing on revenue, margins, and comments on datacom as key factors for companies involved in optical networking and AI infrastructure supply chains.