- Share Price (Oct 16, 2025): ~$4.89 (close) Investing. SPCE has climbed off its recent lows (it was ~$3.42 on Oct 1 ts2.tech) but remains below early‐2024 peaks. Year‐to‐date 2025 return is roughly –33% 1 .
- Market Metrics: 52‑week range ~$2.18–$8.19 ts2.tech. Market cap on the order of $200–$240M (Benzinga: $235.6M Benzinga). Trailing P/S >60× due to negligible revenue Benzinga. SPCE is highly volatile (beta ~2.2).
- Financials (Q2 2025): Revenue ~$0.4M, net loss $67.3M (–$1.47/share) ts2.tech (EPS better than the prior year loss). Free cash flow deeply negative (–$114M) ts2.tech. By end‑June 2025 the company held ~$508M in cash ts2.tech Edgen. Cash burn is ~$100–125M per quarter ts2.tech Edgen, implying roughly 18 months of runway at current spend. Next earnings report is due Nov 5, 2025 2 .
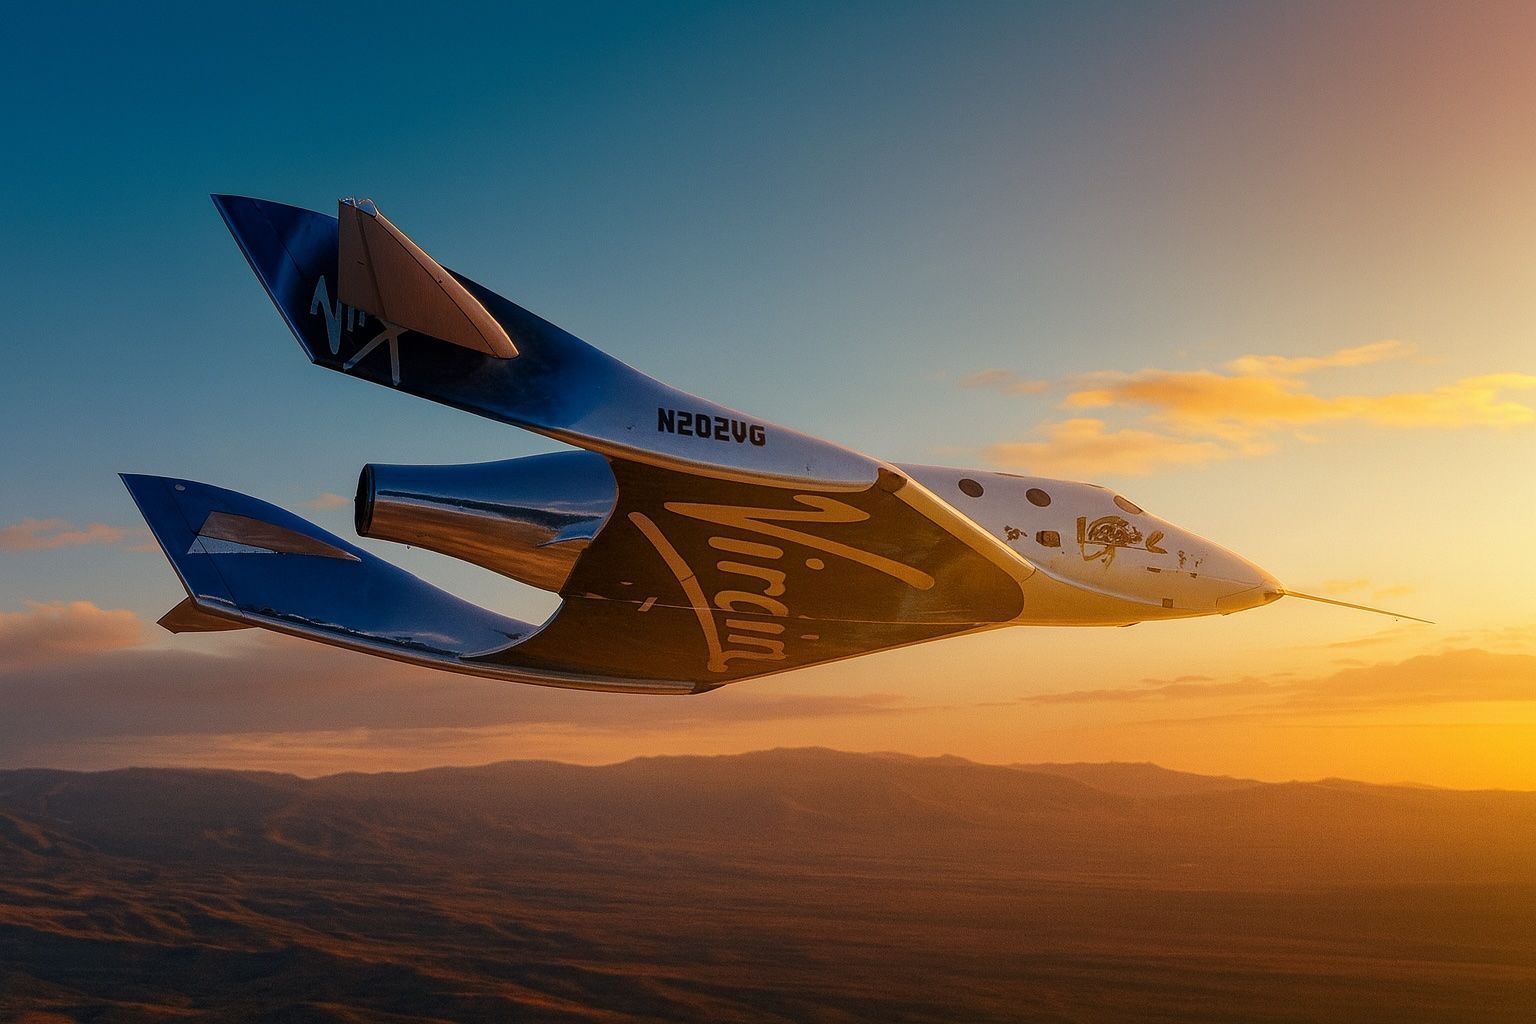
- Recent Corporate News: VG settled a long‑running shareholder class action (resolving engineering and accounting disclosure claims) in mid‑September, “removing a ‘headline risk’” and clearing a cloud over management Edgen. Around the same time the board updated its bylaws. VG also announced a collaboration with Purdue University for a 2027 suborbital research mission (“Purdue‑1”) featuring an all‑Purdue crew Edgen. VG continues to develop its next‑gen “Delta Class” spaceplanes aiming for commercial service by late 2026 ts2.tech (though timelines have slipped before).
- Analyst Consensus: Most Wall Street firms rate SPCE Neutral/Hold. Susquehanna (Oct 9) maintains a Neutral rating with a 1‑year target of ~$4.00 (range $2.02–$8.40) Nasdaq. MarketBeat reports an average target ~$5.00 Marketbeat (with 1 sell, 2 holds, 1 buy). Benzinga notes a wide span: highest target $36 (Goldman) vs $0.75 (Wells Fargo), average ~$6.67 Benzinga. Recent cuts include Bernstein ($3→$2) and Morgan Stanley ($5→$2.50) 3 .
- Investor Sentiment: SPCE has attracted social‐media buzz. After a late‑Sept rally (14% one‐day jump ts2.tech), the stock was “trending on social media” ts2.tech. Short interest is very high (~20–28% of float ts2.tech Finimize), meaning any positive news can trigger sharp moves. Finimize notes SPCE is now ~22% above its 50‑day average, yet ~27.9% of shares are sold short, “indicating no shortage of skeptics” Finimize. Put/Call ratios (~0.83) suggest a slightly bullish tilt.
Stock Performance & Financials
Virgin Galactic’s share price has been in a prolonged slump, though recent news has sparked a bounce. On Oct. 1, 2025 SPCE closed at $3.42 ts2.tech; by Oct. 16 it had rallied to about $4.89 Investing (and was up ~6.3% on the day). The stock traded in a rough range of $3.30–$3.70 through early Oct ts2.tech. Over 2025 the stock is still down roughly one-third (Benzinga reports –33% YTD Benzinga; TS2.Tech data shows ~–42% YTD through Sept ts2.tech), well underperforming the S&P500. SPCE remains extremely volatile (5‑year drawdown ~99% 4 ).
Financially, Virgin Galactic remains pre‑revenue. Q2 2025 results (ended June 30) showed just $406K in sales and a $67.3M net loss (–$1.47/share) ts2.tech. The loss per share was narrower than Wall Street feared; MarketBeat notes VG “reported an EPS of ($1.47)… outperforming analysts’ expectations” Marketbeat, although revenue fell short of forecasts. Capital expenditures rose ($58M) as VG invests in its Delta‑class fleet ts2.tech. Free cash flow was highly negative (–$114M in Q2 ts2.tech) but operating expenses are down ~34% from a year ago Edgen. Cash reserves were ~$508M at quarter’s end ts2.tech Edgen, bolstered by a $56M equity raise. With ~100–125M spent per quarter ts2.tech Edgen, management projects ~18 months of runway absent new funding. Management still targets a Delta‑class launch by late 2026 (sales model with two ships ~125 flights/yr at $600K/seat ⇒ ~$450M/yr revenue Edgen), but admits the timeline has repeatedly slipped 5 .
Recent News & Corporate Updates
Two major developments this week dominated headlines. Lawsuit Settlement: In mid‑Sept VG finalized a settlement of a shareholder class action (related to alleged non‑disclosure of spacecraft flaws). The deal (roughly $2.9M paid, largely insured) removes a long‑running overhang. As one commentator noted, the settlement “is seen as removing a ‘headline risk,’ potentially improving investor sentiment” Edgen. The class covers SPCE buyers from Jul 2019–Aug 2022. Management and analysts view this positively (it enhances credibility) but caution that it doesn’t change VG’s cash burn or timeline risk Edgen 6 .
Purdue Partnership: Also this week VG announced a collaboration with Purdue University on an all‑Purdue research flight (“Purdue‑1”). A Purdue engineering professor, grad student and alumni will fly on VG’s suborbital vehicle in 2027 to conduct microgravity experiments. Purdue’s press release emphasizes the mission “will be a global event” (first all‑university crew) and notes researchers will study fluid behavior in zero‑g Purdue. Virgin Galactic’s President Mike Moses hailed the announcement: “this mission…is a powerful demonstration of what becomes possible when research institutions gain direct access to the microgravity environment” ts2.tech. In other news, VG published Q2 results on Aug. 14 showing the above figures, and has begun granting inducement RSUs (e.g. 11,019 shares) to attract talent ts2.tech. Regulatory issues (FAA oversight) and competition continue, but these announcements gave a positive boost.
Analyst Ratings & Price Forecasts
Wall Street remains split on SPCE. The consensus rating is Hold/Neutral. Fintel/Nasdaq reports (Oct 9) that Susquehanna’s neutral view corresponds to a ~$4.00 one‑year target Nasdaq. MarketBeat (Oct 10) similarly notes an average Hold rating (1 Sell, 2 Hold, 1 Buy) with a mean 12‑month target of $5.00 Marketbeat. Bernstein, however, remains bearish (Underperform; target cut from $3 to $2) after Q2, citing cash burn and delays ts2.tech. Morgan Stanley also cut its target to $2.50 (Underweight) ts2.tech. By contrast, Bullish analysts point to a 750‑passenger backlog and low price/book.
Price targets vary wildly. According to Benzinga, the range spans ~$0.75 (bearish Wells Fargo forecast) up to $36 (golden‑skyline!). (This reflects a highly uncertain bet on space tourism’s success Benzinga.) More recently, TS2.Tech finds Street targets averaging ~$4.08 ts2.tech, implying only modest upside. In short, most analysts see limited near‑term gains. As TS2.Tech summarizes: Wall Street “remains cautious. Bernstein … slashed [its target] to $2.00 (Underperform)…Morgan Stanley…to $2.50… overall consensus is Neutral/Hold with an average target around $4” 3 .
Investor Sentiment & Outlook
Investor sentiment is mixed and volatile. The late‑Sept rally (SPCE jumped ~14% on Sept 23 ts2.tech) was fueled by speculative buzz and the news above. TS2.Tech notes that by midday Sept 23, SPCE was “trending on social media and financial forums as one of the market’s top gainers” ts2.tech. This social momentum – and a short‑squeeze dynamic – helped lift the stock. Indeed, SPCE briefly broke above key technical levels on heavy volume, suggesting short sellers (about 20–28% of float ts2.tech Finimize) may have been covering.
However, skepticism remains high. Finimize reports SPCE trading ~22% above its 50‑day moving average, but warns that “short interest [is] sitting at roughly 27.9% of shares, indicat[ing] no shortage of skeptics betting on setbacks” Finimize. The company’s high beta (~2.2) means any market swoon or further bad news could send SPCE reeling again. Put/call ratios (~0.83) on SPCE are mildly bullish Nasdaq, but surveys of funds show many exiting positions recently Nasdaq. In sum, traders view SPCE as a speculative play – some hoping for a breakout to the next catalyst, while others brace for more dilution or delays.
Forecast & Investor Takeaway
Short‑term: With SPCE’s recent run, technical traders are watching for continuation or reversal. The next catalyst is Q3 earnings (early Nov). Given persistent losses, expect choppy trading. If the stock can hold above ~$4, momentum may persist; otherwise, profit‑taking could set in. Large short positions mean volatility is likely – any spark (good or bad) could cause a big move.
Long‑term: Virgin Galactic’s outlook depends on execution of its Delta-class program. Analysts’ forecasts hinge on achieving 2026 commercial flights. If successful, management projects ramping to ~$450M annual revenue with two ships (125 flights/year at $600K/seat) Edgen, rising to ~$1B with fleet expansion. However, substantial risks persist: VG has burned nearly $2B to date with little revenue, and future cash raises (up to $300M more Edgen) may dilute shareholders. Regulatory hurdles (FAA licensing) and competition from Blue Origin/SpaceX add uncertainty ts2.tech. As one analyst bluntly notes, VG’s path is still “a severe cash burn and uncertain path to profitability” 7 .
For patient investors, SPCE remains a binary bet on space tourism. Upside is tied to a booming space tourism market; downside is a prolonged drawdown if flights slip. As of Oct 2025, experts are divided: some believe SPCE is undervalued given its assets, while others see valuations (EV/Sales ~14x Finimize) that assume near‑miracle growth. The wide range of fair‐value estimates (from ~$0.60 to >$100) ts2.tech highlights this split. In any case, the recent lawsuit settlement and Purdue deal have bought VG some credibility. As Edgen.tech summarizes, VG has “taken steps to stabilize its outlook” Edgen – but investors will watch closely whether those steps translate into profitable takeoff.
Sources: Company filings and press releases; TS2.Tech analysis ts2.tech ts2.tech; Benzinga, MarketBeat, Nasdaq/Fintel reports Benzinga Nasdaq Marketbeat; Edgen.tech Edgen Edgen; Finimize report Finimize; Investing.com, Yahoo Finance historical data Investing ts2.tech; Market and social media commentary. (All figures and quotes are as of Oct 16, 2025.)
