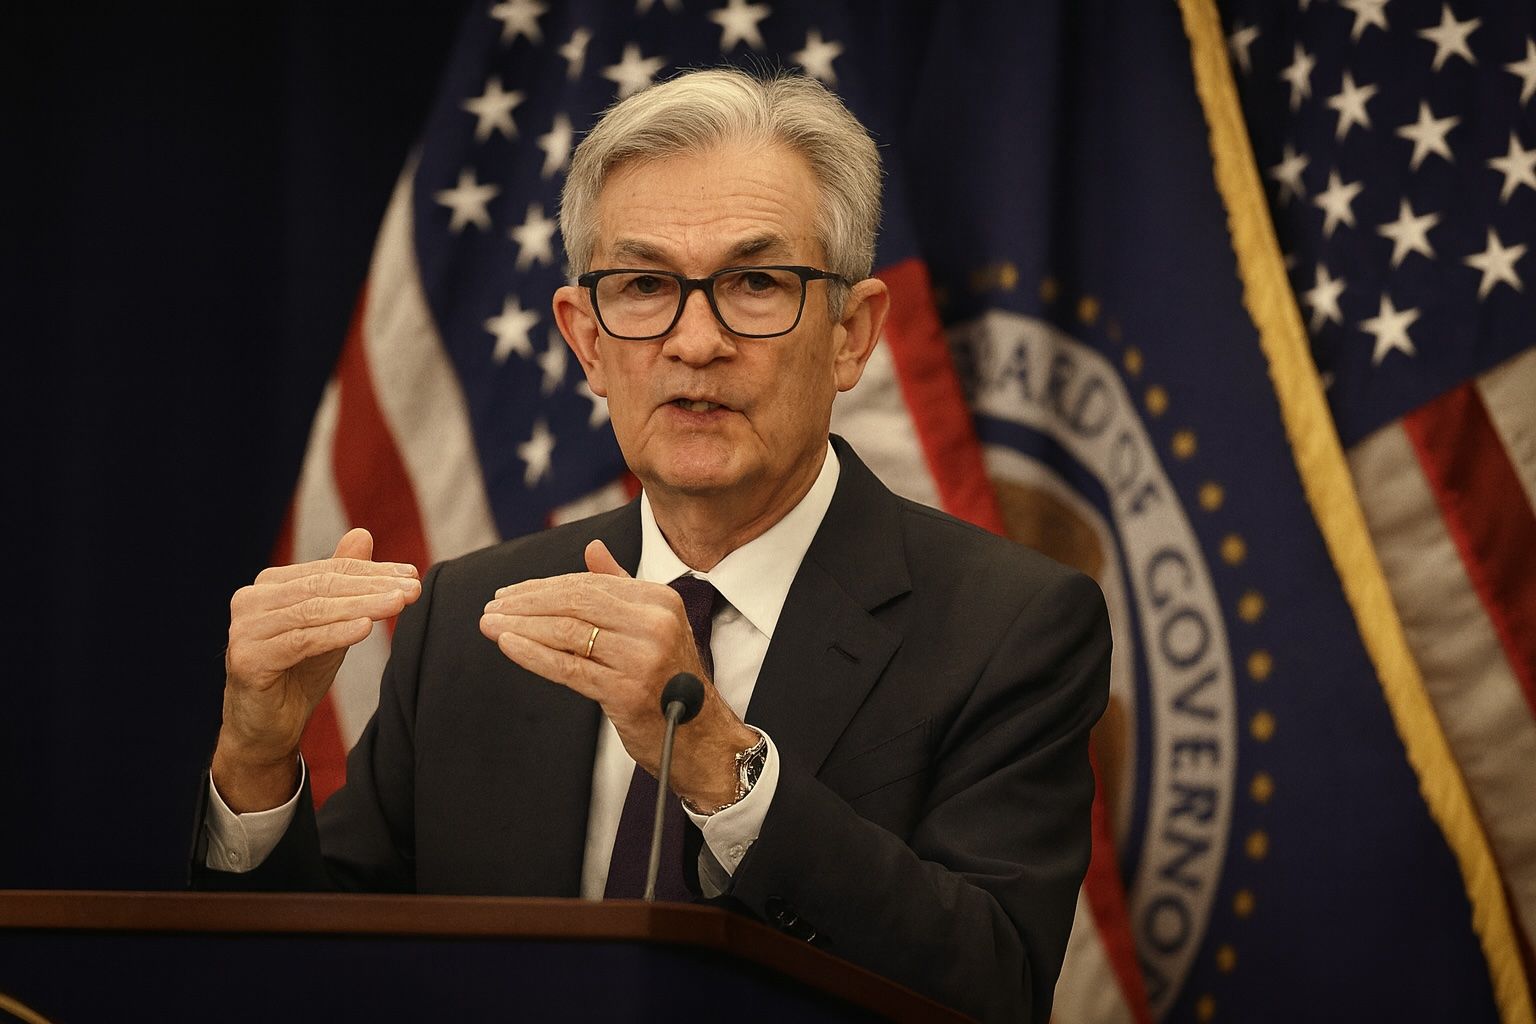
- Fed policy shift: The Federal Reserve cut its benchmark rate by 25 basis points in mid-September and now “continues to see two more cuts before the end of this year,” Fed Governor Michelle Bowman confirmedreuters.com. Markets are pricing in quarter-point cuts at the Fed’s October and December meetings.
- Mortgage rates stuck: Yet 30‑year mortgage rates remain stubbornly high – around 6.2% for conforming fixed loansthedailyeconomy.orgreuters.com – roughly the same or higher than a year ago. Housing data show buyers holding off for lower rates: Redfin reports pending home sales fell 1.3% year-over-year in September and the “typical home sells in 48 days… the longest September span since 2019”1 .
- Long-term yields high: Experts blame massive Treasury supply. AIER economist Paul Mueller notes that surging federal debt (now ~$36 trillion) has pushed the 10-year Treasury yield up (around 4.0%) even as the Fed funds rate fellthedailyeconomy.orgthedailyeconomy.org. In his view, “only Congress can rein in the spending that keeps long-term yields — and mortgage rates — stubbornly high”2 .
- Stocks at records: Wall Street is booming on the flip side. The S&P 500 and Nasdaq touched all-time highs in early October (S&P at 6,753.72 on Oct. 8)ts2.tech. Major indices are up roughly 15–18% year-to-date, led by tech and AI-related namests2.techreuters.com. Bank shares jumped on strong earnings (Morgan Stanley +4.7%, Bank of America +4.4% on Oct. 15reuters.com) and chipmakers rallied on renewed AI optimism3 .
- Tech and AI boom: High-growth tech stocks are surging. For example, AMD soared ~6% on news that Oracle will deploy 50,000 of its AI GPUs, sending analysts to raise price targets (Wedbush to $270, HSBC to $310)ts2.tech. Nvidia, Oracle and others saw huge one-day gains amid an AI “megaspending” cyclets2.techreuters.com. This week TSMC raised its 2025 revenue outlook to “mid-30%” growth, with CEO C.C. Wei enthusing “AI demand actually continues to be very strong”reuters.com. A Microsoft/Nvidia/BlackRock consortium agreed to buy Aligned Data Centers for ~$40 billion, underscoring “early innings” of the AI infrastructure build-out4 .
- Forecasts & cautions: Many investors expect Fed easing and buoyant tech earnings to carry stocks higher. “The bulls remain fully in charge,” notes Rosenblatt’s Michael James, citing the market’s upbeat momentum after Powell’s dovish commentsts2.tech. However, some analysts warn of bubble risk. TSMC’s leaders and others have drawn parallels to the dot-com era as AI chip spending explodesreuters.comts2.tech. Meanwhile, economists stress inflation and deficits could keep pressure on long-term rates. As AIER’s Mueller puts it, Fed cuts alone can’t tame mortgage rates without fiscal restraint2 .
Fed Policy and Mortgage Rates
The Fed’s pivot to easier policy has not yet translated into cheaper mortgages. In September the Fed delivered its first rate cut of 2025 (bringing the federal funds target to 4.00–4.25%) and Fed officials like Governor Michelle Bowman signal more cuts are comingreuters.com. Futures markets now imply a roughly 95% chance of another 25 bp cut at the Oct. 28–29 meetingts2.tech. Despite this, the average 30-year fixed mortgage rate is holding around 6.2%, slightly higher than a year agothedailyeconomy.orgreuters.com. Economists like Paul Mueller explain why: mortgages track the 10-year Treasury yield, which isn’t falling because supply/demand in bond markets is being driven by record deficitsthedailyeconomy.org. In Mueller’s words, “only Congress can rein in the spending that keeps long-term yields — and mortgage rates — stubbornly high”2 .
Mortgage demand remains subdued. Freddie Mac and other data show rates near their lowest in about a year after easing gradually, but still well above early-2024 lowsbloomberg.comthedailyeconomy.org. High financing costs have kept potential buyers waiting on the sidelines. Redfin reports that pending home sales are down and typical sale times are back to 2019 levels, as buyers “aren’t budging” until rates dip furtherreuters.com. Refinancings have ticked up modestly, but overall housing activity is soft. In short, Fed rate cuts have done little to ease mortgage burdens so far.
Federal Reserve and Economic Context
The disconnect between Fed policy and mortgage rates reflects deeper trends. Since last fall, the Fed has lowered its policy rate by over 1% (from ~5.3% to ~4.1%), yet the 10-year yield has risen from ~3.8% to ~4.2%thedailyeconomy.org. This is largely a market-driven response to massive Treasury issuance. The U.S. federal debt has roughly tripled in 25 years, reaching ~$36.1 trillion by 2025thedailyeconomy.org. Every year the government issues new bonds to roll over and fund its deficits (around $1.7–3.1 trillion per year since 2019)thedailyeconomy.org. The glut of bonds pushes prices down and yields up — hence higher mortgage costs.
Fed officials are aware of the dilemma. Most policy members expect additional rate cuts as the economy slows. Governor Bowman, who dissented for an earlier cut, reiterated she “continues to see two more cuts before the end of this year”reuters.com. Yet minutes from the October Fed meeting showed “lingering inflation concerns” remaints2.tech. As one analyst warns, the Fed will likely talk tough on inflation even as it lowers ratests2.tech. At a recent event, Bowman stressed that progress on jobs and prices is key: “as long as we see the labor market and other data evolving in the way that I expect, then we will continue to be on a path for lowering the federal funds rate”reuters.com. In other words, the Fed is trying to balance still-elevated inflation (~2.9% in Sept) against modest job market cooling.
Stock Market Rally Continues
Despite economic uncertainties (shutdown, trade tensions), stocks have shrugged off worries and kept rising. The S&P 500 closed at 6,753.72 on Oct. 8, its highest everts2.tech, with the Nasdaq and even the traditionally staid Dow not far behind. Mid-October brought more record highs: on Oct. 15 the S&P closed at 6,671 (up 0.40% on the day) and the Nasdaq at 22,670 (up 0.66%), powered by bank earnings and chip stocksreuters.com. Bank of America jumped 4.4% and Morgan Stanley 4.7% on very strong profitsreuters.com. Goldman and JPMorgan had already reported robust investment-banking results. This “strength for major U.S. companies” in Q3 profits has bolstered sentiment even as data releases are delayed by the government shutdownreuters.com5 .
Tech and growth stocks are leading the charge. The so-called “Magnificent Seven” and other AI plays are up sharply. For example, TS2 notes Alphabet (Google) stock flirting with a $3 trillion market cap – up ~30% year-to-datets2.tech – and AMD up ~96% YTD as of mid-Octoberts2.tech. The Philadelphia semiconductor index jumped 3% on Oct. 15 after ASML reported blowout orders for chips driven by AIreuters.com. In TS2’s words, “momentum is on the side of investors” right nowts2.tech. Many strategists say bullish tech earnings and easier Fed policy justify these levels. As Rosenblatt’s Michael James observes, nothing in the Fed’s dovish message “shook the market’s upbeat momentum – the bulls remain fully in charge”ts2.tech. The rally has breadth, too: on Oct. 15, all eleven S&P sectors moved higher, led by real estate (+1.5%) and utilities (+1.3%)6 .
Tech & AI Mega-Deals
A big catalyst for stocks has been AI. This week brought a headline $40 billion data-center deal: Microsoft, Nvidia, and BlackRock agreed to acquire Aligned Data Centers, expanding cloud capacity for AI workloads. Strategist Zev Fima notes the deal “reinforces that we’re in the early innings of the AI trend”ts2.tech. These mega-investments fuel chip and cloud providers: Nvidia and AMD (which contract with Intel/Microsoft for Instinct GPUs) rose on news, and analysts pummeled up price targets. In fact, Oracle’s announcement that it will deploy 50,000 AMD AI chips sent AMD up 6% on Oct. 16ts2.tech. Wedbush and others hiked AMD’s target to ~$270–$310, reflecting confidence in its cloud efforts. At the same time, TSMC — the world’s top chipmaker — is raising its guidance. Its CEO C.C. Wei declared “AI demand actually continues to be very strong… more strong than we thought three months ago”reuters.com and boosted 2025 revenue growth to the mid-30% rangereuters.com. These comments underscore how robust the AI hardware cycle has become.
Corporate earnings have generally surprised on the upside, and many analysts have turned bullish. TS2 highlights that BlackRock (asset manager) and semiconductor firms have delivered strong results, and even industrial players like Merck are gaining valuation supportts2.techts2.tech. However, the froth has led some to warn of excess: prominent AI chip deals have raised “concerns about the formation of a bubble reminiscent of the dot-com boom”reuters.com. For now, markets are ignoring that, focusing instead on the Fed’s easing and robust tech revenues. As long as inflation stays tame (headline CPI was ~2.9% in Aug) and the Fed cuts again, most strategists see room for more upside. Thomas Martin of GLOBALT sums up the view from last week: “People are spending, and the consumer seems to be fine… Both inflation and employment are within ranges that are basically reasonable”reuters.com. In short, strong earnings and easy policy are fueling equities even as the traditional safe haven (Treasuries) languishes.
Market Outlook: Balancing Risks
Going forward, market watchers say the coming week’s key events will be Fed Chair Powell’s speech and the (delayed) jobs and inflation data. Futures still price in a high probability of a 25 bp cut at the Oct. 28–29 Fed meetingts2.tech. If the Fed follows through, short-term borrowing costs will fall further. But without fiscal reform, long-term rates may stay elevated, keeping mortgages pricey. Some Wall Street strategists caution that if upcoming CPI or payroll reports show stubborn inflation, bond yields could jump, hurting high-multiple stocks. On the flip side, if the shutdown ends and data paint a “Goldilocks” scenario (slightly cooling prices, still-solid growth), it could justify both Fed cuts and stock gains7 .
For now, investors are closely watching key names and indicators. Analysts like TS2’s Marcin Frąckiewicz note that the Dow has run into a technical pivot point after its rallyts2.tech, suggesting the market could either break higher or see a pullback. Meanwhile, the big tech titans have run valuations well ahead of the S&P 500’s average; TS2 reports Alphabet’s Q3 revenue and earnings forecasts imply continued double-digit growthts2.tech. If earnings continue surprising, the bullish trend could extend. But if high valuations collide with fresh negative news (inflation or geopolitics), we could see more volatility.
In summary: Homebuyers are frustrated as the Fed’s rate cuts haven’t translated into lower mortgages, primarily due to persistent inflation and record government borrowingthedailyeconomy.orgthedailyeconomy.org. At the same time, stocks have surged on strong bank and tech earnings and an AI-driven investment boomreuters.comts2.tech. Experts emphasize that sustaining this rally hinges on continued Fed easing and contained inflation. As one Fed watcher put it, politics and policy matter: Congress “has to cut spending… The Federal Reserve can’t do it for them,” or else long-term borrowing costs will stay highthedailyeconomy.orgthedailyeconomy.org. Investors are watching all these moving parts as they chart a course through late-2025’s market extremes.
Sources: Fed and market data cited from Reutersreuters.comreuters.comreuters.com, Bloombergbloomberg.com, Yahoo/TS2ts2.techts2.techts2.tech, Freddie Mac and Freddie Mac (via media)bloomberg.com, and commentary by Paul Mueller/AIERthedailyeconomy.orgthedailyeconomy.org and TS2 Market Analysists2.tech8 .


