Brent nears $109 as oil prices rise today and Hormuz risk premium builds
28 July 2026
2 mins read

WTI Crude Trades Close to $82 Following Iran Pause, War-Driven Surge Recedes

WARSAW, July 28, 2026, 01:11 CEST — WTI trading electronically; ICE Brent not trading. Trade in CME’s WTI contract continued, as Brent oil futures remained inactive between London’s daily sessions.

  • WTI stood at $82.11, a decline of 0.6% compared to Monday’s close.
  • Brent closed at $88.36, down 8.7%, while WTI declined 7.5%.
  • Despite significant limits on Gulf shipping, both benchmarks settled under July 20 marks.

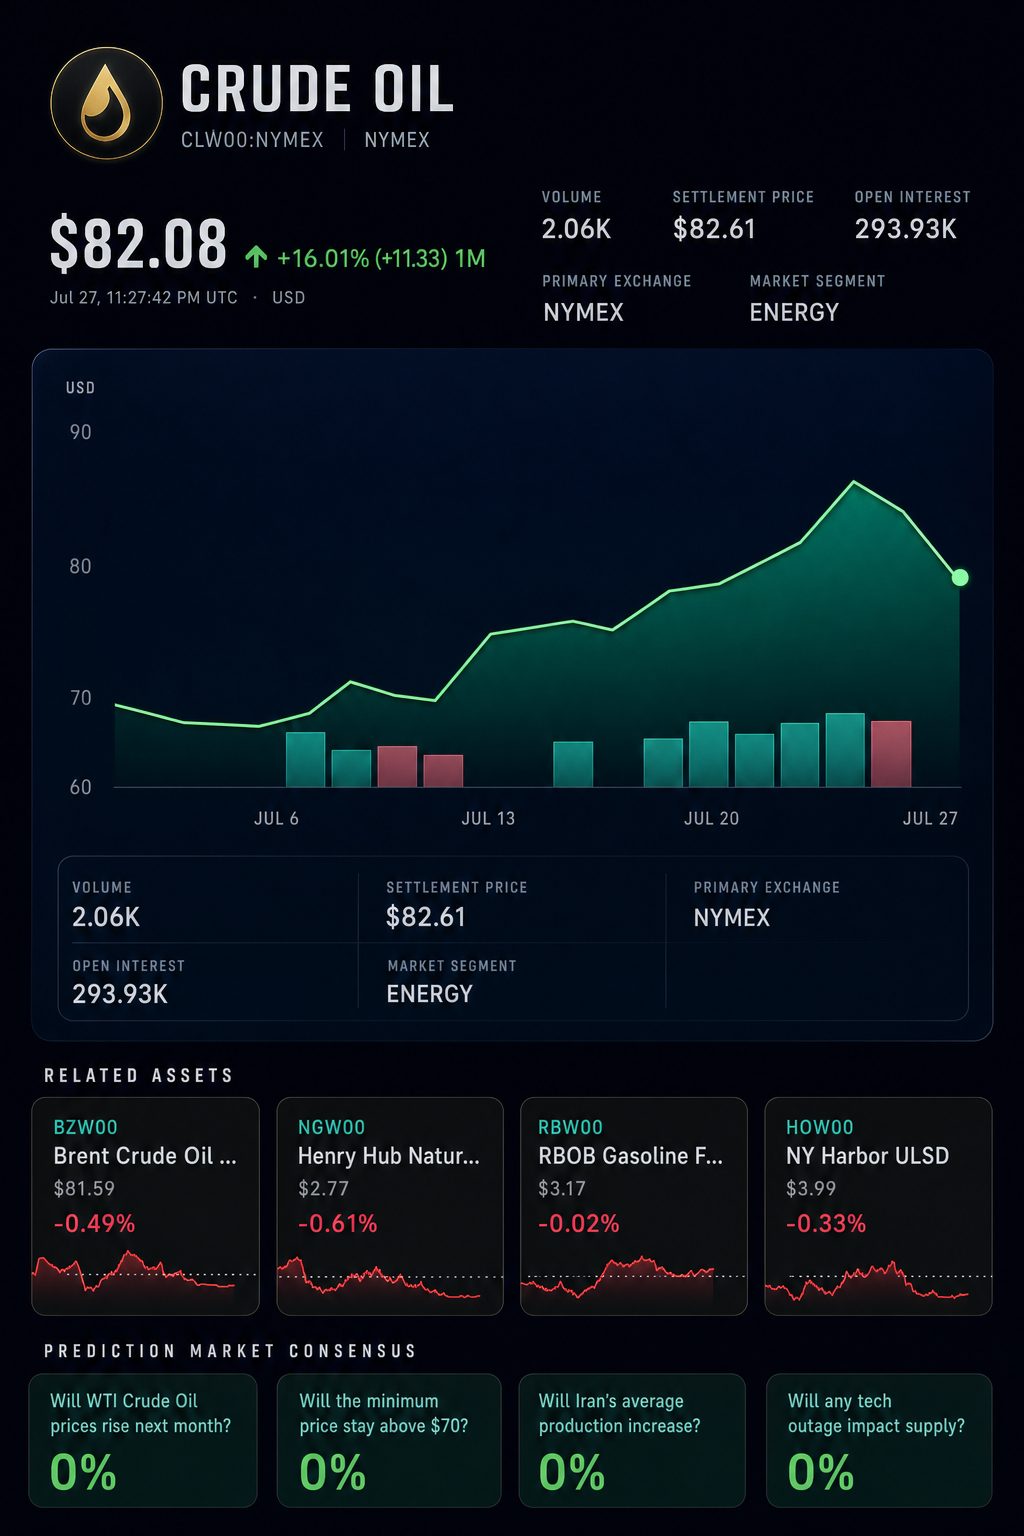
Oil prices hovered close to Monday’s lows in early trading on Tuesday. September WTI was last seen trading near $82.11 per barrel, after starting the session at $81.89.

The losses came after a sharp decline on Monday. Brent slid $8.42, closing at $88.36—its weakest finish since July 17. WTI declined $6.70 to end at $82.61, also marking a low not seen since July 16.
WTI Crude Trades Close to $82 Following Iran Pause, War-Driven Surge Recedes

Washington halting air strikes on Iran prompted the pullback. Markets factored in a higher likelihood of negotiations and more open transit through Hormuz. However, there is still no official deal in place.

The investor signal stands out as especially clear. Futures reversed the previous week’s war surge even before any significant recovery in physical oil flows.

BenchmarkJuly 20 closeJuly 24 closeJuly 27 closeChange since July 20
Brent$89.22$96.78$88.36-1.0%
WTI$83.23$89.31$82.61-0.7%

Reuters settlement figures; percentage movements computed and rounded. 

The reversal indicates traders are prioritizing diplomatic efforts over oil volumes. Brent and WTI are both trading under their levels from before the surge, while Gulf exports continue to face limitations.

Over the weekend, under 10 commodity ships passed through the Strait of Hormuz each day. According to a Reuters-cited analyst estimate, traffic was close to 15% of its pre-war volume. Typically, daily shipments of crude, condensates and products averaged about 20 million barrels.

PVM analyst John Evans stated the market remained “forever seeking good news from an arena that really is not providing any.” He added the halt did not assure oil flows would soon return to previous levels. Reuters

Supply issues persist beyond the Gulf region. Kazakhstan experienced a greater than 50% drop in output after its primary Black Sea export hub shut down due to drone strikes. Exports later picked up again, which helped contain the short-term impact.

U.S. stockpiles offer just limited support. Last week, commercial crude inventories increased by 2 million barrels, reaching 411.7 million. Levels were still around 6% under the typical five-year average for this season. Refineries ran at 96.1% capacity.

The overall scarcity premium remains in place. The Energy Information Administration projects global inventories to decline by 2.2 million barrels per day in the third quarter. For the fourth quarter, it forecasts inventories to rise by 2.7 million barrels per day.

The EIA projects Brent crude will average $70 in the fourth quarter. Monday’s closing price of $88.36 stood 26% higher than that estimate. The disparity indicates ongoing immediate supply and shipping threats.

The upcoming challenge comes with inventory figures. The American Petroleum Institute’s initial estimate will be released on Tuesday. The EIA’s official report is due Wednesday at 10:30 a.m. Eastern time.

Risks: An agreement in place and more tankers at sea may keep oil falling. The risk premium may return rapidly if strikes begin again, or if drone attacks or vessel seizures occur.


What is the latest position of Brent and WTI following Monday’s decline?

Brent crude finished Monday at $88.36 a barrel, dropping 8.7%. U.S. WTI ended at $82.61, down 7.5% in the session. Both oil benchmarks registered their lowest closes in over a week. In late electronic trading, September Brent was quoted near $87.75, with WTI around $81.92. September Brent futures expire July 31, shifting focus to October contracts. Reuters

What caused the steep decline in oil prices?

The selloff erased some of last week’s Middle East war premium. The United States halted air strikes to pursue further diplomatic engagement with Iran. President Donald Trump noted ongoing talks, with no formal framework yet agreed. Brent dropped roughly 12.2% between Thursday’s $100.69 settlement and Monday. Physical oil flows showed minimal recovery. Reuters

Is regular tanker passage once again occurring in the Strait of Hormuz?

No, not by conventional standards. Over the weekend, fewer than 10 commodity ships passed through Hormuz each day. On Sunday, Kpler reported seven transits, even as attacks halted. An SEB analyst put flows at about 15% of levels before the conflict. Normal daily crude, condensate and product shipments are typically around 20 million bpd. At Bab el-Mandeb, only 11 commodity ship passages were tracked on Sunday. Reuters

What might push Brent to exceed $100 again?

Further strikes or a renewed tanker incident could swiftly bring back the war premium. Brent ended last Thursday at $100.69 and then dropped below $90 on Monday. Barclays maintained average Brent forecasts at $96 for 2026 and $85 for 2027. The bank stated that a three-month closure of the Hormuz Strait could drive spot Brent prices near $150, describing this as a stress scenario rather than its central outlook. Reuters

What factors are key for investors in the upcoming U.S. inventory report on Wednesday?

The most recent EIA update indicated commercial crude stocks climbed by 2.0 million barrels, bringing inventories to 411.7 million—6% below the five-year mean. Gasoline supplies rose by 0.8 million barrels, and distillate stocks were up 1.4 million, staying 7% and 10% shy of typical seasonal levels, respectively. Refineries operated at 96.1% capacity, providing little scope to boost output further. The following report is set for release on July 29 at 10:30 a.m. Eastern. U.S. Energy Information Administration

Has demand destruction reached a level that could limit oil prices?

Demand indicators show a mixed outlook. Over four weeks, average U.S. product demand stood at 20.4 million bpd, 1% lower than the previous year. Gasoline demand increased by 1%, distillate by 2%, and jet fuel by 9%. China’s crude imports in June slumped 41.3% year-on-year to 7.12 million bpd. The IEA projects a global demand drop of 1 million bpd in 2026. Nonetheless, a Reuters poll of analysts still predicts a supply shortfall of 1.5 million bpd. U.S. Energy Information Administration

Is OPEC+ able to counterbalance the present supply disruption?

No, not independently. Seven OPEC+ countries agreed to raise production by 188,000 barrels per day in August. The group convenes again on August 2 and may halt or roll back upcoming increases. The planned boost amounts to less than 1% of typical oil traffic through Hormuz. Crucially, output allocations cannot reopen a closed shipping passage. As a result, actual supply delivery relies more on the secure transit of tankers. OPEC

What does the futures curve indicate regarding short-term supply?

Late Monday, September Brent was quoted close to $87.75, with October at about $85.34. For WTI, September traded near $81.92 and October at roughly $79.75. This $2-plus backwardation keeps prompt barrels priced higher than later months. The forward curve continues to reflect near-term supply tightness, even after Monday’s sharp price drop. September Brent expires July 31, with the front spread likely to stay volatile. MarketWatch

What are the key events to watch in the coming week?

Headlines on shipping and diplomacy continue to pose the most significant near-term risk for the market. The EIA is set to publish U.S. inventory figures on Wednesday at 10:30 a.m. Eastern. The Federal Reserve will reveal its policy decision at 2 p.m. Eastern on the same day. OPEC+ is scheduled to meet Sunday, August 2, to assess market conditions and production strategy. The impact of a signed U.S.-Iran framework agreement would outweigh routine macroeconomic releases. In its absence, daily tanker movements remain the most immediate gauge for oil markets. U.S. Energy Information Administration

Jerzy Lewandowski is a senior markets editor at TS2.tech covering stocks, artificial intelligence, semiconductors and global financial markets. He studied economics at the University of Warsaw and previously worked in investment analysis before moving into financial journalism. His daily coverage focuses on the trends and events that matter most to investors worldwide. Follow Jerzy Lewandowski on Google News.

Stock Market Today

  • July 28, 2026 IPO Preview: Notable Listings Scheduled
    July 27, 2026, 8:47 PM EDT. Key IPOs set for July 28, 2026 feature five anticipated debuts: Baillie Gifford U.S. Equity Growth ETF and Catalyst Acquisition Corp. Units on Nasdaq, Ionic Digital Inc. Class A Common Stock also on Nasdaq, alongside Morgan Stanley Solana Trust and Morgan Stanley Ethereum Trust on NYSEArca. Market data remains delayed, with pricing and share information still pending.
Universal Health Services (NYSE:UHS) shares drop on guidance reduction; EPS rise tied to share repurchases
Previous Story

Universal Health Services (NYSE:UHS) shares drop on guidance reduction; EPS rise tied to share repurchases

Australia Stock Market Today: ASX 200’s Six-Day Slide Deepens as Oil Shock Puts RBA in Focus
Next Story

ASX 200 Prepares for CPI, Tech Challenges After Oil-Led Rally