NEW YORK, July 31, 2026, 15:16 EDT
- AMC stock declined 0.4% to $2.76 as U.S. markets stayed open.
- Spider-Man: Brand New Day set a new benchmark, earning $72 million during its preview screenings.
- The newest official share tally from AMC suggests an equity value of $2.46 billion, standing 24% higher than the market capitalization shown on live quote feeds.
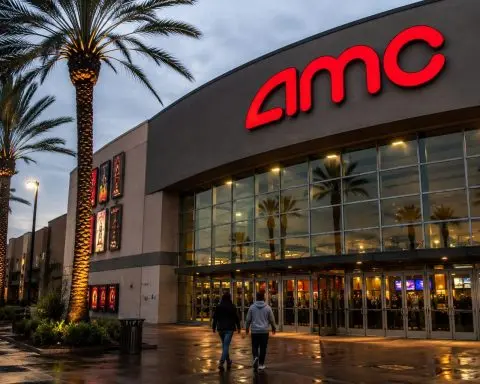
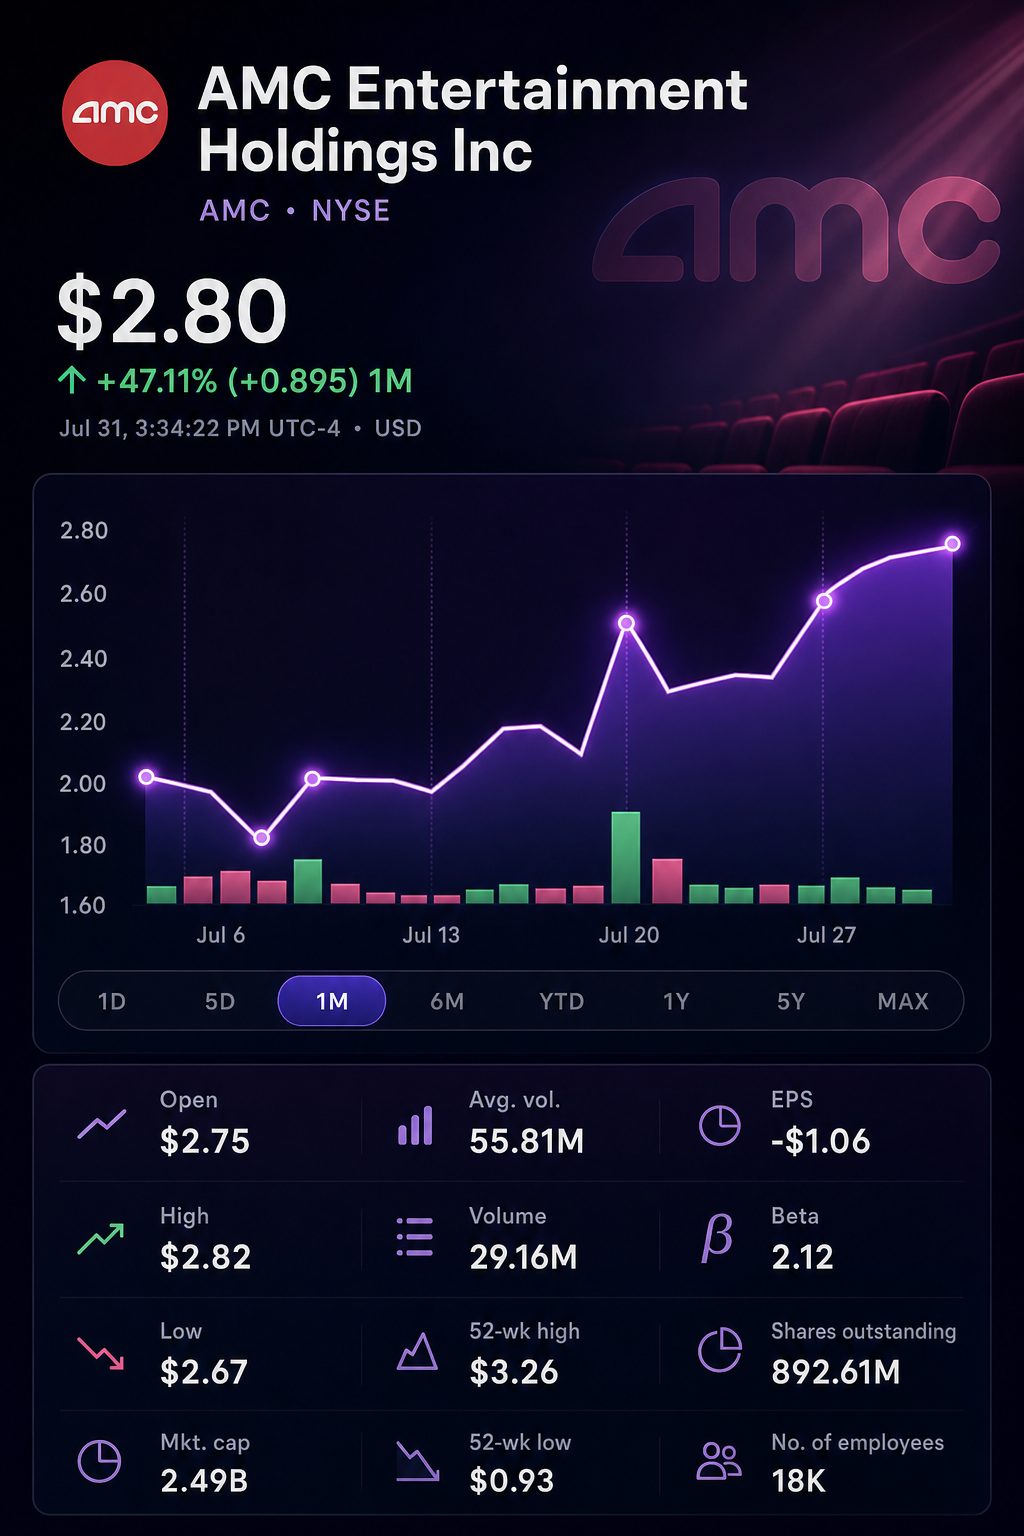
Shares of AMC Entertainment Holdings, Inc. NYSE:AMC dropped to $2.76 on Friday, as record-breaking Spider-Man previews were not enough to boost the stock.
| Exhibition-sector company | Price | Day move | Trailing EPS | Live-feed market value |
|---|---|---|---|---|
| AMC Entertainment Holdings, Inc. NYSE:AMC | $2.76 | down 0.4% | -$0.77 | $1.99 billion |
| Cinemark Holdings, Inc. NYSE:CNK | $36.50 | up 1.0% | $3.72 | $8.49 billion |
| IMAX Corporation NYSE:IMAX | $47.71 | up 0.2% | $0.73 | $2.70 billion |
| National CineMedia, Inc. (NASDAQ:NCMI) | $3.95 | down 1.3% | -$0.09 | $368 million |
Quotes as of approximately 15:01 EDT. AMC’s reported market capitalization is based on a smaller share count than in its most recent filing.
Shares of Cinemark and IMAX rose. Both companies posted positive trailing earnings, in contrast to AMC and National CineMedia.
The challenge facing investors is the denominator. As of July 22, AMC reported 892.6 million shares outstanding, an increase of 74% from the total on February 6.
Based on Friday’s price, the equity is valued at approximately $2.46 billion. The live feed indicates $1.99 billion. The implied share count is around 722 million, consistent with AMC’s quarterly weighted average share number. This indicates the feed may not reflect the latest share issuance.
| Share-count and valuation check | Earlier or displayed basis | Latest or implied basis | Difference |
|---|---|---|---|
| Shares outstanding | 513.9 million, Feb. 6 | 892.6 million, July 22 | +73.7% |
| Q2 diluted weighted-average shares | 433.1 million, 2025 | 722.0 million, 2026 | +66.7% |
| Equity value at $2.76 | $1.99 billion, live feed | $2.46 billion, official share count | +23.6% |
Figures are based on AMC’s filings and the most recent share price.
The optimistic scenario is based on real operating leverage. In the second quarter, revenue rose by 14.2%. Adjusted EBITDA jumped 69.6%. For each additional revenue dollar, AMC generated roughly 66 cents in incremental EBITDA.
| AMC operating metric | Q2 2026 | Q2 2025 | Change |
|---|---|---|---|
| Revenue | $1.597 billion | $1.398 billion | +14.2% |
| Attendance | 71.29 million | 62.81 million | +13.5% |
| Average ticket price | $12.11 | $12.14 | -0.2% |
| Food and beverage per patron | $8.08 | $7.95 | +1.6% |
| Operating income | $238.1 million | $92.6 million | +157.1% |
| Adjusted EBITDA | $321.4 million | $189.5 million | +69.6% |
| Free cash flow | $190.1 million | $88.9 million | +113.8% |
Company figures; percentage movements based on reported data.
The boost was driven mainly by higher attendance, not increased ticket prices. The number of patrons climbed 13.5%. The average ticket price dropped by three cents, and spending at concessions went up.
The quarter concluded with a net loss of $11.4 million. Operating income was $238.1 million, but other expenses totaling $246.1 million offset the operating profit.
Interest expenses amounted to $136 million, representing 42% of adjusted EBITDA. This continues to be the main factor linking robust theater operations with weak GAAP profitability.
Chief Executive Adam Aron described the quarter as “nothing short of extraordinary.” He stated that growing revenue had revealed AMC’s operating leverage. SEC
Part of the balance-sheet improvement was supported by dilution. AMC sold 200.6 million shares, raising $350 million gross in the first half. Additionally, 142.1 million shares were issued to holders of exchangeable notes.
| First-half equity activity | Shares sold | Total gross proceeds | Weighted average price |
|---|---|---|---|
| Direct placement | 95.3 million | $200.0 million | $2.10 |
| At-the-market program | 105.3 million | $150.0 million | $1.42 |
| Subtotal from cash offerings | 200.6 million | $350.0 million | $1.74 |
| Settlement of exchangeable notes | 142.1 million | Exchanged, non-cash | — |
Average prices are based on gross proceeds prior to any fees.
Liquidity improved as a result of these measures. Cash rose by $349.9 million compared to December, and principal debt was reduced by $110 million. However, financing cash flow for the first half totaled $297.6 million. Operating activities generated $106.9 million.
The upcoming weekend presents a new opportunity to assess operating leverage. Spider-Man: Brand New Day brought in $72 million from previews, topping the earlier record of $60 million by 20%.
| Current box-office indicator | Spider-Man result or estimate | Comparison | Difference |
|---|---|---|---|
| Thursday previews | $72 million reported | Avengers: Endgame: $60 million | +20% |
| Domestic opening forecast | $280 million-$300 million, early estimate | The Odyssey: $124.5 million debut | 2.25-2.41 times |
| Weekend showtime share | 49% | The Odyssey debut: 22% | +27 percentage points |
The initial projection is still subject to revision and may see significant adjustments.
AMC is maintaining strong traction with premium formats. The Odyssey achieved its largest-ever IMAX revenue over two weeks for an individual film. Roughly 50% of IMAX screens in the U.S. are managed by AMC.
eMarketer analyst Ross Benes advised prudence. “Strong quarters, like this one, will happen now and again,” he noted. He anticipates ongoing challenges for the industry as a whole. Reuters
Risks stay elevated. Weekend projections are early, and film expenses took up 51% of second-quarter admissions income. As of June 30, AMC’s principal debt stood at $3.91 billion. Additional share offerings may dilute current shareholders.
AMC confronts a pair of challenges. Its theatres need to maintain strong attendance, while the company’s cash production must exceed both interest expenses and the rising number of shares.
Related articles: NYSE:AMC