HELSINKI, August 4, 2026, 15:05 EEST — Nasdaq Helsinki session underway.
- Nokia climbed 5.9% to €8.58, with the OMX Helsinki 25 advancing 1.24%.
- AI and cloud orders totaled €2.8 billion in the second quarter, compared to €1 billion in the previous quarter.
- Initial estimate: Based on Nokia’s conversion guidance, revenue of roughly €1.4 billion is expected over the next 12 months.
Nokia Oyj HEL:NOKIA gained 5.9% to reach €8.58 as of 14:48 EEST on Tuesday, outperforming the OMX Helsinki 25 by 4.66 percentage points. Technology shares in Europe increased by 1.7%.
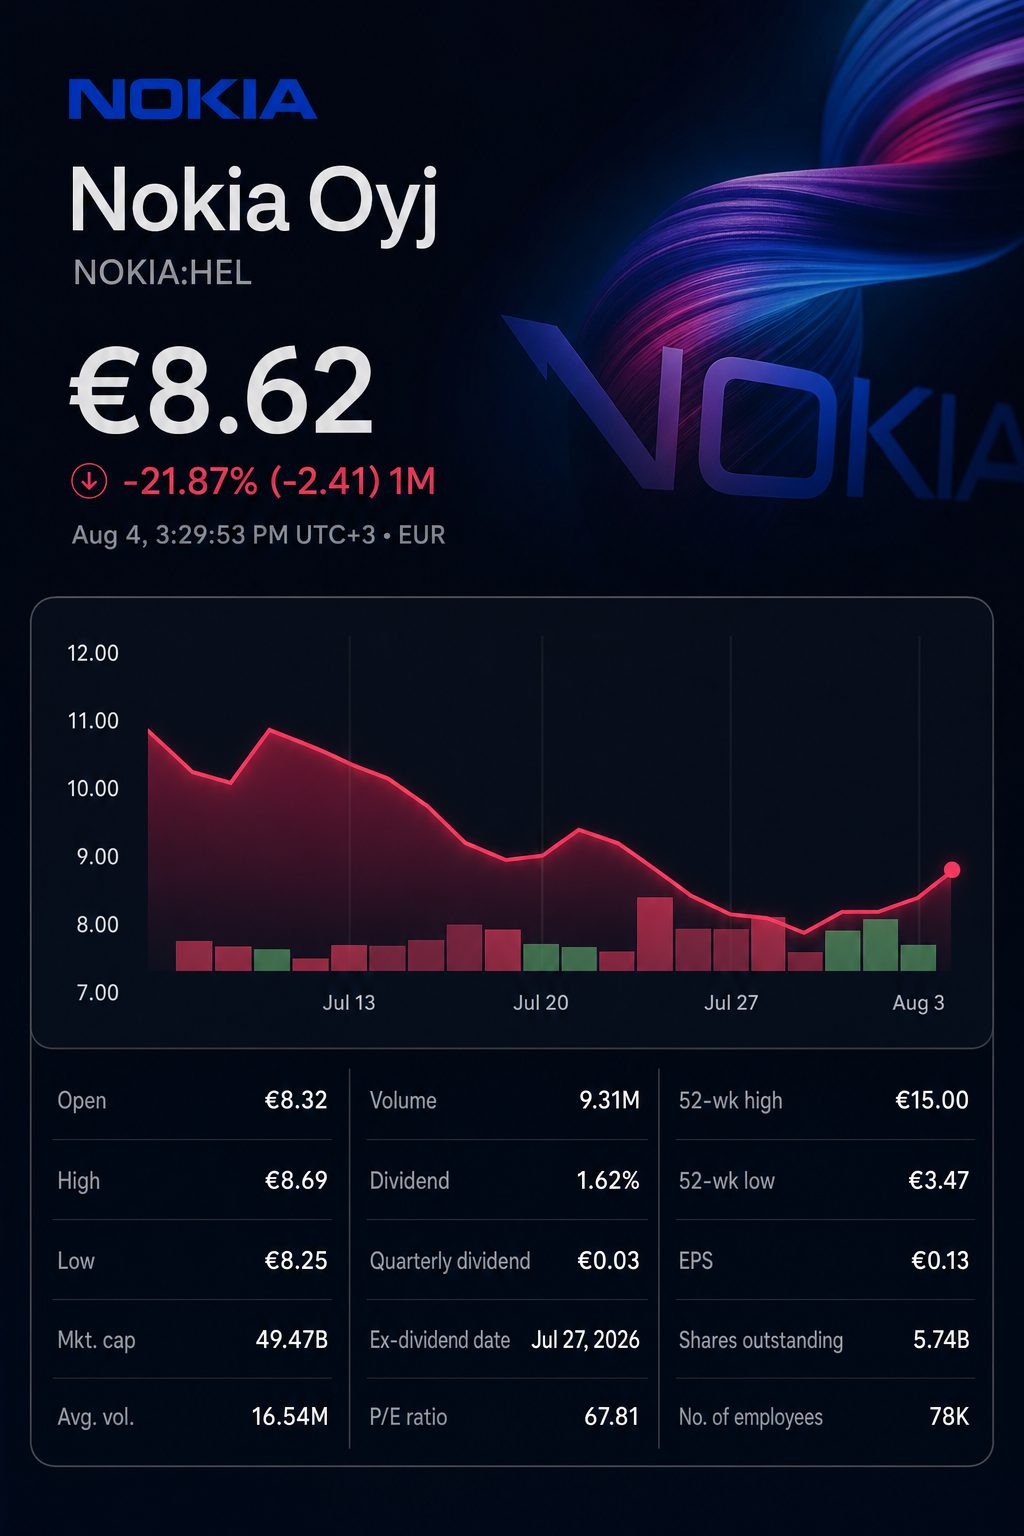
The advance continues a four-day recovery since the July 29 close. Nokia has risen 13.6% from €7.556. Shares are still 1.4% under their July 23 close after results. The reset has yet to be completely reversed.
| Latest reading | Level or price | Day move | Nokia outperformance |
|---|---|---|---|
| Nokia | €8.58 | +5.90% | — |
| OMX Helsinki 25 | 6,288.31 | +1.24% | 4.66 percentage points |
| STOXX Europe 600 technology sector | — | +1.70% | 4.20 percentage points |
Most recent data during Tuesday’s session in Europe.
By mid-afternoon, Nokia had not released any new operating update. The most recent posts in its archive, following Q2, were manager-dealing notices. The largest confirmed factor on the day was the broad rally in technology shares.
Investors are primarily concerned with this: how fast are orders converted into revenue? In Q2, Nokia reported €2.8 billion in AI and cloud orders, a figure that is 2.8 times higher than the €1 billion recorded in Q1.
| AI and cloud demand bridge | Value | Change or scale |
|---|---|---|
| Q1 order intake | €1.0 billion | Baseline |
| Q2 order intake | €2.8 billion | Up 180% sequentially |
| 12-month conversion anticipated by company | Roughly half | Management outlook |
| Preliminary conversion estimate | Approximately €1.4 billion | 50% of Q2 intake |
| Compared to annualized Q2 Network Infrastructure sales | 17.2% | Run-rate basis |
| Compared to annualized Q2 group sales | 7.3% | Run-rate basis |
Q2 sales are annualized by multiplying by four. These figures do not represent forecasts from Nokia.
Initial estimate: Based on Nokia’s phrasing, this suggests revenue near €1.4 billion over 12 months. This figure is 17.2% of Q2 Network Infrastructure sales when annualized, and 7.3% of annualized total group sales. The amount is significant.
Nokia Chief Executive Justin Hotard stated the company anticipates “around half of these orders to convert to revenue over the next twelve months.” He also noted that supply continues to be the primary constraint for the industry. Nokia Corporation | Nokia
| Q2 results | 2026 | 2025 | Difference |
|---|---|---|---|
| Net sales | €4.815 billion | €4.443 billion | +8% |
| Comparable operating profit | €434 million | €367 million | +18% |
| Comparable operating margin | 9.0% | 8.3% | +0.7 percentage point |
| Reported operating result | -€50 million | €147 million | Loss from profit |
| Network Infrastructure sales | €2.037 billion | €1.825 billion | +12% |
| AI and cloud customer sales | — | — | +105% |
The earnings composition backs the order outlook, though it also highlights tensions. Comparable operating profit increased by 18%. Reported operations posted a €50 million loss. Nokia attributed the difference to accelerated restructuring.
Nokia maintains its full-year comparable operating profit forecast at €2.1 billion to €2.6 billion. The company described the €100 million rise as a technical adjustment, citing discontinued operations rather than improved operational expectations.
Management forecasts Q3 sales to increase by 3% to 7% compared with the previous quarter. Comparable operating profit is projected to stay roughly steady. A significant improvement is anticipated for Q4, highlighting the importance of conversion timing.
Valuation is still a limiting factor. Ericsson STO:ERIC-B traded at a price-to-earnings ratio of 13.0, while Nokia stood at 67.6 times. That puts Nokia’s multiple at 5.2 times Ericsson’s. Restructuring impacts the figures, yet the difference remains significant.
| Market metric | Nokia | Ericsson | Nokia relative |
|---|---|---|---|
| Latest price | €8.58 | SEK97.64 | — |
| Day move | +5.90% | +1.50% | Up 4.40 percentage points more |
| P/E ratio | 67.59 times | 12.97 times | Higher by 5.21 times |
| 52-week high | €15.00 | SEK128.45 | — |
| Drawdown from high | -42.8% | -24.0% | 18.8 percentage points lower |
| Market capitalization | €49.30 billion | SEK329.25 billion | Not directly comparable currencies |
(See on )
Ericsson gained 1.5% on Tuesday, underperforming Nokia. The difference points to investors favouring Nokia’s presence in optical and IP markets. Nokia posted 20% growth in optical and 16% in IP during Q2.
Risks: Revenue recognition could face delays due to supply constraints. Nokia anticipates restructuring charges of €800 million this year. Associated cash outflows are projected between €700 million and €800 million. Increased competition or reduced customer spending may hinder conversion.
The next major test comes with third-quarter results on October 22. Investors are looking to see if sales reflect order conversion. The backlog of orders remains substantial. Evidence is required.
Related articles: HEL:NOKIA