NEW YORK, August 4, 2026, 11:16 EDT
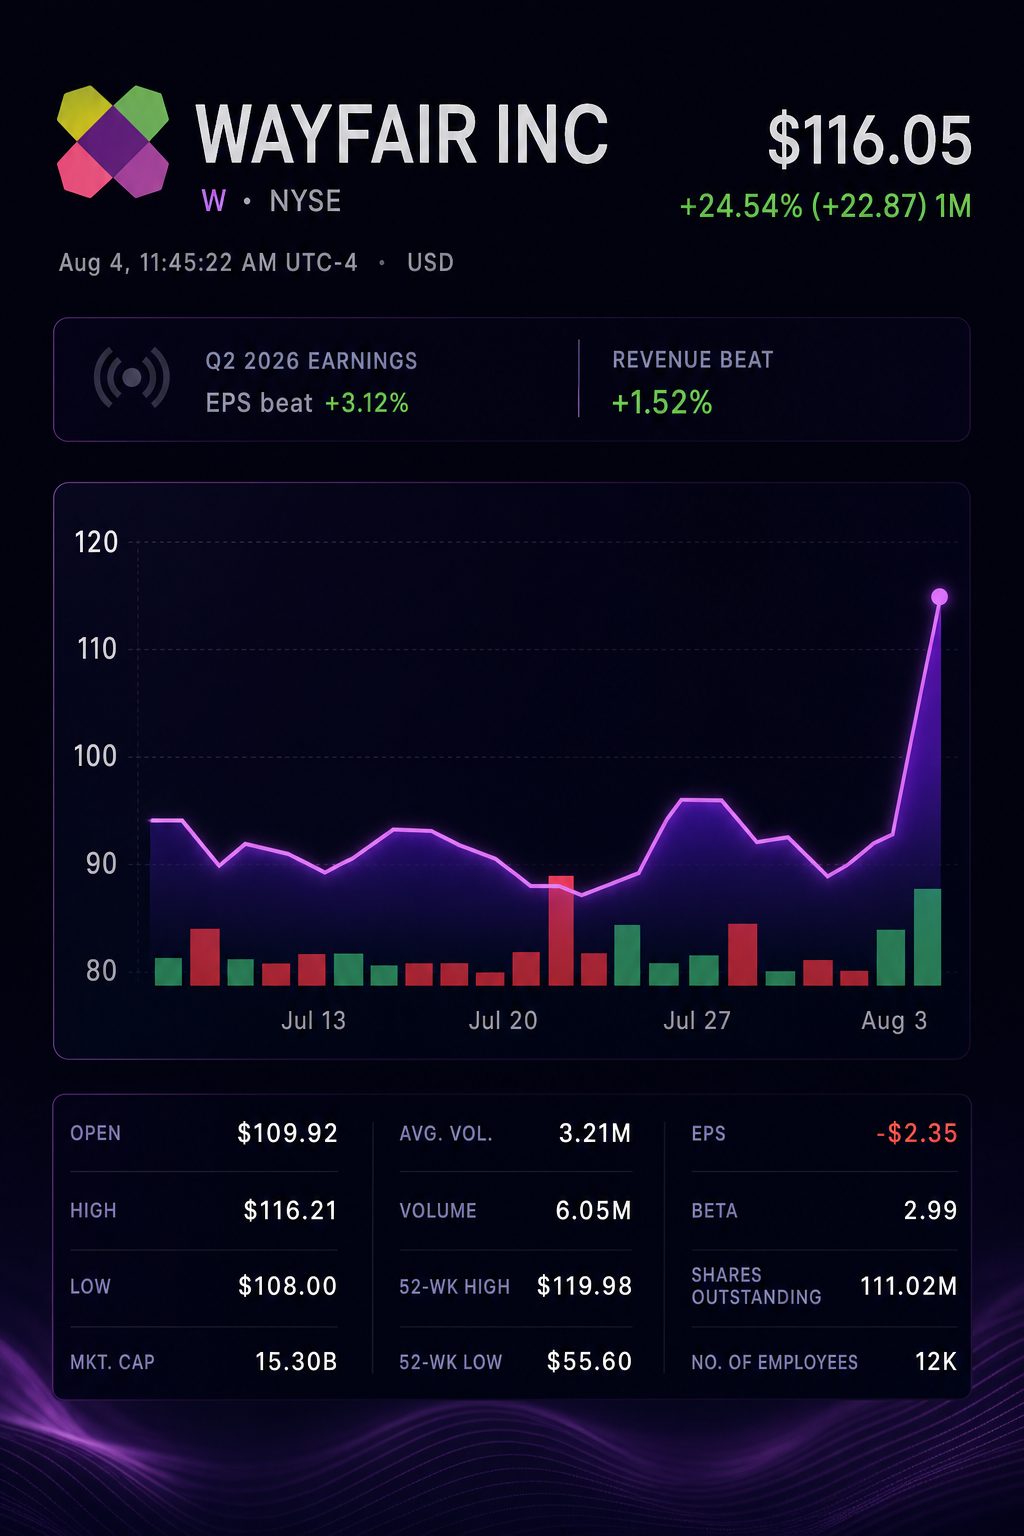
- Wayfair was last up 27.2% at $113.60 in U.S. morning trade.
- Revenue for the second quarter grew by 7.5%, while free cash flow climbed 30.9%.
- Roughly 35 cents in additional operating income resulted from every extra dollar in sales.
Wayfair stock jumped after the online furniture retailer surpassed quarterly expectations. The key takeaway was improved operating leverage, as revenue increased while fixed costs did not climb proportionally.
Revenue climbed by $246 million. Operating income jumped by $87 million, reaching $104 million, about six times higher than the same period a year ago. This results in an incremental operating margin of 35.4% based on reported numbers.
Gross margin edged down by 0.1 percentage point to reach 30.0%. However, overall operating expenses declined by $17 million. Expenses for selling, operations, technology and administration decreased by $37 million.
| Metric | Q2 2026 | Q2 2025 | Analyst estimate | Result |
|---|---|---|---|---|
| Revenue | $3.519 billion | $3.273 billion | $3.470 billion | $49 million above forecast |
| Adjusted diluted EPS | $0.95 | $0.87 | $0.90 | $0.05 higher |
| Operating income | $104 million | $17 million | — | Increase of $87 million |
| Free cash flow | $301 million | $230 million | — | Rose 30.9% |
According to Barron’s, data comes from Wayfair’s disclosures and analyst projections.
The gain in profit was seen below the gross-profit line. Operating expenses decreased to 27.0% of sales, down from 29.5%. Free-cash-flow margin grew to 8.6%, compared with 7.0%.
| Margin measure | Q2 2026 | Q2 2025 | Change |
|---|---|---|---|
| Gross margin | 30.0% | 30.1% | Declined 0.1 point |
| Operating expenses/revenue | 27.0% | 29.5% | Lower by 2.5 points |
| Operating margin | 3.0% | 0.5% | Increased 2.4 points |
| Adjusted EBITDA margin | 6.9% | 6.3% | Higher by 0.6 point |
| Free-cash-flow margin | 8.6% | 7.0% | Moved up 1.5 points |
Margins are based on company data and derived from disclosed numbers.
Wayfair Chief Financial Officer Kate Gulliver stated the company will “hold our fixed cost base steady.” Adjusted EBITDA totaled $242 million, with its 6.9% margin marking the highest since 2021. Benzinga
Cash conversion improved as well. Free cash flow in the first half surged to $195 million, up from $91 million, marking a 114% jump.
GAAP results showed more softness, as a $59 million debt extinguishment loss and a $39 million interest expense brought $104 million in operating income down to a $1 million net loss.
The majority of sales growth was attributed to higher volume. Delivered orders were up 6.0%, with the average order value edging 1.2% higher. The number of active customers climbed 3.3%.
| Customer measure | Q2 2026 | Q2 2025 | Change |
|---|---|---|---|
| Active customers | 21.7 million | 21.0 million | Rise of 3.3% |
| Revenue per active customer | $596 | $572 | Increase of 4.2% |
| Orders delivered | 10.6 million | 10.0 million | Growth of 6.0% |
| Average order value | $332 | $328 | Higher by 1.2% |
Wayfair released customer data covering the quarter that closed on June 30.
Quarterly growth was entirely driven by the U.S. segment, where revenue rose by $251 million. International revenue declined by $5 million, and the international segment continued to report a loss.
| Segment measure | Q2 2026 | Q2 2025 | Change |
|---|---|---|---|
| U.S. revenue | $3.125 billion | $2.874 billion | Increase of $251 million |
| International revenue | $394 million | $399 million | Decrease of $5 million |
| U.S. adjusted EBITDA | $261 million | $224 million | Rises $37 million |
| International adjusted EBITDA | $(19) million | $(19) million | No change |
Wayfair’s segment performance figures originate from its quarterly report.
Chief Executive Niraj Shah described U.S. growth as “the best we’ve seen in the entire post-COVID period.” Perigold’s sales climbed over 35%. Wayfair said the broader U.S. category was flat or only slightly positive. Wayfair Investor Relations
Management projects revenue to rise by a high-single-digit percentage in the third quarter. Adjusted EBITDA margin is anticipated within the 6% to 7% range. This outlook is based on expectations that the broader market will not recover.
Gross margin is projected to be at the low end of the 29.5% to 30.5% range. Spending on loyalty and customer experience is expected to put pressure on this figure. Management anticipates that advertising cost reductions will largely balance out this impact.
Wayfair’s increase sharply outpaced those of other key home-furnishing competitors. RH NYSE:RH advanced 8.5%, while Williams-Sonoma NYSE:WSM added 3.6%.
| Company | Latest price | Session change |
|---|---|---|
| Wayfair Inc. NYSE:W | $113.60 | Gained 27.2% |
| RH NYSE:RH | $188.48 | Rose 8.5% |
| Williams-Sonoma NYSE:WSM | $248.47 | Increased 3.6% |
Figures reflect the most recent prices from Tuesday’s opening session.
Wayfair’s surge in share price boosted its market value by approximately $3.2 billion. The magnitude indicates that investors are anticipating continued fixed-cost leverage, rather than reacting solely to a quarterly outperformance. The next test will come in the third quarter.
Risks: Housing turnover is still weak. International adjusted EBITDA remained in the red. Gross margin could decline, and the number of shares outstanding in the third quarter might reach around 137 million. Following Tuesday’s surge, the stock faces increased price sensitivity to any disappointment on growth or costs.
Related articles: NYSE:RH