TORONTO, August 4, 2026, 17:01 EDT — Trading has ended on the Toronto market.
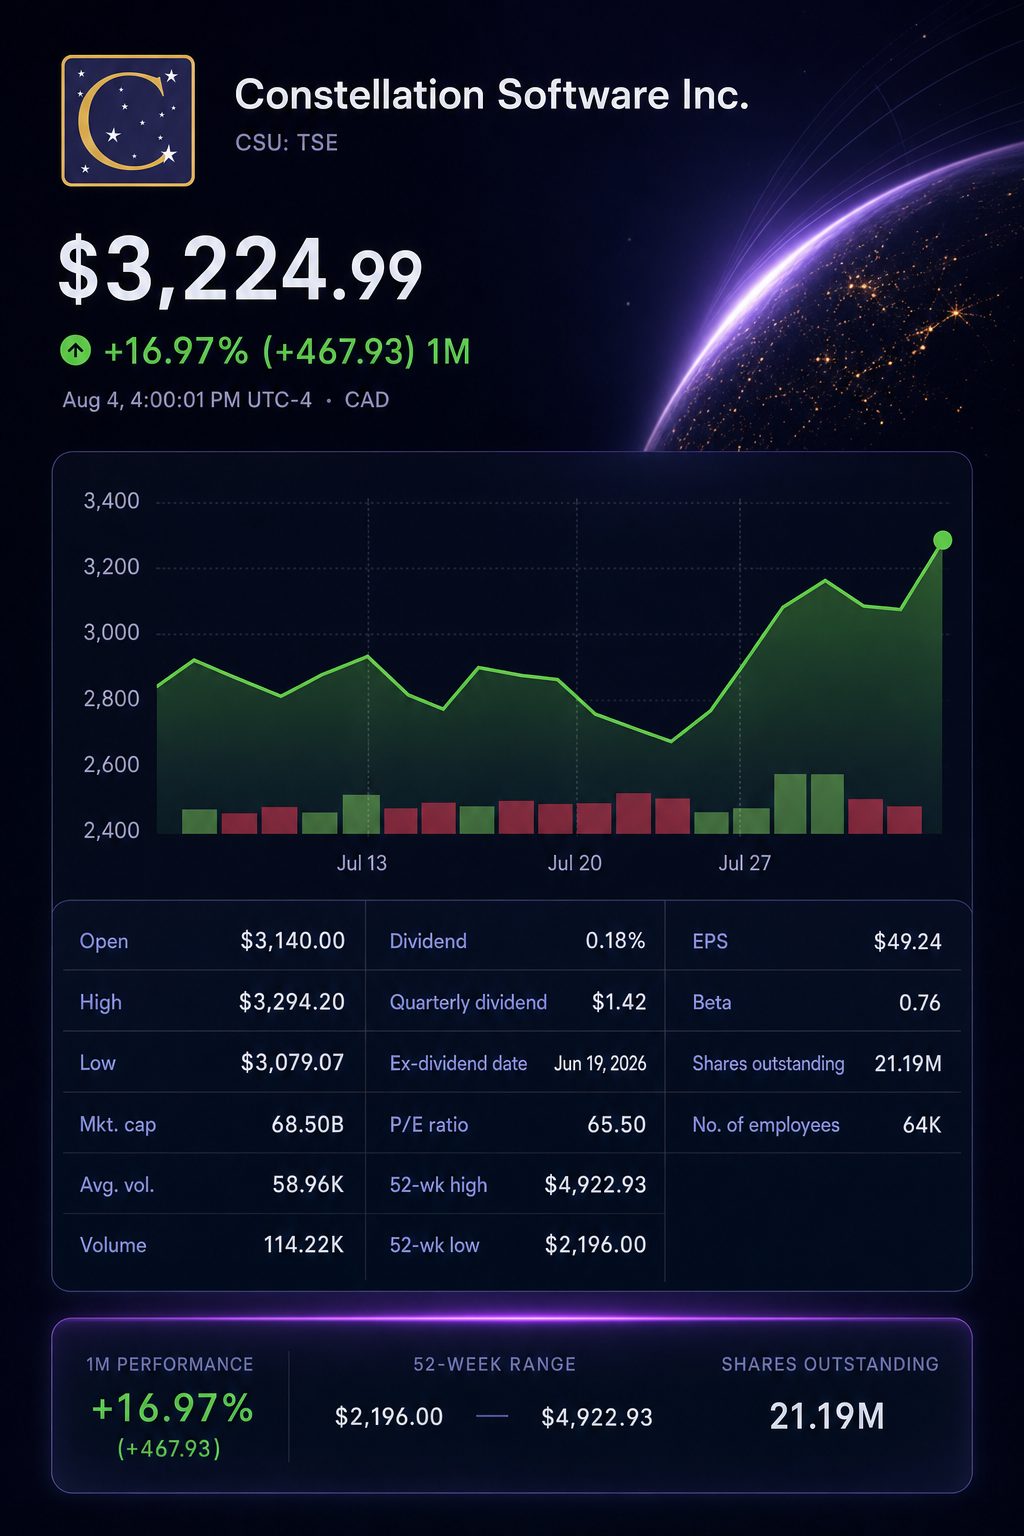
Shares of Constellation Software Inc. TSE:CSU jumped 7.39% to C$3,224.99 on Tuesday, boosting its market capitalization by approximately C$4.70 billion. Trading volume was 114,220 shares, close to twice its usual average.
The increase occurred in the absence of new company news. The move was close to the 7.1% advance in Toronto’s technology sector. Investors will watch next week’s results to see if the higher valuation continues.
Tuesday’s market action
| Metric | Reading | Context |
|---|---|---|
| Closing price | C$3,224.99 | Increased by 7.39% on Tuesday |
| Market value | C$68.50 billion | Market cap rose roughly C$4.70 billion |
| Trading volume | 114,220 | Volume was 1.94 times normal levels |
| Previous calendar week | +12.6% | From July 24 to July 31 |
| Year to date | -2.31% | Measured through August 4 |
| Distance from 52-week high | -34.5% | 52-week high stands at C$4,922.93 |
The cited data forms the basis for market value, volume, and return calculations.
Canada’s main index gained 1.6%, ending at an all-time high. Lowering Middle East tensions and advances in technology stocks boosted the market. “Markets are getting a bit of a breather,” said Shiraz Ahmed, Sartorial Wealth chief executive. Reuters
Market comparison for the same day
| Security or index | Closing level | August 4 move |
|---|---|---|
| Constellation Software Inc. TSE:CSU | C$3,224.99 | +7.39% |
| S&P/TSX technology sector | — | +7.10% |
| Lumine Group Inc. (CVE:LMN) | C$25.00 | +3.14% |
| Enghouse Systems Ltd. (TSE:ENGH) | C$17.65 | +2.74% |
| S&P/TSX Composite | 35,801.59 | +1.60% |
| Topicus.Com Inc. (CVE:TOI) | C$102.10 | +0.10% |
Constellation outperformed both of its regulated software subsidiaries and surpassed fellow acquisitive Canadian company Enghouse. This trend points to strong interest in the parent company, rather than a broad reassessment across the sector.
The recovery had begun. Shares climbed 12.6% over the prior week. Despite Tuesday’s action, they were still 34.5% under their 52-week peak.
First-quarter earnings demonstrated the stock’s potential for a swift rebound. Revenue increased by 20%, while free cash flow to shareholders (FCFA2S) surged 44%.
Operating performance in the first quarter
| Metric, US$ millions except EPS | Q1 2026 | Q1 2025 | Change |
|---|---|---|---|
| Revenue | 3,181 | 2,654 | +20% |
| Net income | 367 | 136 | +170% |
| Diluted EPS | $17.32 | $6.41 | +170% |
| Operating cash flow | 897 | 827 | +9% |
| FCFA2S | 733 | 510 | +44% |
Organic growth reached 6% prior to currency adjustments, but stood at 2% after excluding exchange-rate effects. The difference means that reported sales growth is increasingly vulnerable to currency fluctuations.
Constellation continued its acquisition activity, with first-quarter transactions totaling US$809 million in total consideration. Additional deals and commitments following the quarter contributed a further US$786 million.
Reported capital allocation
| Period | Cash at closing | Deferred consideration | Total consideration |
|---|---|---|---|
| Q1 acquisitions finalised | US$697 million | US$112 million | US$809 million |
| Completed or agreed after March 31 | US$627 million | US$159 million | US$786 million |
| Total | US$1.324 billion | US$271 million | US$1.595 billion |
The total payment amounted to 2.18 times first-quarter FCFA2S, moving the emphasis from the number of deals to cash conversion. Investors require proof that recent acquisitions will continue to meet Constellation’s return benchmarks.
Last month, Morningstar analyst Jivyaa Vaidya assigned a fair value of C$3,500. Vaidya also increased the stock’s uncertainty rating to high, citing target quality issues and higher acquisition multiples among her concerns.
The second quarter typically presents a seasonal dip. According to management, both operating cash flow and FCFA2S tend to reach their lowest levels in this period. The timing of maintenance and renewal activities accounts for much of this decrease.
Initial second-quarter consensus projections
| Metric, US$ millions | Q2 2025 actual | Q2 2026 estimate | Estimated change |
|---|---|---|---|
| Revenue | 2,844 | 3,354 | +17.9% |
| EBITDA | 805 | 934 | +16.0% |
| Operating profit | 469 | 540 | +15.1% |
| Net income | 56 | 306 | +446%* |
The rise in net income is based on an atypically low prior-year comparison.
The projections indicate a further quarter of double-digit sales expansion. While EBITDA is forecast to rise, it will likely trail the pace of revenue growth. As a result, cash generation could become a more significant focus than reported earnings.
Constellation is set to publish its results after markets in Toronto close on August 11. A conference call, hosted by Mark Miller, Jamal Baksh and Bernard Anzarouth, will begin at 08:00 ET on August 12.
Risks: A sector-driven surge may pull back ahead of earnings. Soft cash conversion, increased acquisition costs or reduced organic growth may weigh on the valuation. Fluctuations in currency can further skew reported growth figures.